| Param | Original file | Final file |
|---|---|---|
| Filename | modeM0/AS1C04_009T05_9000002968_19929cztM0_level2.evt | modeM0/AS1C04_009T05_9000002968_19929cztM0_level2_quad_clean.evt |
| Size (bytes) | 208,604,160 | 52,585,920 |
| Size | 198.9 MB | 50.1 MB |
| Events in quadrant A | 1,257,665 | 364,271 |
| Events in quadrant B | 1,415,351 | 365,927 |
| Events in quadrant C | 2,130,995 | 341,252 |
| Events in quadrant D | 1,348,897 | 348,374 |
| Mode SS | |||
|---|---|---|---|
| Quadrant | BADHDUFLAG | Total packets | Discarded packets |
| A | 0 | 50 | 0 |
| B | 0 | 50 | 0 |
| C | 0 | 50 | 0 |
| D | 0 | 50 | 0 |
| Mode M0 | |||
|---|---|---|---|
| Quadrant | BADHDUFLAG | Total packets | Discarded packets |
| A | 0 | 5272 | 1 |
| B | 0 | 5907 | 1 |
| C | 0 | 8071 | 1 |
| D | 0 | 5657 | 1 |
| Mode M9 | |||
|---|---|---|---|
| Quadrant | BADHDUFLAG | Total packets | Discarded packets |
| A | 0 | 12 | 0 |
| B | 0 | 12 | 0 |
| C | 0 | 12 | 0 |
| D | 0 | 12 | 0 |
| Quadrant | Total seconds | Saturated seconds | Saturation percentage |
|---|---|---|---|
| A | 2396 | 40 | 1.669449% |
| B | 2396 | 46 | 1.919866% |
| C | 2396 | 210 | 8.764608% |
| D | 2395 | 39 | 1.628392% |
Noise dominated data is calculated using 1-second bins in cleaned event files. If a bin has >2000 counts, and if more than 50% of those come from <1% of pixels, then it is considered to be noise-dominated and hence unusable.
| Quadrant | # 1 sec bins | Bins with >0 counts | Bins with >2000 counts | High rate bins dominated by noise | Noise dominated (total time) | Noise dominated (detector-on time) | Marked lightcurve |
|---|---|---|---|---|---|---|---|
| A | 3591 | 2396 | 0 | 0 | 0.00% | 0.00% | 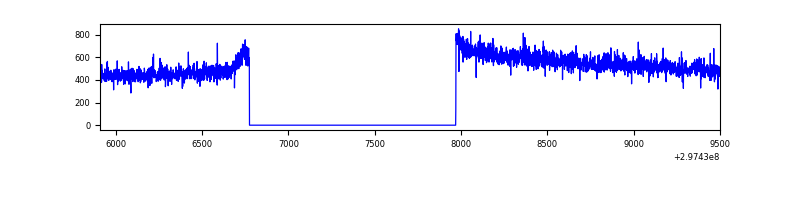 |
| B | 3591 | 2396 | 4 | 4 | 0.11% | 0.17% | 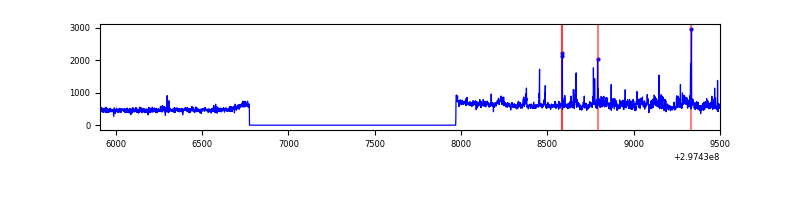 |
| C | 3591 | 2396 | 56 | 56 | 1.56% | 2.34% | 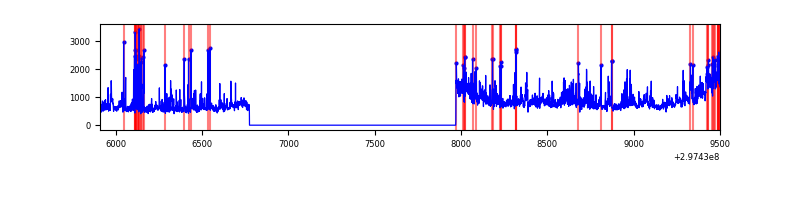 |
| D | 3590 | 2395 | 10 | 10 | 0.28% | 0.42% | 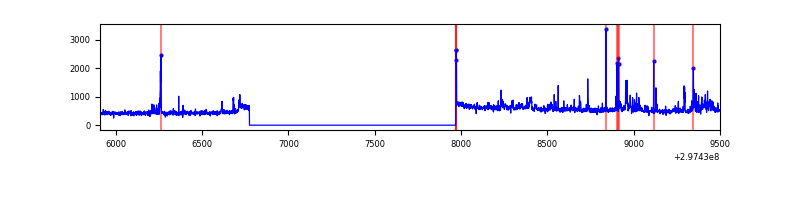 |
Top three noisy pixels from each quadrant. If the there are fewer than three noisy pixels in the level2.evt file, extra rows are filled as -1
| Pixel properties | Quadrant properties | ||||||
|---|---|---|---|---|---|---|---|
| Quadrant | DetID | PixID | Counts | Sigma | Mean | Median | Sigma |
| A | 0 | 226 | 3008 | 40.33 | 327 | 320 | 66.6 |
| A | 12 | 194 | 2418 | 31.48 | 327 | 320 | 66.6 |
| A | 3 | 137 | 2308 | 29.83 | 327 | 320 | 66.6 |
| B | 0 | 189 | 69408 | 1127.01 | 322 | 314 | 61.3 |
| B | 0 | 190 | 25389 | 409.0 | 322 | 314 | 61.3 |
| B | 0 | 197 | 15707 | 251.07 | 322 | 314 | 61.3 |
| C | 3 | 233 | 452808 | 6407.76 | 303 | 306 | 70.6 |
| C | 4 | 254 | 266325 | 3767.03 | 303 | 306 | 70.6 |
| C | 9 | 221 | 172742 | 2441.82 | 303 | 306 | 70.6 |
| D | 7 | 38 | 61341 | 790.71 | 317 | 308 | 77.2 |
| D | 1 | 52 | 27363 | 350.51 | 317 | 308 | 77.2 |
| D | 12 | 233 | 10921 | 137.5 | 317 | 308 | 77.2 |
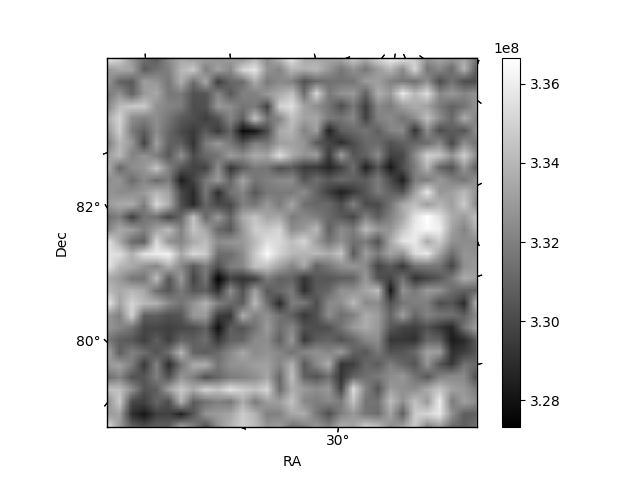
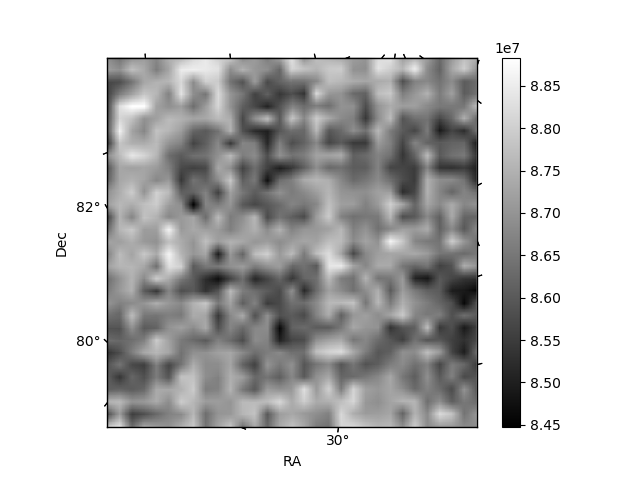
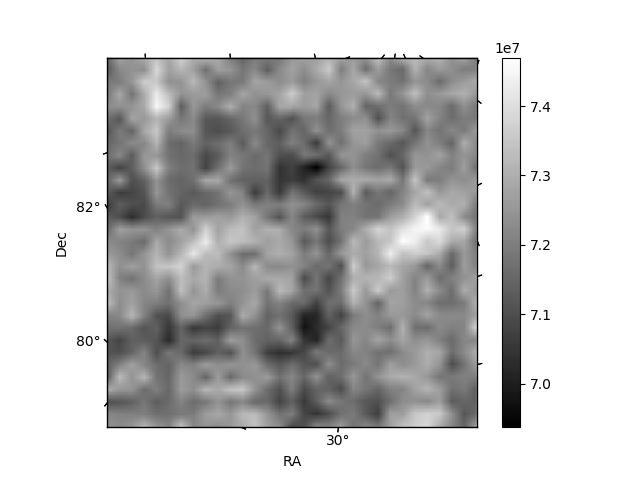
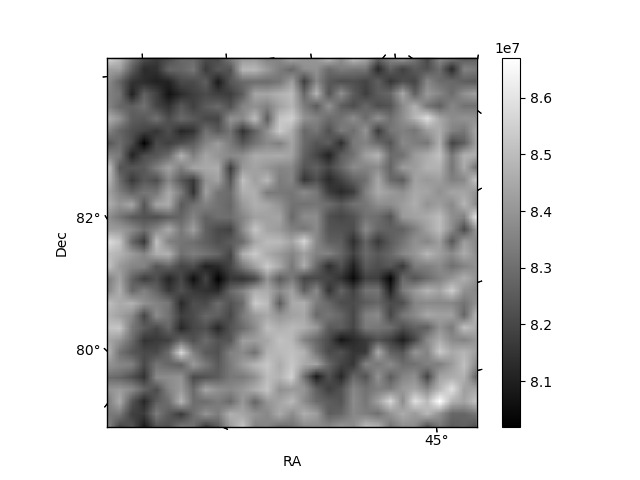
Histogram calculated using DETX and DETY for each event in the final _common_clean file
| Quadrant A | 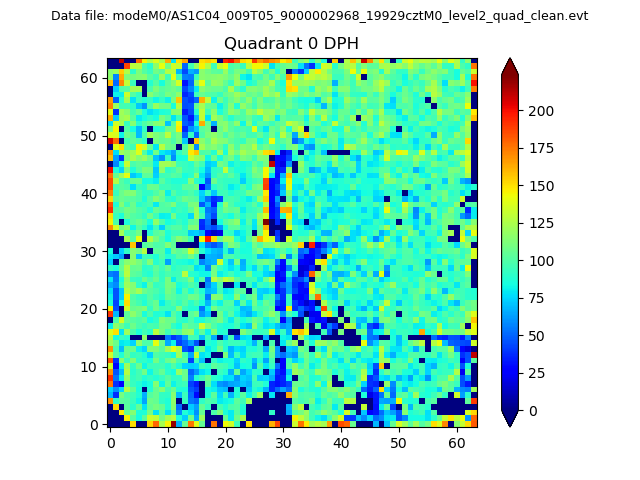 |
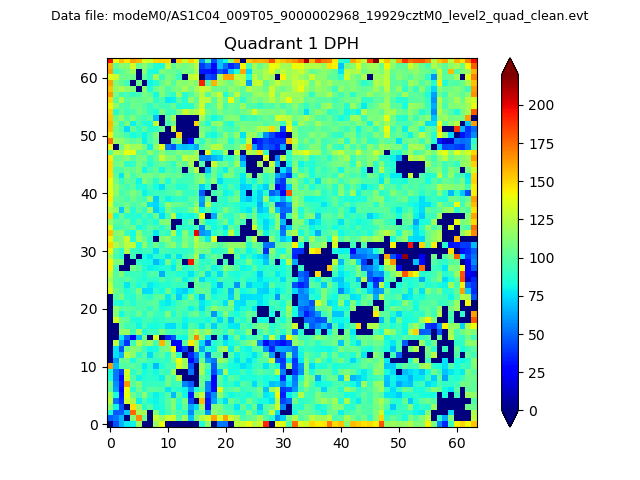 |
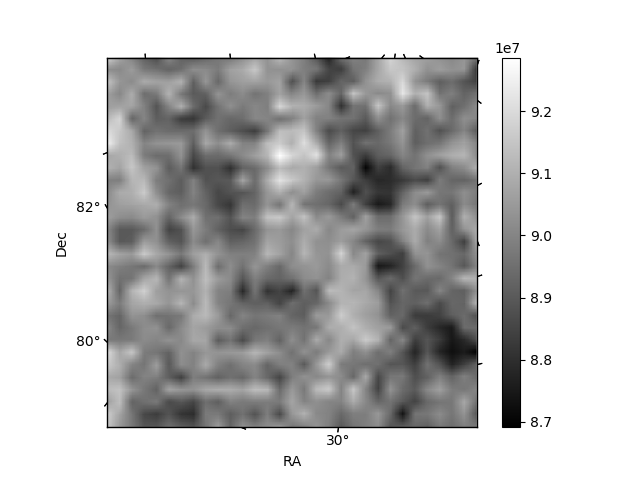
Quadrant B |
|---|---|---|---|
| Quadrant D | 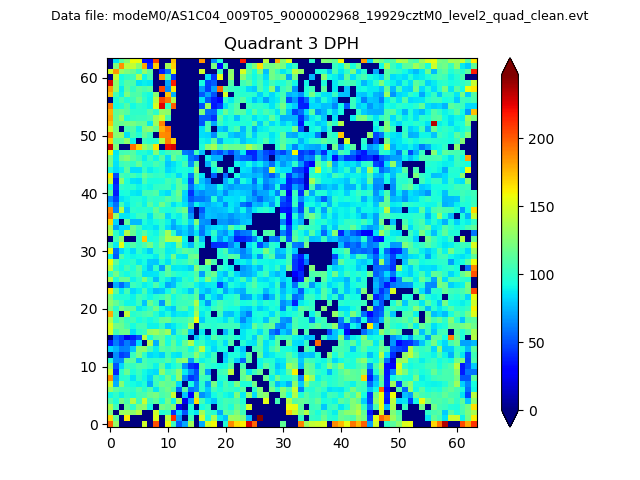 |
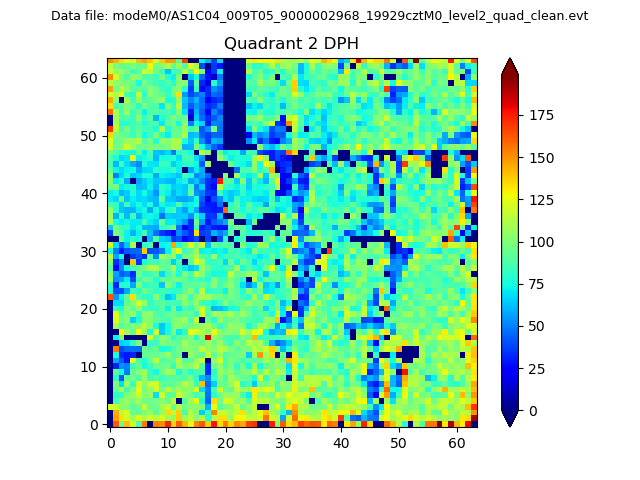 |
Quadrant C |
| Plot type | Count rate plots | Images |
|---|---|---|
| Comparison with Poisson distribution Blue bars denote a histogram of data divided into 1 sec bins. Red curve is a Poisson curve with rate = median count rate of data. |
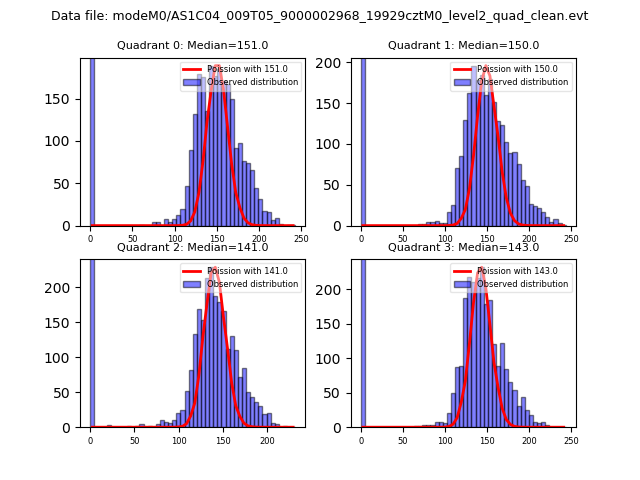 |
 |
| Quadrant-wise count rates Data is divided into 100 sec bins |
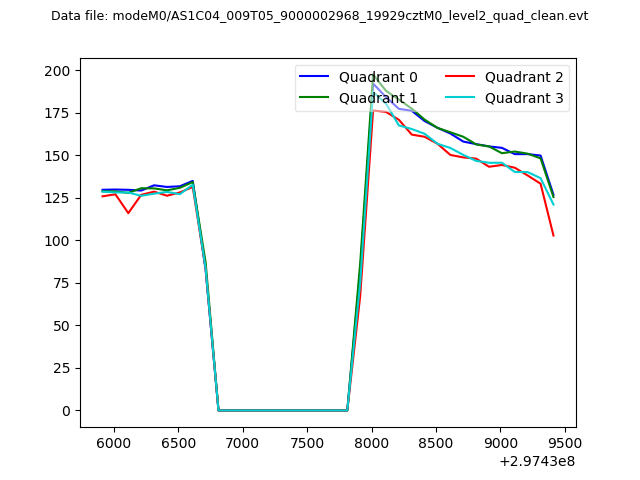 |
|
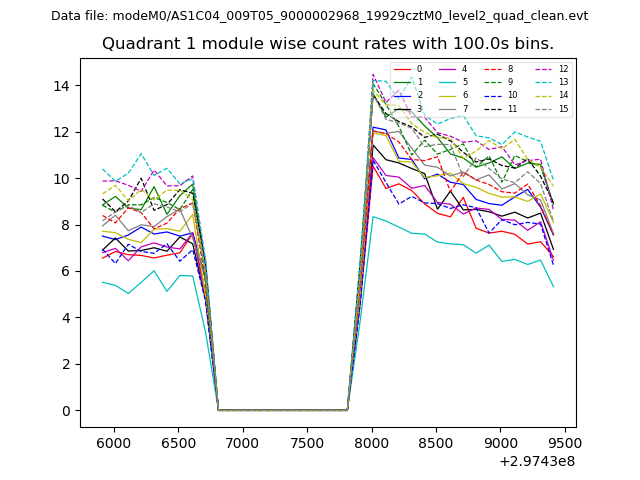
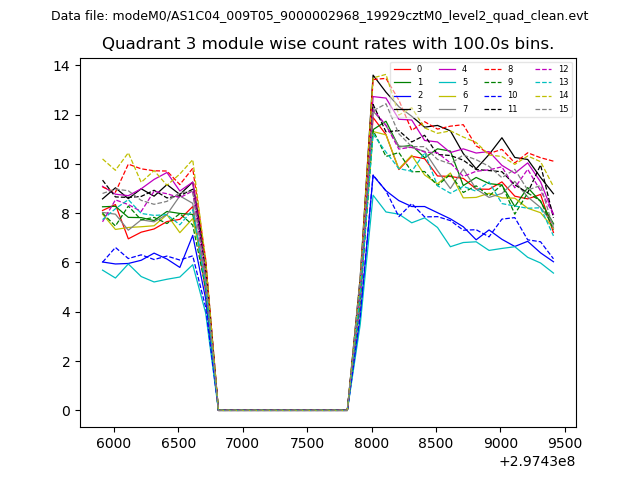
| Module-wise count rates for Quadrant A Data is divided into 100 sec bins |
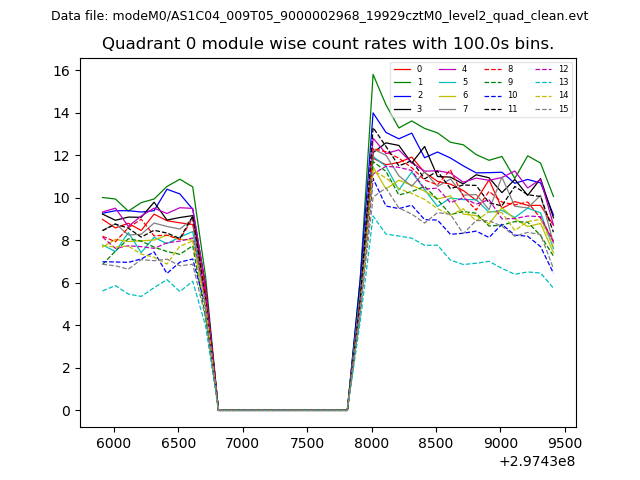 |
 |
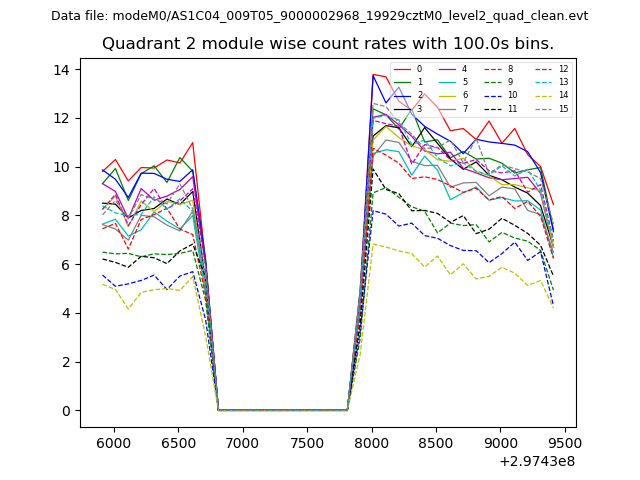
| Module-wise count rates for Quadrant B Data is divided into 100 sec bins |
 |
 |
| Module-wise count rates for Quadrant C Data is divided into 100 sec bins |
 |
 |
| Module-wise count rates for Quadrant D Data is divided into 100 sec bins |
 |
 |
| Parameter | Plot |
|---|---|
| CZT HV Monitor | 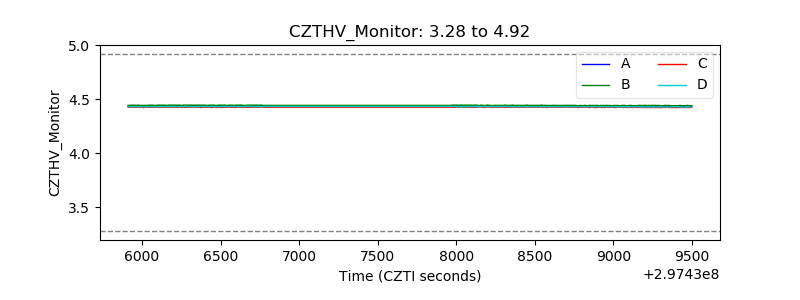 |
| D_VDD | 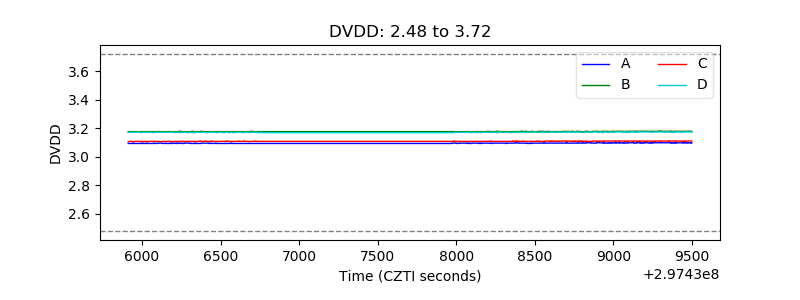 |
| Temperature 1 | 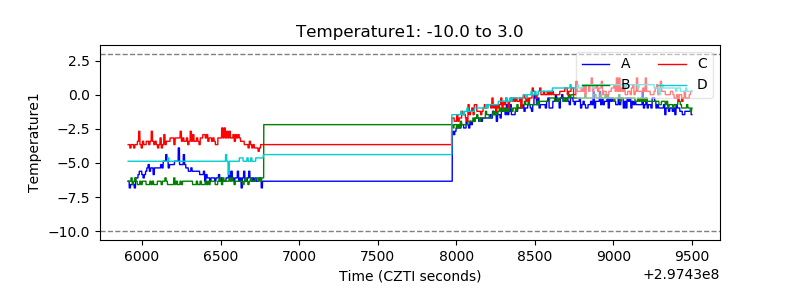 |
| Veto HV Monitor |  |
| Veto LLD | 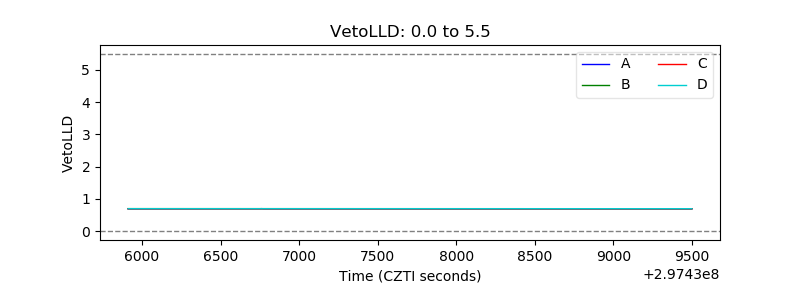 |
| Alpha Counter | 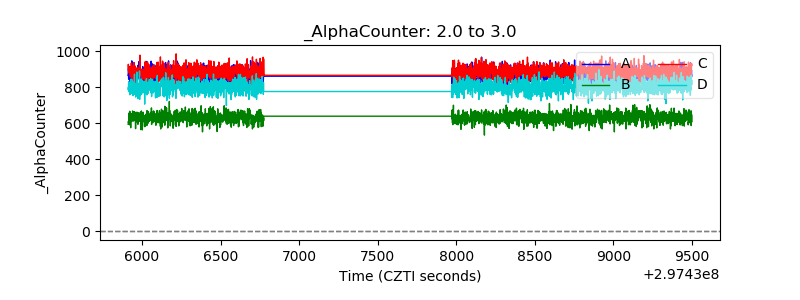 |
| _CPM_Rate | 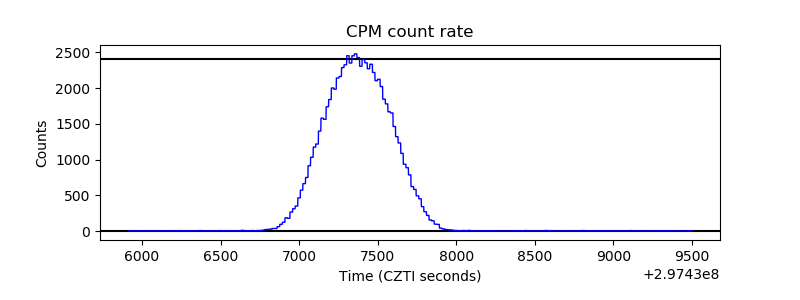 |
| CZT Counter | 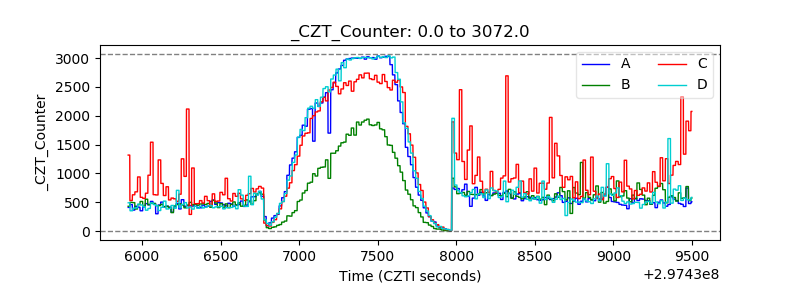 |
| +2.5 Volts monitor |  |
| +5 Volts monitor |  |
| _ROLL_ROT | 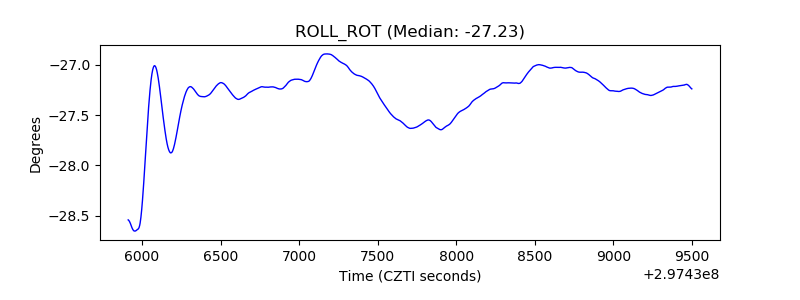 |
| _Roll_DEC | 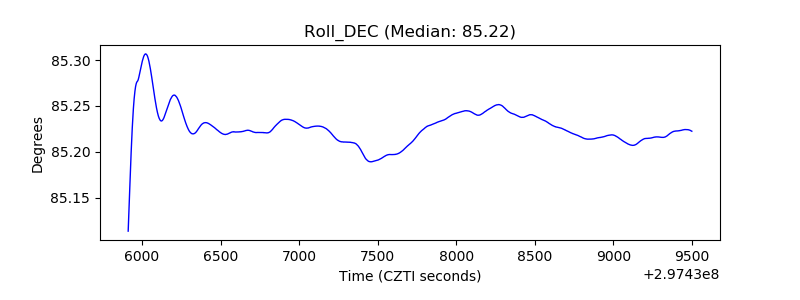 |
| _Roll_RA | 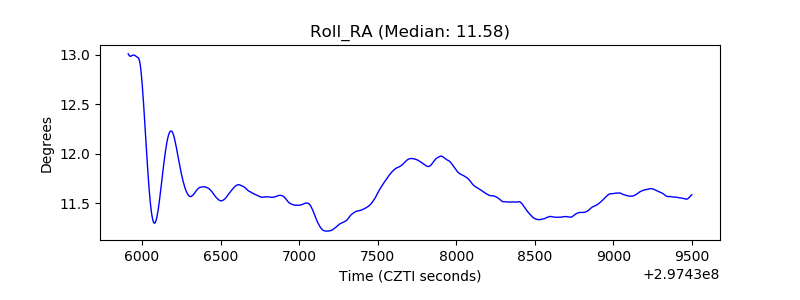 |
| Veto Counter |  |