| Param | Original file | Final file |
|---|---|---|
| Filename | modeM0/AS1C04_009T05_9000002968_19930cztM0_level2.evt | modeM0/AS1C04_009T05_9000002968_19930cztM0_level2_quad_clean.evt |
| Size (bytes) | 375,926,400 | 87,526,080 |
| Size | 358.5 MB | 83.5 MB |
| Events in quadrant A | 1,998,669 | 604,906 |
| Events in quadrant B | 2,333,932 | 597,499 |
| Events in quadrant C | 3,951,920 | 565,357 |
| Events in quadrant D | 2,806,155 | 578,172 |
| Mode SS | |||
|---|---|---|---|
| Quadrant | BADHDUFLAG | Total packets | Discarded packets |
| A | 0 | 88 | 0 |
| B | 0 | 88 | 0 |
| C | 0 | 88 | 0 |
| D | 0 | 88 | 0 |
| Mode M0 | |||
|---|---|---|---|
| Quadrant | BADHDUFLAG | Total packets | Discarded packets |
| A | 0 | 8766 | 0 |
| B | 0 | 9735 | 0 |
| C | 0 | 14841 | 0 |
| D | 0 | 11164 | 0 |
| Quadrant | Total seconds | Saturated seconds | Saturation percentage |
|---|---|---|---|
| A | 4323 | 15 | 0.346981% |
| B | 4323 | 35 | 0.809623% |
| C | 4324 | 353 | 8.163737% |
| D | 4324 | 95 | 2.197040% |
Noise dominated data is calculated using 1-second bins in cleaned event files. If a bin has >2000 counts, and if more than 50% of those come from <1% of pixels, then it is considered to be noise-dominated and hence unusable.
| Quadrant | # 1 sec bins | Bins with >0 counts | Bins with >2000 counts | High rate bins dominated by noise | Noise dominated (total time) | Noise dominated (detector-on time) | Marked lightcurve |
|---|---|---|---|---|---|---|---|
| A | 4323 | 4323 | 0 | 0 | 0.00% | 0.00% | 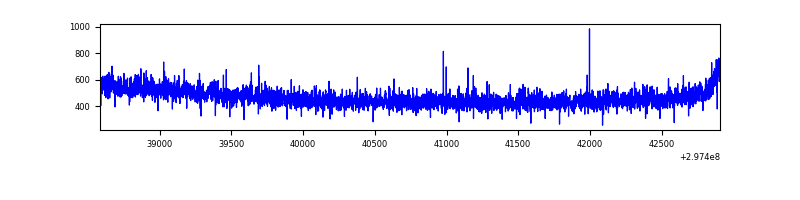 |
| B | 4323 | 4323 | 9 | 9 | 0.21% | 0.21% | 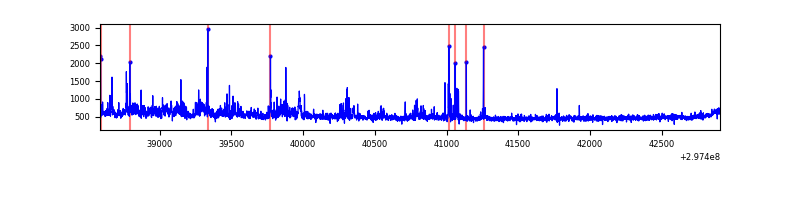 |
| C | 4324 | 4324 | 167 | 167 | 3.86% | 3.86% | 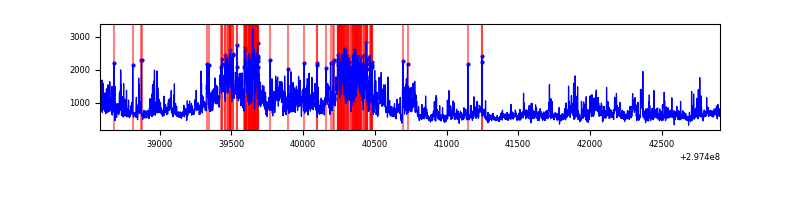 |
| D | 4324 | 4324 | 102 | 102 | 2.36% | 2.36% | 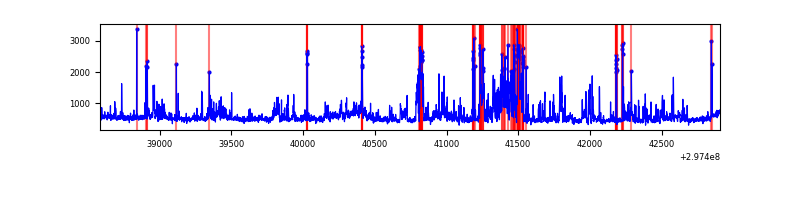 |
Top three noisy pixels from each quadrant. If the there are fewer than three noisy pixels in the level2.evt file, extra rows are filled as -1
| Pixel properties | Quadrant properties | ||||||
|---|---|---|---|---|---|---|---|
| Quadrant | DetID | PixID | Counts | Sigma | Mean | Median | Sigma |
| A | 0 | 226 | 4663 | 39.85 | 518 | 508 | 104.3 |
| A | 8 | 205 | 4484 | 38.14 | 518 | 508 | 104.3 |
| A | 12 | 194 | 3934 | 32.86 | 518 | 508 | 104.3 |
| B | 0 | 189 | 104848 | 1105.13 | 515 | 505 | 94.4 |
| B | 0 | 197 | 47659 | 499.42 | 515 | 505 | 94.4 |
| B | 3 | 112 | 31982 | 333.38 | 515 | 505 | 94.4 |
| C | 3 | 233 | 1228288 | 10756.53 | 492 | 495 | 114.1 |
| C | 9 | 221 | 527197 | 4614.36 | 492 | 495 | 114.1 |
| C | 4 | 254 | 184646 | 1613.32 | 492 | 495 | 114.1 |
| D | 1 | 52 | 332314 | 2729.28 | 508 | 494 | 121.6 |
| D | 7 | 38 | 198961 | 1632.42 | 508 | 494 | 121.6 |
| D | 15 | 0 | 170431 | 1397.76 | 508 | 494 | 121.6 |
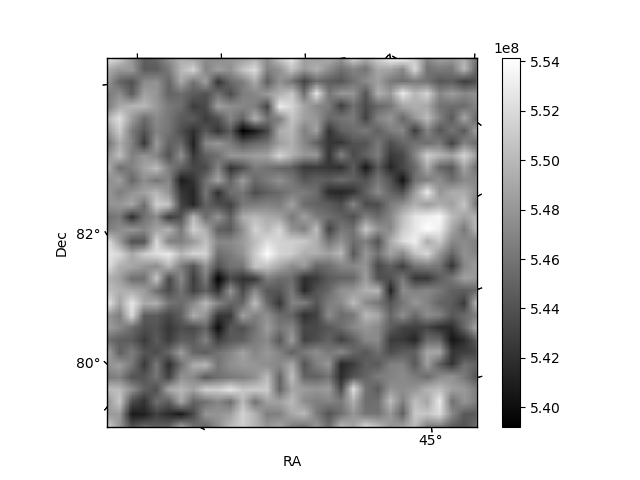
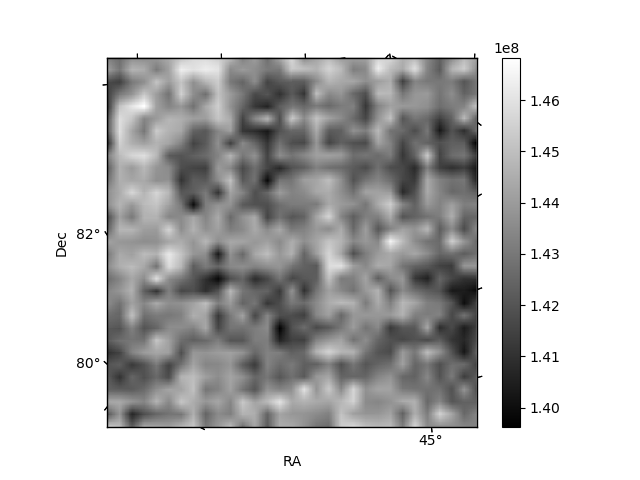
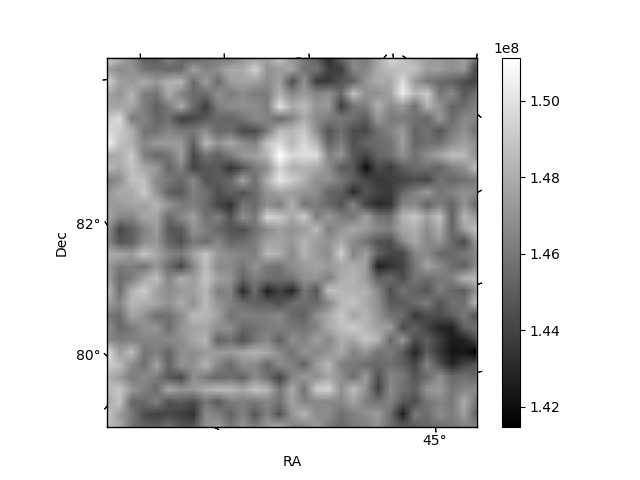
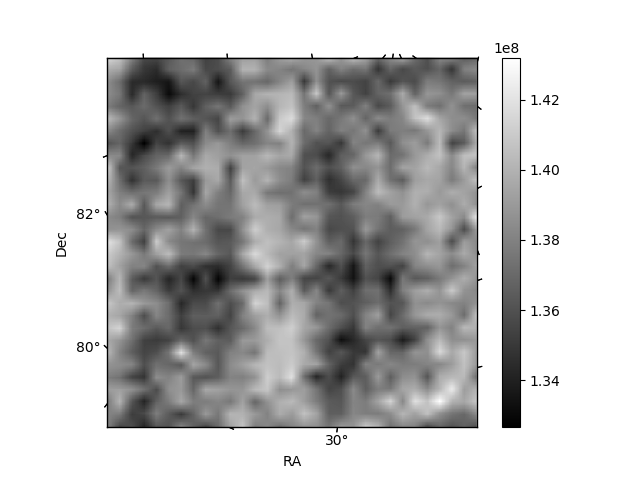
Histogram calculated using DETX and DETY for each event in the final _common_clean file
| Quadrant A | 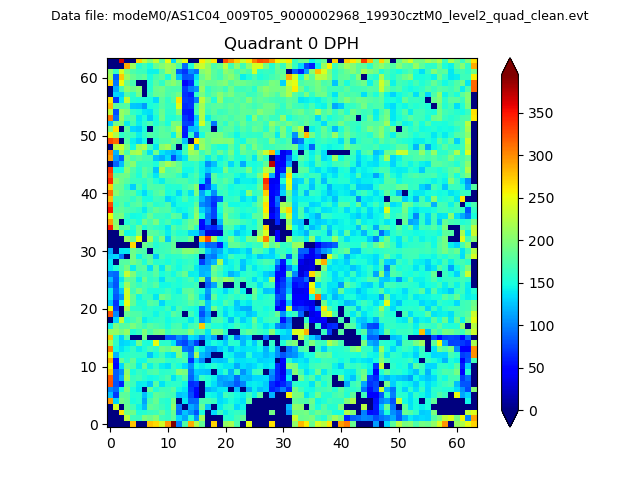 |
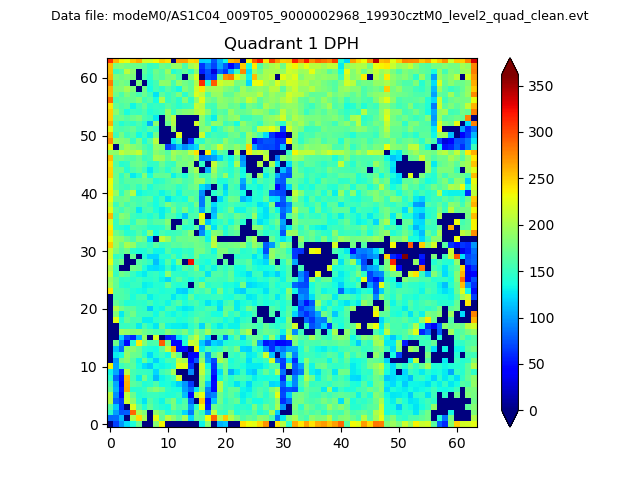 |
Quadrant B |
|---|---|---|---|
| Quadrant D | 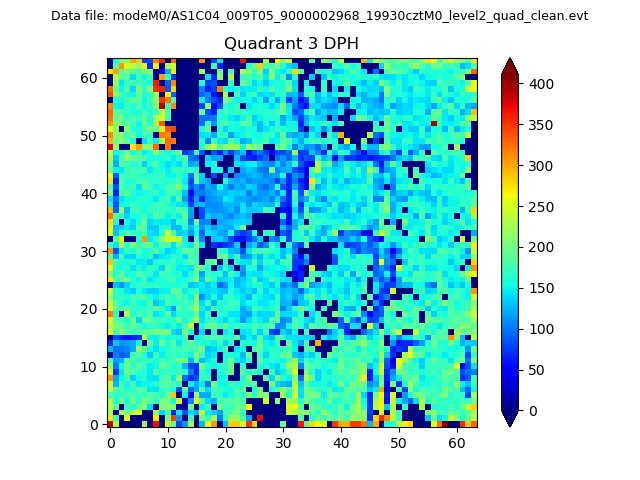 |
 |
Quadrant C |
| Plot type | Count rate plots | Images |
|---|---|---|
| Comparison with Poisson distribution Blue bars denote a histogram of data divided into 1 sec bins. Red curve is a Poisson curve with rate = median count rate of data. |
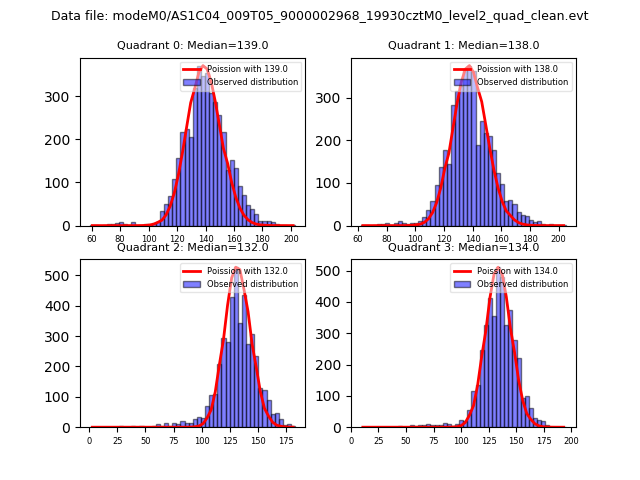 |
 |
| Quadrant-wise count rates Data is divided into 100 sec bins |
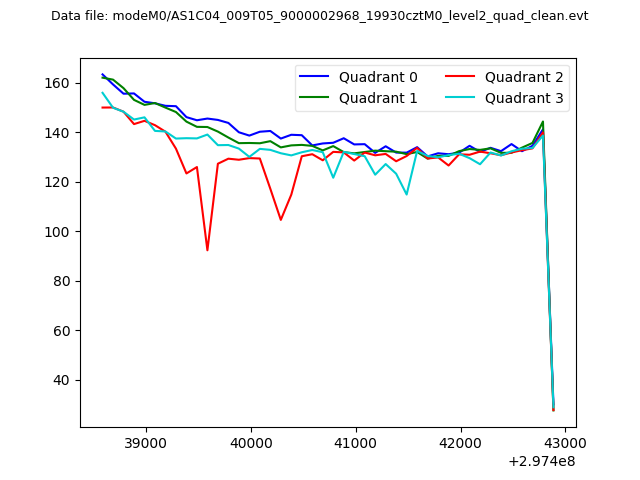 |
|
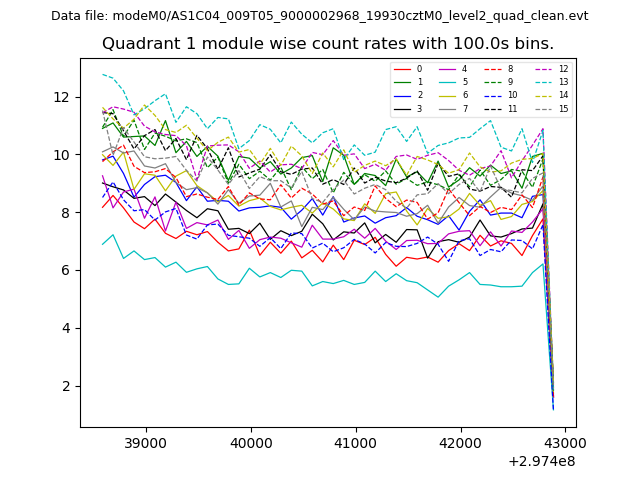
| Module-wise count rates for Quadrant A Data is divided into 100 sec bins |
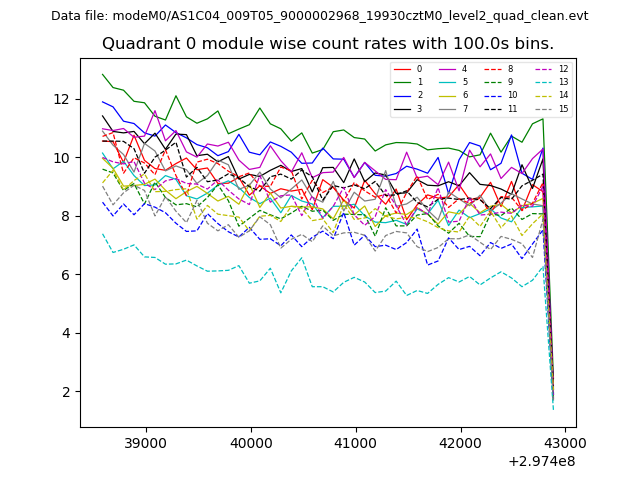 |
 |
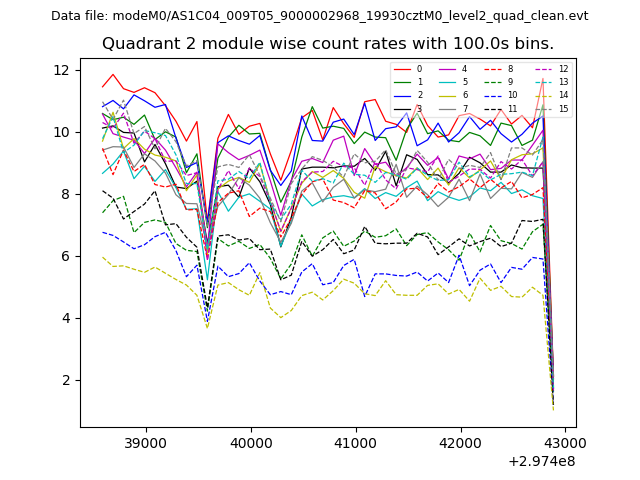
| Module-wise count rates for Quadrant B Data is divided into 100 sec bins |
 |
 |
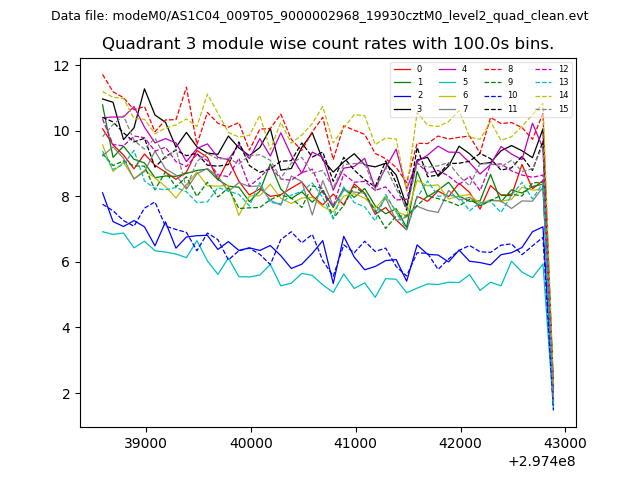
| Module-wise count rates for Quadrant C Data is divided into 100 sec bins |
 |
 |
| Module-wise count rates for Quadrant D Data is divided into 100 sec bins |
 |
 |
| Parameter | Plot |
|---|---|
| CZT HV Monitor | 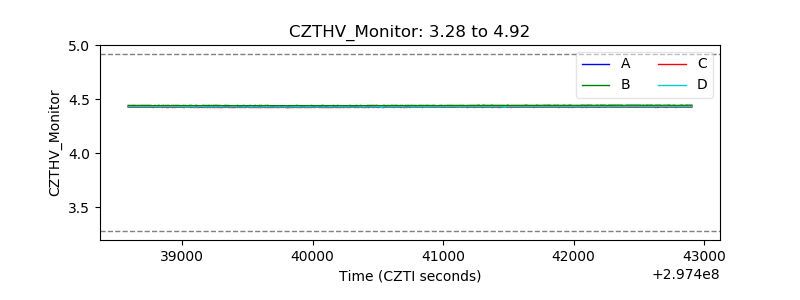 |
| D_VDD | 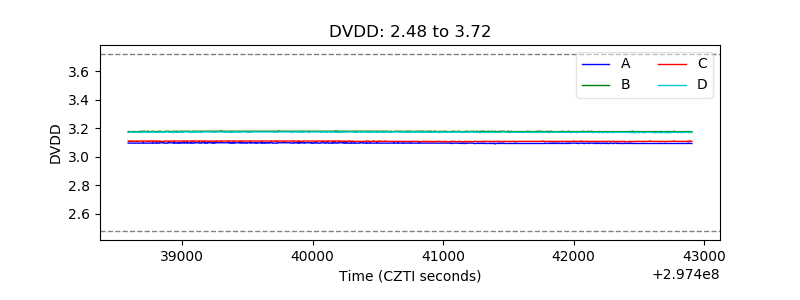 |
| Temperature 1 | 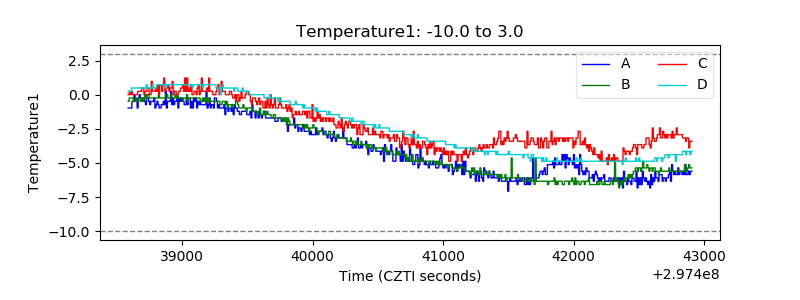 |
| Veto HV Monitor | 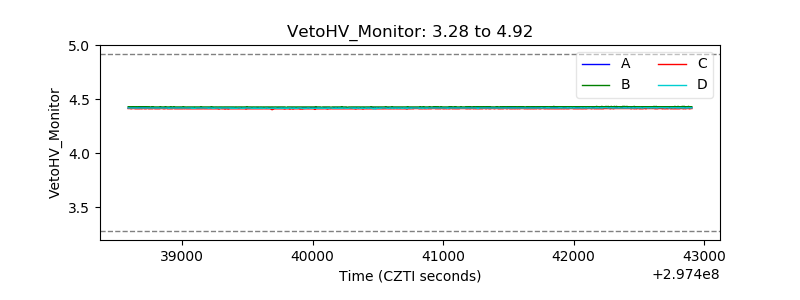 |
| Veto LLD | 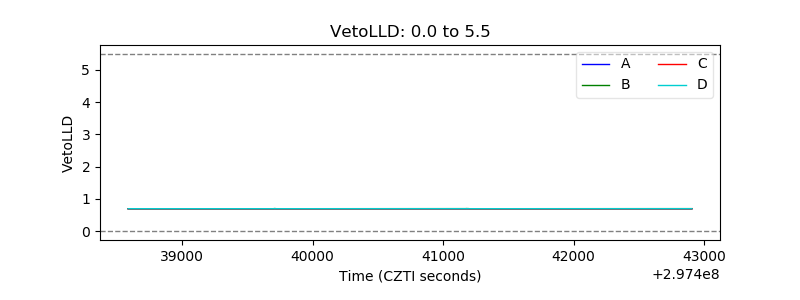 |
| Alpha Counter | 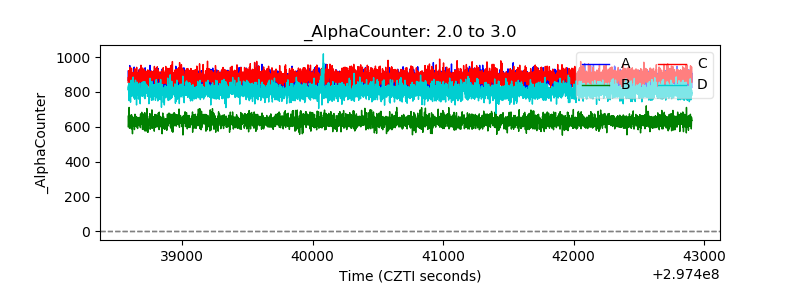 |
| _CPM_Rate | 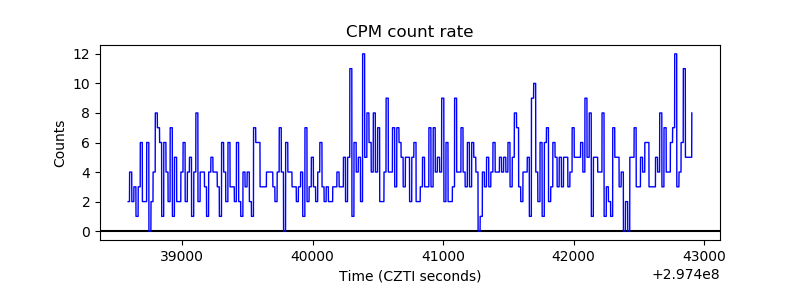 |
| CZT Counter | 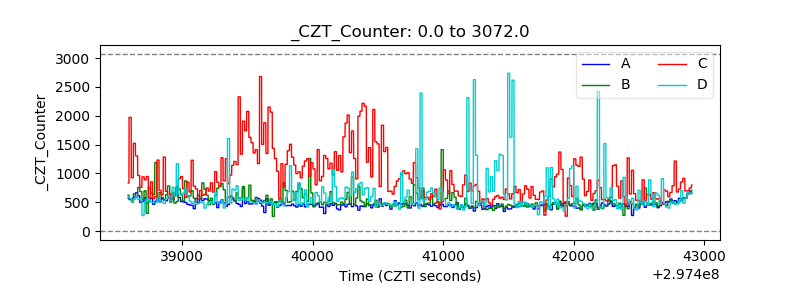 |
| +2.5 Volts monitor |  |
| +5 Volts monitor |  |
| _ROLL_ROT | 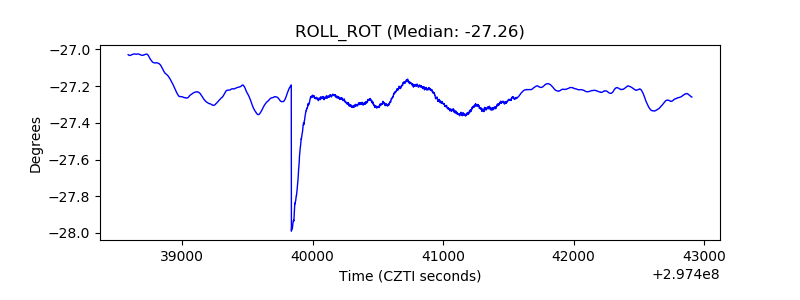 |
| _Roll_DEC | 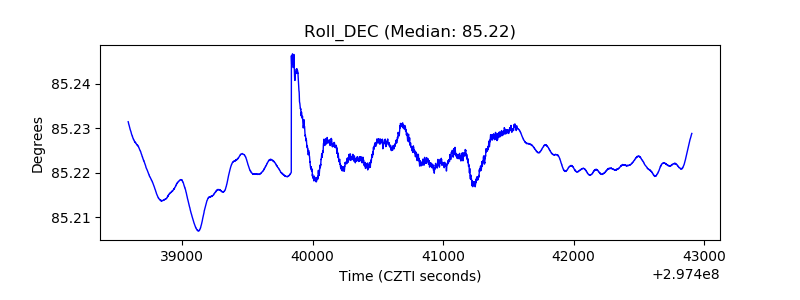 |
| _Roll_RA | 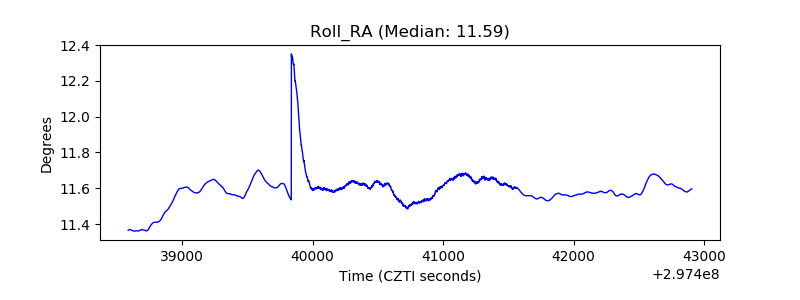 |
| Veto Counter | 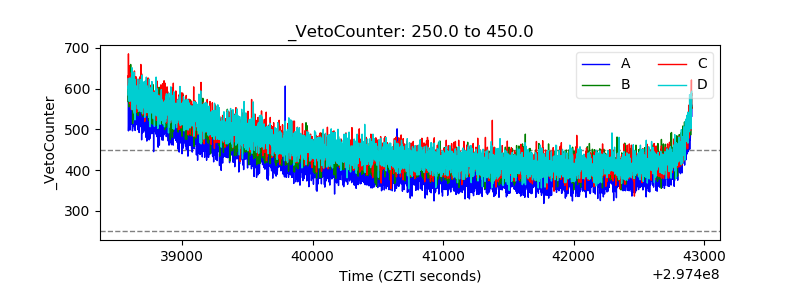 |