| Param | Original file | Final file |
|---|---|---|
| Filename | modeM0/AS1A05_103T05_9000002974cztM0_level2.fits | modeM0/AS1A05_103T05_9000002974cztM0_level2_quad_clean.evt |
| Size (bytes) | 282,758,400 | 315,175,680 |
| Size | 269.7 MB | 300.6 MB |
| Events in quadrant A | 1,419,310 | 1,474,043 |
| Events in quadrant B | 1,724,922 | 2,125,753 |
| Events in quadrant C | 1,745,384 | 1,998,731 |
| Events in quadrant D | 1,510,488 | 1,787,550 |
| Mode SS | |||
|---|---|---|---|
| Quadrant | BADHDUFLAG | Total packets | Discarded packets |
| A | 0 | 638 | 0 |
| B | 0 | 638 | 0 |
| C | 0 | 638 | 0 |
| D | 0 | 638 | 0 |
| Mode M0 | |||
|---|---|---|---|
| Quadrant | BADHDUFLAG | Total packets | Discarded packets |
| A | 0 | 122827 | 0 |
| B | 0 | 66923 | 0 |
| C | 0 | 70897 | 0 |
| D | 0 | 72180 | 0 |
| Mode M9 | |||
|---|---|---|---|
| Quadrant | BADHDUFLAG | Total packets | Discarded packets |
| A | 0 | 31 | 0 |
| B | 0 | 31 | 0 |
| C | 0 | 31 | 0 |
| D | 0 | 31 | 0 |
| Quadrant | Total seconds | Saturated seconds | Saturation percentage |
|---|---|---|---|
| A | 31410 | 9401 | 29.929959% |
| B | 31410 | 349 | 1.111111% |
| C | 31410 | 519 | 1.652340% |
| D | 31410 | 1039 | 3.307864% |
Noise dominated data is calculated using 1-second bins in cleaned event files. If a bin has >2000 counts, and if more than 50% of those come from <1% of pixels, then it is considered to be noise-dominated and hence unusable.
| Quadrant | # 1 sec bins | Bins with >0 counts | Bins with >2000 counts | High rate bins dominated by noise | Noise dominated (total time) | Noise dominated (detector-on time) | Marked lightcurve |
|---|---|---|---|---|---|---|---|
| A | 34446 | 29681 | 0 | 0 | 0.00% | 0.00% |  |
| B | 34450 | 31404 | 0 | 0 | 0.00% | 0.00% |  |
| C | 34450 | 31406 | 0 | 0 | 0.00% | 0.00% |  |
| D | 34450 | 31353 | 0 | 0 | 0.00% | 0.00% |  |
Top three noisy pixels from each quadrant. If the there are fewer than three noisy pixels in the level2.evt file, extra rows are filled as -1
| Pixel properties | Quadrant properties | ||||||
|---|---|---|---|---|---|---|---|
| Quadrant | DetID | PixID | Counts | Sigma | Mean | Median | Sigma |
| A | 14 | 188 | 1528 | 12.87 | 368 | 345 | 91.9 |
| A | 0 | 29 | 1375 | 11.2 | 368 | 345 | 91.9 |
| A | 14 | 204 | 1298 | 10.37 | 368 | 345 | 91.9 |
| B | 2 | 9 | 1395 | 10.57 | 455 | 434 | 90.9 |
| B | 2 | 8 | 1165 | 8.04 | 455 | 434 | 90.9 |
| B | 3 | 17 | 1146 | 7.83 | 455 | 434 | 90.9 |
| C | 12 | 241 | 1301 | 7.26 | 460 | 429 | 120.1 |
| C | 7 | 111 | 1207 | 6.48 | 460 | 429 | 120.1 |
| C | 12 | 250 | 1192 | 6.36 | 460 | 429 | 120.1 |
| D | 3 | 14 | 1180 | 6.7 | 431 | 392 | 117.6 |
| D | 6 | 231 | 1119 | 6.18 | 431 | 392 | 117.6 |
| D | 7 | 3 | 1085 | 5.89 | 431 | 392 | 117.6 |
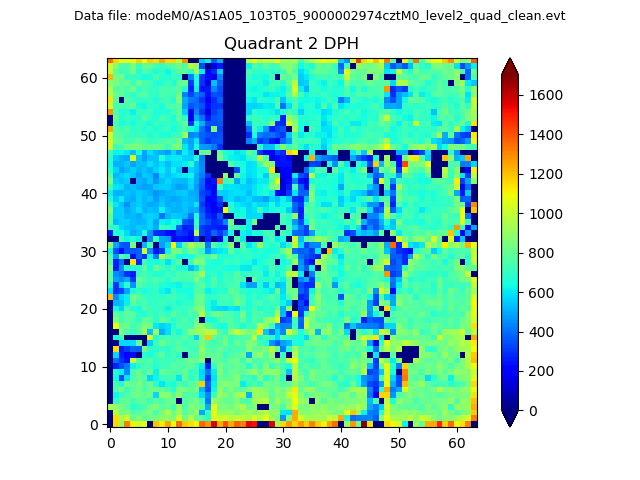
Histogram calculated using DETX and DETY for each event in the final _common_clean file
| Quadrant A | 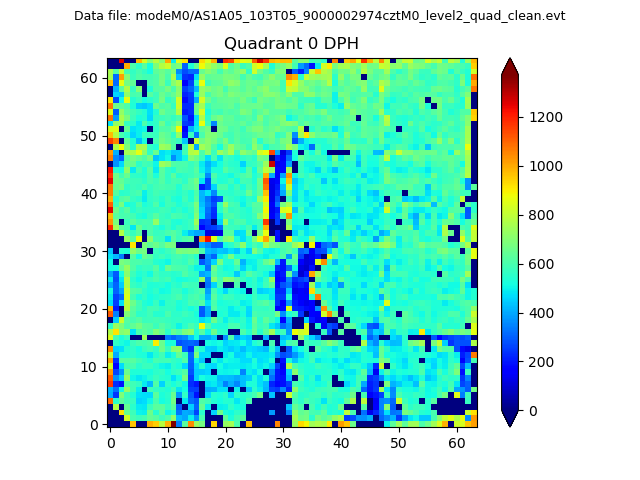 |
 |
Quadrant B |
|---|---|---|---|
| Quadrant D |  |
 |
Quadrant C |
| Plot type | Count rate plots | Images |
|---|---|---|
| Comparison with Poisson distribution Blue bars denote a histogram of data divided into 1 sec bins. Red curve is a Poisson curve with rate = median count rate of data. |
 |
 |
| Quadrant-wise count rates Data is divided into 100 sec bins |
 |
|
| Module-wise count rates for Quadrant A Data is divided into 100 sec bins |
 |
 |
| Module-wise count rates for Quadrant B Data is divided into 100 sec bins |
 |
 |
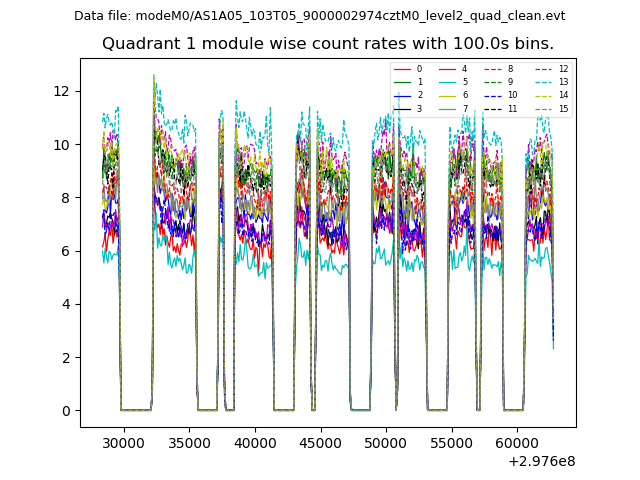
| Module-wise count rates for Quadrant C Data is divided into 100 sec bins |
 |
 |
| Module-wise count rates for Quadrant D Data is divided into 100 sec bins |
 |
 |
| Parameter | Plot |
|---|---|
| CZT HV Monitor |  |
| D_VDD | 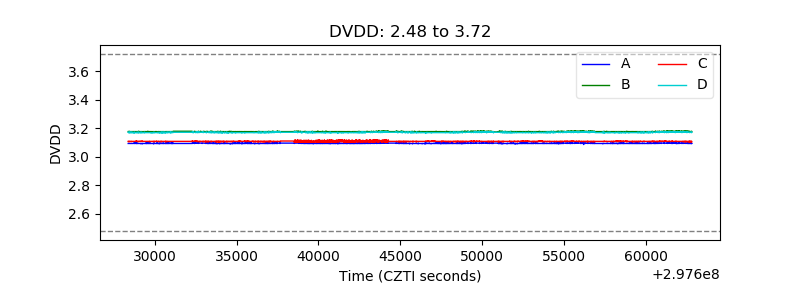 |
| Temperature 1 |  |
| Veto HV Monitor |  |
| Veto LLD |  |
| Alpha Counter | 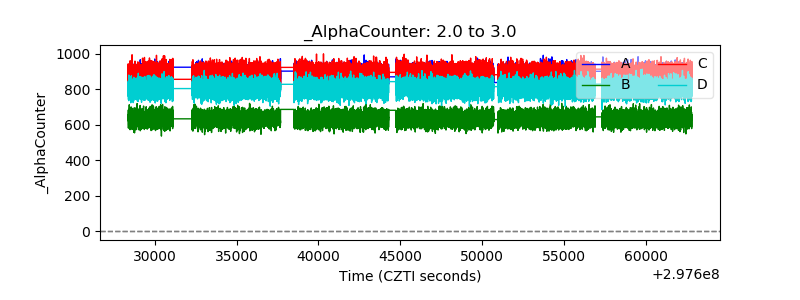 |
| _CPM_Rate |  |
| CZT Counter |  |
| +2.5 Volts monitor |  |
| +5 Volts monitor |  |
| _ROLL_ROT |  |
| _Roll_DEC | 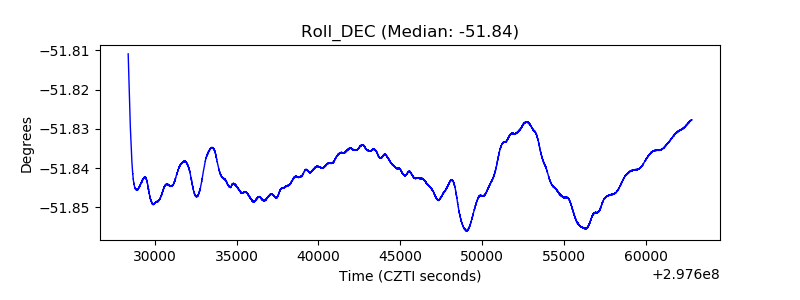 |
| _Roll_RA | 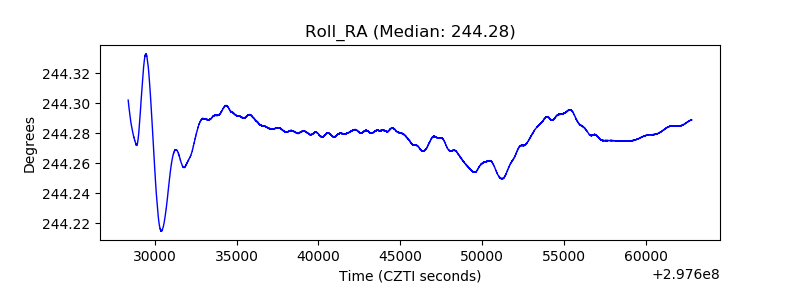 |
| Veto Counter | 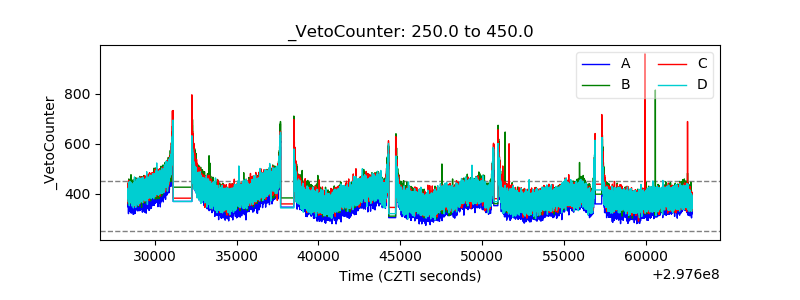 |