| Param | Original file | Final file |
|---|---|---|
| Filename | modeM0/AS1A05_103T05_9000002974_19962cztM0_level2.evt | modeM0/AS1A05_103T05_9000002974_19962cztM0_level2_quad_clean.evt |
| Size (bytes) | 292,466,880 | 55,704,960 |
| Size | 278.9 MB | 53.1 MB |
| Events in quadrant A | 1,925,673 | 360,415 |
| Events in quadrant B | 2,028,661 | 364,885 |
| Events in quadrant C | 2,729,771 | 338,840 |
| Events in quadrant D | 1,898,123 | 338,204 |
| Mode SS | |||
|---|---|---|---|
| Quadrant | BADHDUFLAG | Total packets | Discarded packets |
| A | 0 | 84 | 0 |
| B | 0 | 84 | 0 |
| C | 0 | 84 | 0 |
| D | 0 | 84 | 0 |
| Mode M0 | |||
|---|---|---|---|
| Quadrant | BADHDUFLAG | Total packets | Discarded packets |
| A | 0 | 8366 | 1 |
| B | 0 | 8581 | 1 |
| C | 0 | 10944 | 1 |
| D | 0 | 8453 | 1 |
| Mode M9 | |||
|---|---|---|---|
| Quadrant | BADHDUFLAG | Total packets | Discarded packets |
| A | 0 | 11 | 0 |
| B | 0 | 11 | 0 |
| C | 0 | 11 | 0 |
| D | 0 | 11 | 0 |
| Quadrant | Total seconds | Saturated seconds | Saturation percentage |
|---|---|---|---|
| A | 4026 | 21 | 0.521610% |
| B | 4026 | 50 | 1.241927% |
| C | 4026 | 88 | 2.185792% |
| D | 4026 | 19 | 0.471932% |
Noise dominated data is calculated using 1-second bins in cleaned event files. If a bin has >2000 counts, and if more than 50% of those come from <1% of pixels, then it is considered to be noise-dominated and hence unusable.
| Quadrant | # 1 sec bins | Bins with >0 counts | Bins with >2000 counts | High rate bins dominated by noise | Noise dominated (total time) | Noise dominated (detector-on time) | Marked lightcurve |
|---|---|---|---|---|---|---|---|
| A | 5166 | 4027 | 0 | 0 | 0.00% | 0.00% | 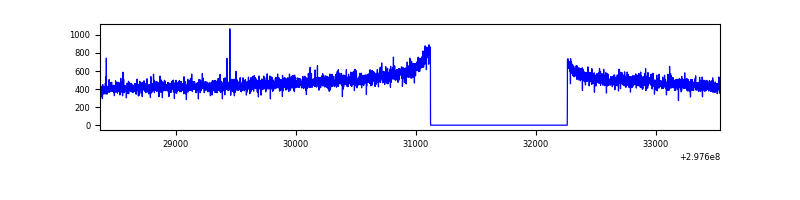 |
| B | 5166 | 4027 | 8 | 8 | 0.15% | 0.20% | 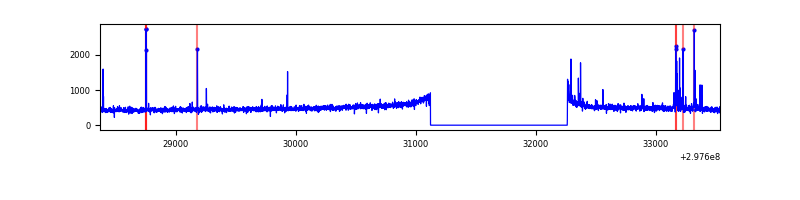 |
| C | 5166 | 4026 | 1 | 1 | 0.02% | 0.02% | 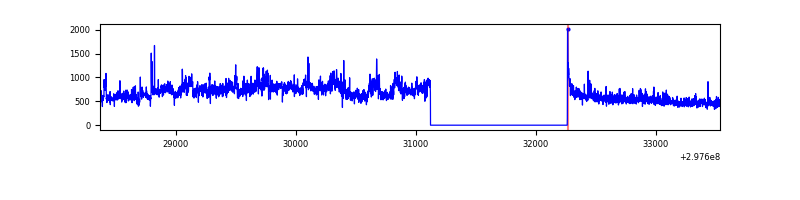 |
| D | 5166 | 4027 | 8 | 8 | 0.15% | 0.20% | 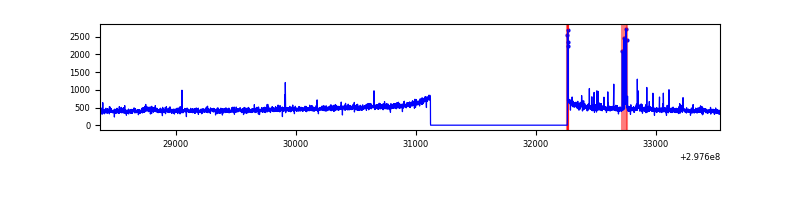 |
Top three noisy pixels from each quadrant. If the there are fewer than three noisy pixels in the level2.evt file, extra rows are filled as -1
| Pixel properties | Quadrant properties | ||||||
|---|---|---|---|---|---|---|---|
| Quadrant | DetID | PixID | Counts | Sigma | Mean | Median | Sigma |
| A | 0 | 226 | 4246 | 37.12 | 499 | 490 | 101.2 |
| A | 3 | 137 | 4064 | 35.32 | 499 | 490 | 101.2 |
| A | 13 | 254 | 3864 | 33.35 | 499 | 490 | 101.2 |
| B | 0 | 197 | 41655 | 434.78 | 498 | 487 | 94.7 |
| B | 12 | 111 | 11226 | 113.42 | 498 | 487 | 94.7 |
| B | 11 | 111 | 9875 | 99.15 | 498 | 487 | 94.7 |
| C | 3 | 233 | 372106 | 3357.21 | 477 | 479 | 110.7 |
| C | 10 | 222 | 362682 | 3272.08 | 477 | 479 | 110.7 |
| C | 14 | 238 | 75447 | 677.25 | 477 | 479 | 110.7 |
| D | 7 | 96 | 25912 | 218.84 | 482 | 469 | 116.3 |
| D | 2 | 234 | 19554 | 164.15 | 482 | 469 | 116.3 |
| D | 7 | 238 | 15093 | 125.78 | 482 | 469 | 116.3 |
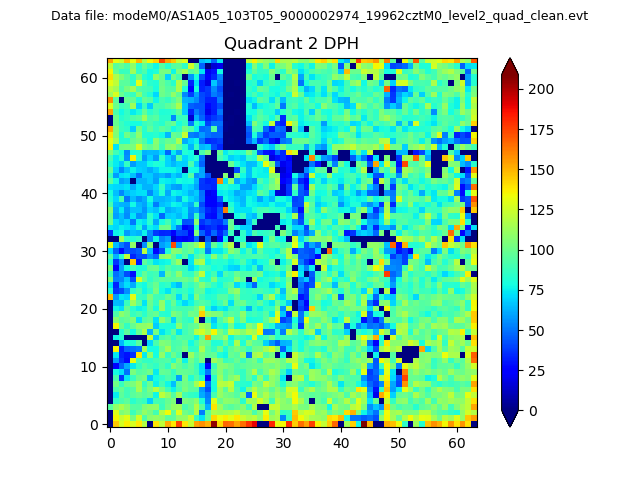
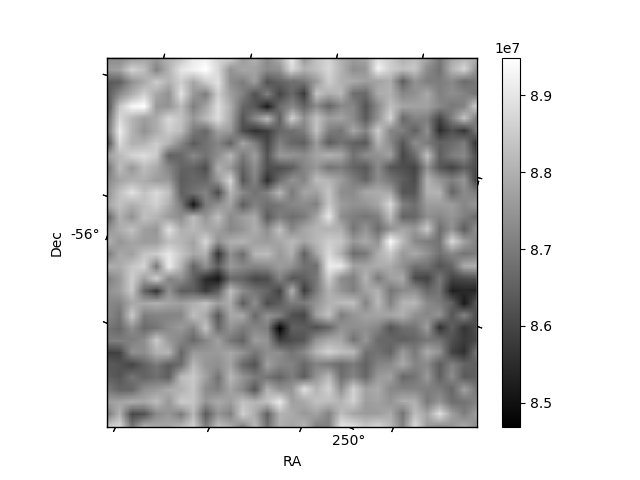
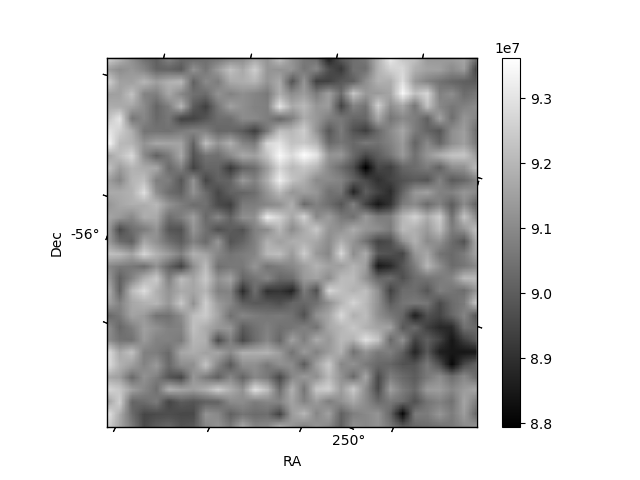
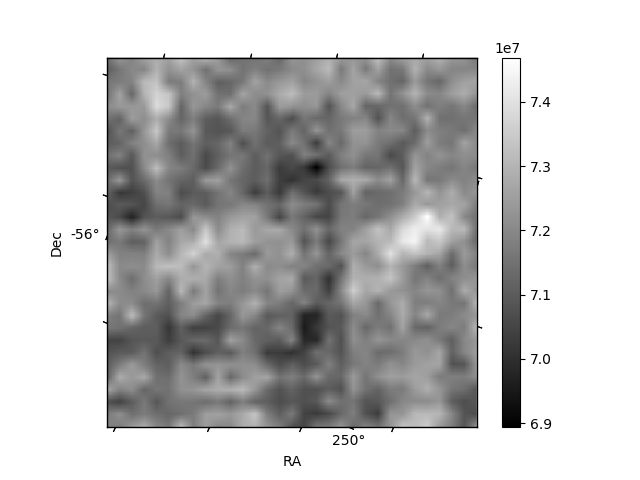
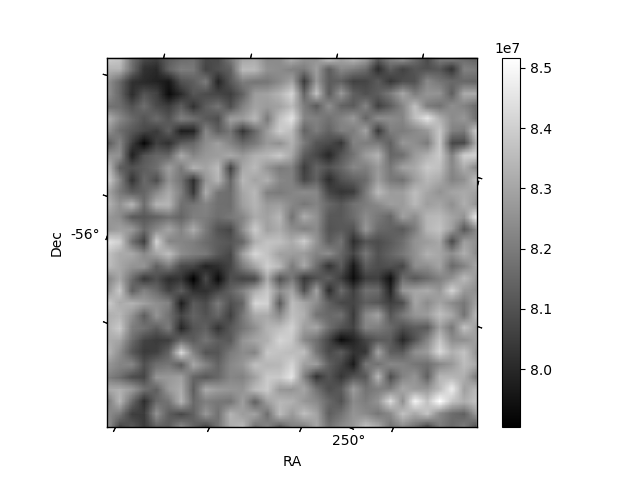
Histogram calculated using DETX and DETY for each event in the final _common_clean file
| Quadrant A | 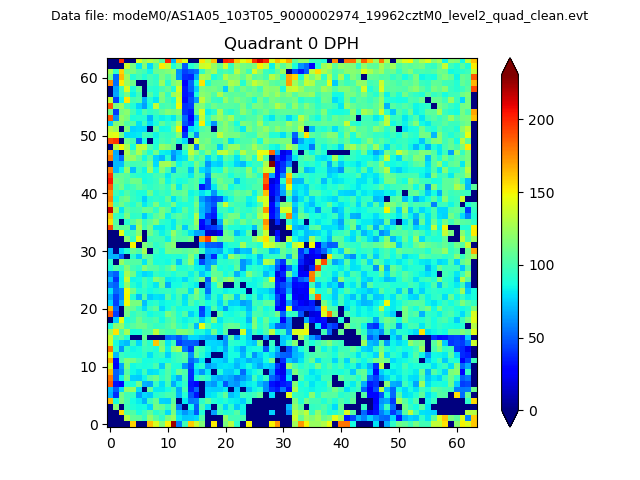 |
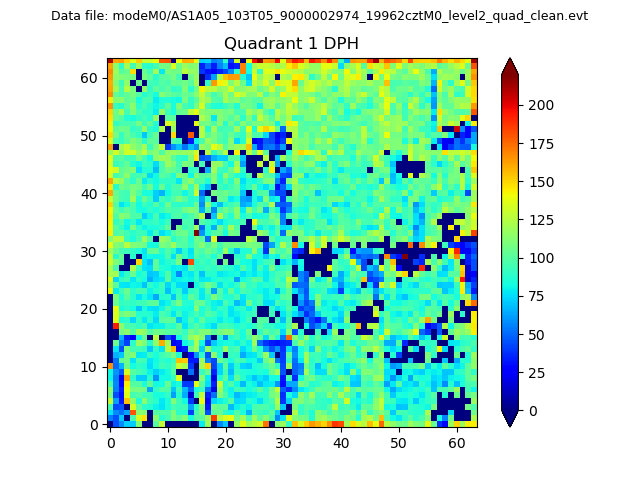 |
Quadrant B |
|---|---|---|---|
| Quadrant D | 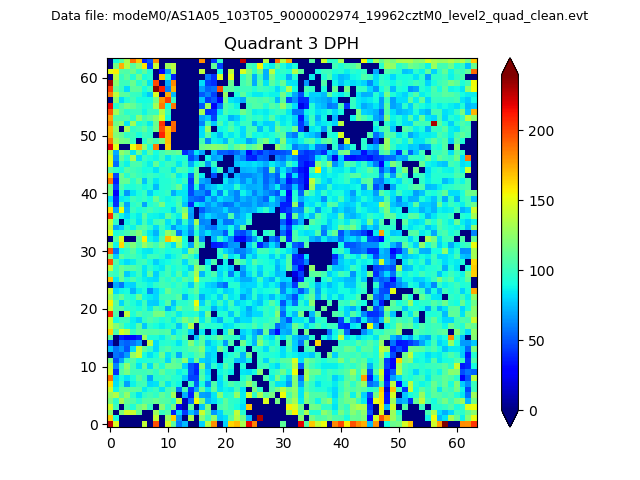 |
 |
Quadrant C |
| Plot type | Count rate plots | Images |
|---|---|---|
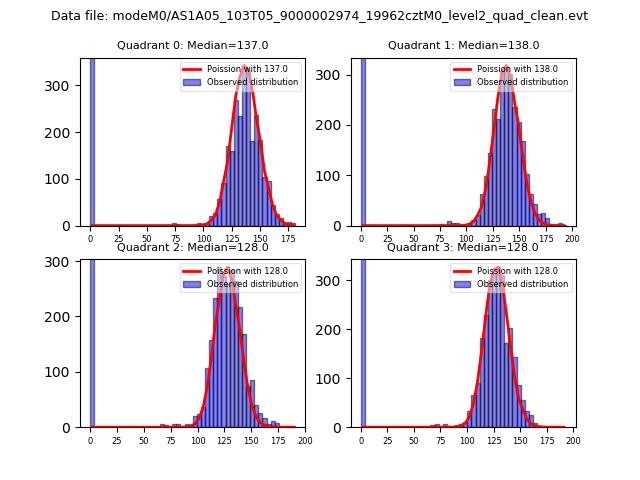
| Comparison with Poisson distribution Blue bars denote a histogram of data divided into 1 sec bins. Red curve is a Poisson curve with rate = median count rate of data. |
 |
 |
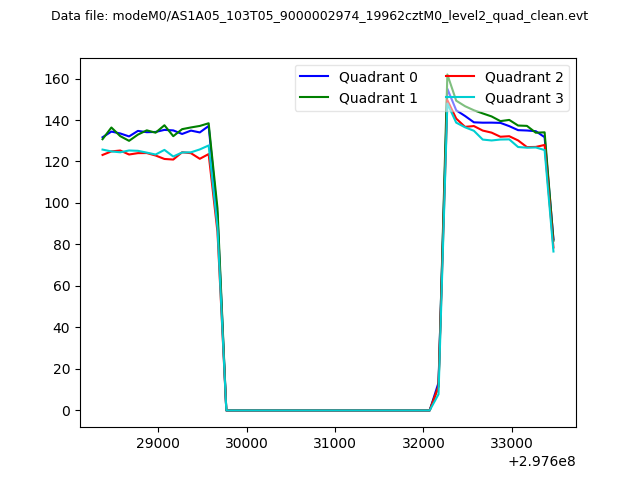
| Quadrant-wise count rates Data is divided into 100 sec bins |
 |
|
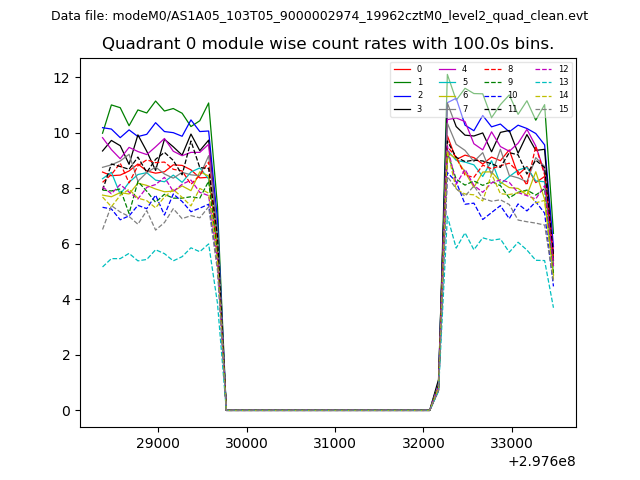
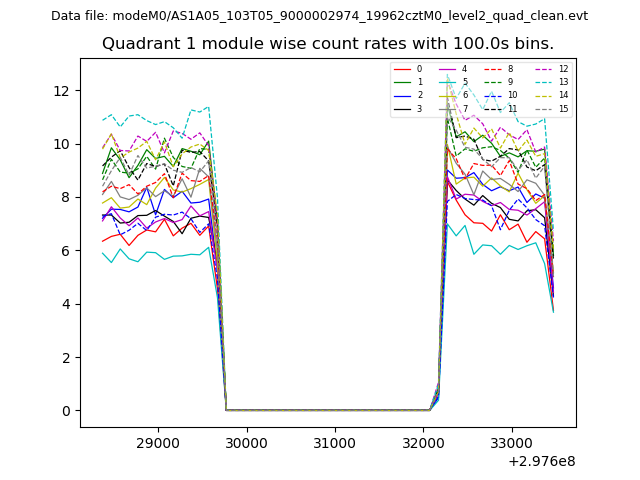
| Module-wise count rates for Quadrant A Data is divided into 100 sec bins |
 |
 |
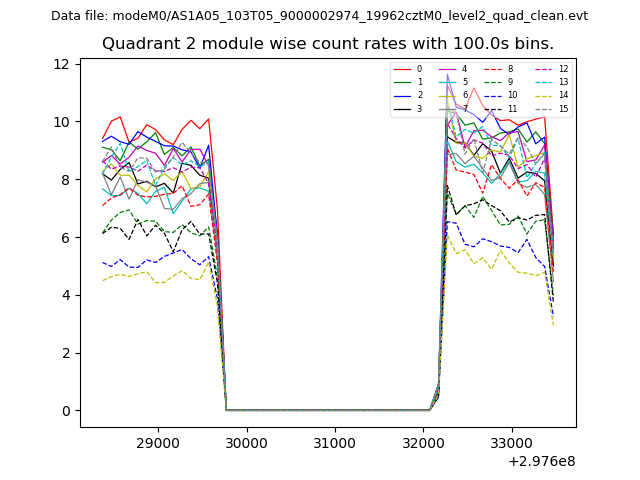
| Module-wise count rates for Quadrant B Data is divided into 100 sec bins |
 |
 |
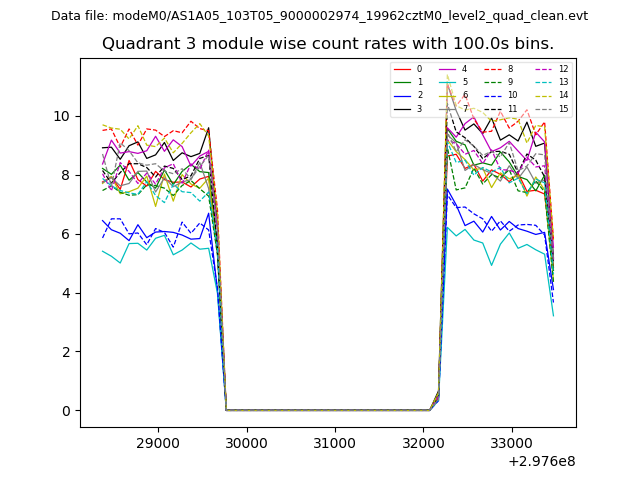
| Module-wise count rates for Quadrant C Data is divided into 100 sec bins |
 |
 |
| Module-wise count rates for Quadrant D Data is divided into 100 sec bins |
 |
 |
| Parameter | Plot |
|---|---|
| CZT HV Monitor | 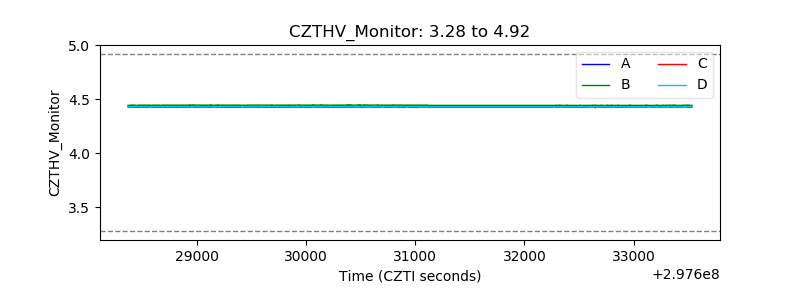 |
| D_VDD | 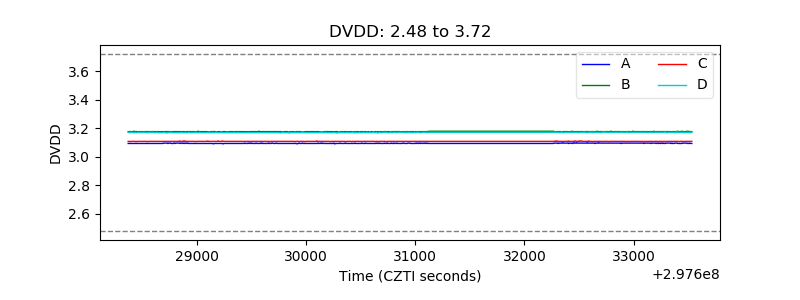 |
| Temperature 1 | 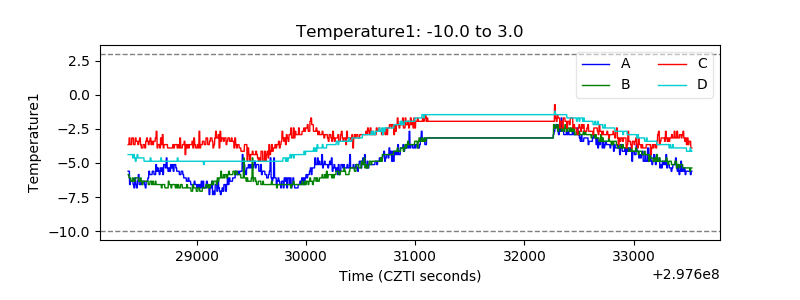 |
| Veto HV Monitor | 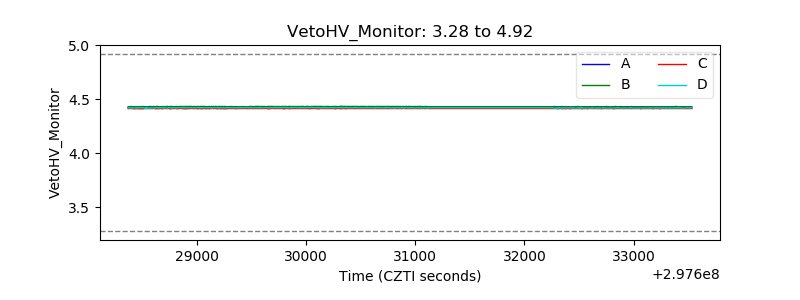 |
| Veto LLD | 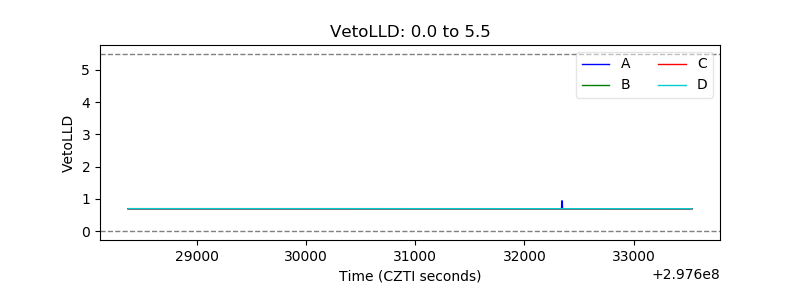 |
| Alpha Counter | 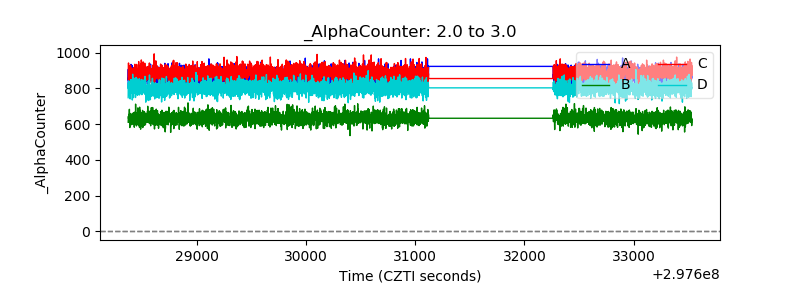 |
| _CPM_Rate | 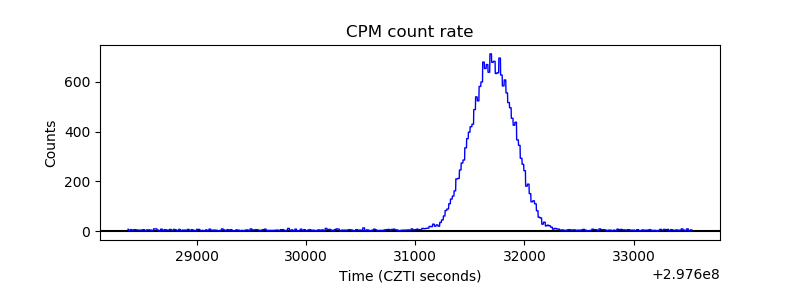 |
| CZT Counter | 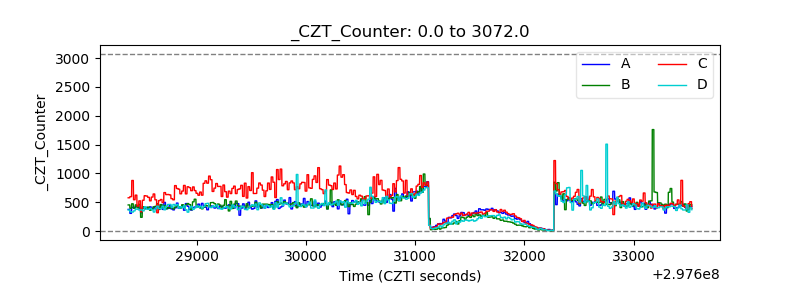 |
| +2.5 Volts monitor |  |
| +5 Volts monitor |  |
| _ROLL_ROT | 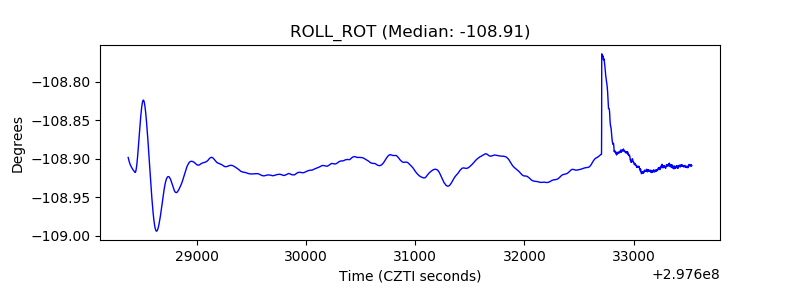 |
| _Roll_DEC | 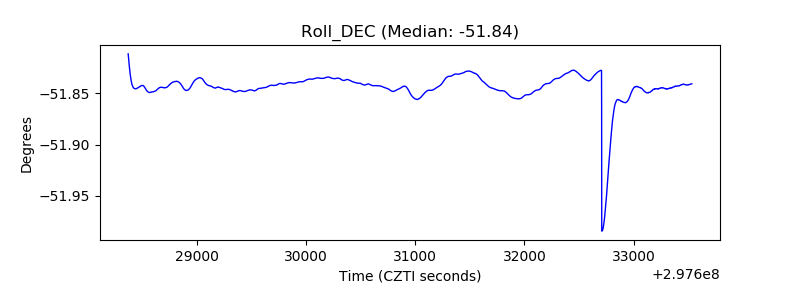 |
| _Roll_RA | 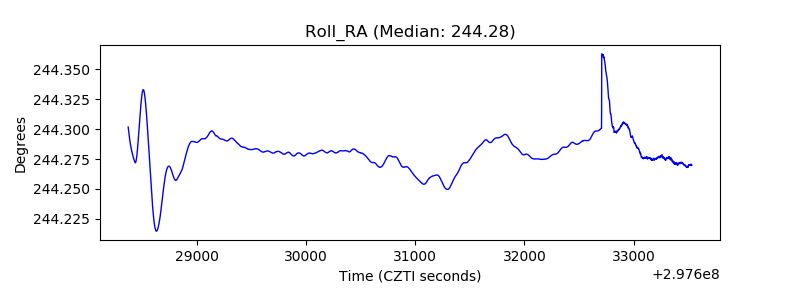 |
| Veto Counter | 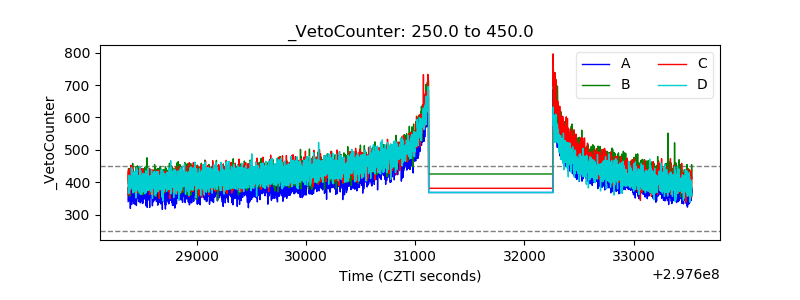 |