| Param | Original file | Final file |
|---|---|---|
| Filename | modeM0/AS1A05_103T05_9000002974_19964cztM0_level2.evt | modeM0/AS1A05_103T05_9000002974_19964cztM0_level2_quad_clean.evt |
| Size (bytes) | 567,138,240 | 114,085,440 |
| Size | 540.9 MB | 108.8 MB |
| Events in quadrant A | 4,812,181 | 718,531 |
| Events in quadrant B | 3,817,264 | 769,396 |
| Events in quadrant C | 3,872,905 | 732,812 |
| Events in quadrant D | 4,162,213 | 710,072 |
| Mode SS | |||
|---|---|---|---|
| Quadrant | BADHDUFLAG | Total packets | Discarded packets |
| A | 0 | 152 | 0 |
| B | 0 | 152 | 0 |
| C | 0 | 152 | 0 |
| D | 0 | 152 | 0 |
| Mode M0 | |||
|---|---|---|---|
| Quadrant | BADHDUFLAG | Total packets | Discarded packets |
| A | 0 | 19427 | 2 |
| B | 0 | 16473 | 2 |
| C | 0 | 16289 | 2 |
| D | 0 | 17870 | 2 |
| Mode M9 | |||
|---|---|---|---|
| Quadrant | BADHDUFLAG | Total packets | Discarded packets |
| A | 0 | 14 | 0 |
| B | 0 | 14 | 0 |
| C | 0 | 14 | 0 |
| D | 0 | 14 | 0 |
| Quadrant | Total seconds | Saturated seconds | Saturation percentage |
|---|---|---|---|
| A | 7542 | 553 | 7.332273% |
| B | 7542 | 87 | 1.153540% |
| C | 7542 | 83 | 1.100504% |
| D | 7543 | 278 | 3.685536% |
Noise dominated data is calculated using 1-second bins in cleaned event files. If a bin has >2000 counts, and if more than 50% of those come from <1% of pixels, then it is considered to be noise-dominated and hence unusable.
| Quadrant | # 1 sec bins | Bins with >0 counts | Bins with >2000 counts | High rate bins dominated by noise | Noise dominated (total time) | Noise dominated (detector-on time) | Marked lightcurve |
|---|---|---|---|---|---|---|---|
| A | 8782 | 7543 | 400 | 400 | 4.55% | 5.30% | 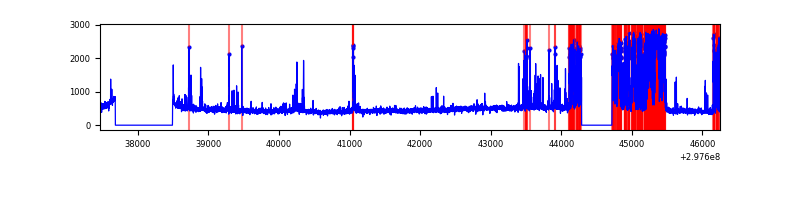 |
| B | 8782 | 7543 | 21 | 21 | 0.24% | 0.28% | 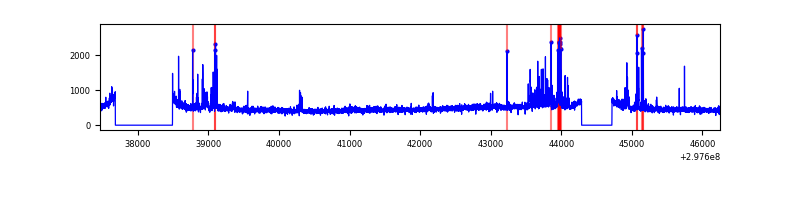 |
| C | 8782 | 7543 | 5 | 5 | 0.06% | 0.07% | 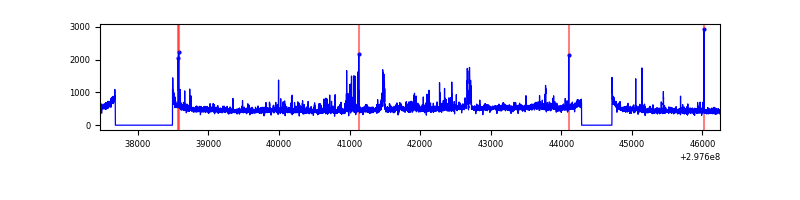 |
| D | 8783 | 7545 | 247 | 247 | 2.81% | 3.27% | 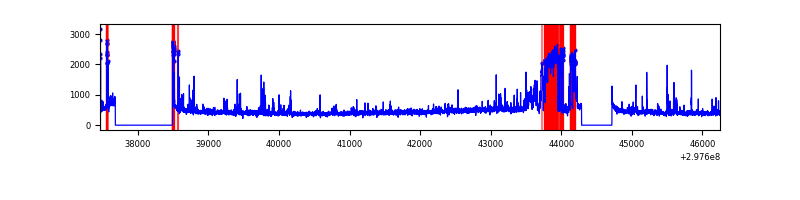 |
Top three noisy pixels from each quadrant. If the there are fewer than three noisy pixels in the level2.evt file, extra rows are filled as -1
| Pixel properties | Quadrant properties | ||||||
|---|---|---|---|---|---|---|---|
| Quadrant | DetID | PixID | Counts | Sigma | Mean | Median | Sigma |
| A | 14 | 238 | 1439105 | 8315.5 | 860 | 842 | 173.0 |
| A | 14 | 254 | 42074 | 238.39 | 860 | 842 | 173.0 |
| A | 11 | 29 | 10690 | 56.94 | 860 | 842 | 173.0 |
| B | 7 | 220 | 165193 | 961.8 | 897 | 872 | 170.8 |
| B | 0 | 197 | 68075 | 393.35 | 897 | 872 | 170.8 |
| B | 12 | 111 | 20642 | 115.72 | 897 | 872 | 170.8 |
| C | 3 | 233 | 215302 | 1063.0 | 857 | 860 | 201.7 |
| C | 14 | 238 | 135367 | 666.76 | 857 | 860 | 201.7 |
| C | 9 | 221 | 94729 | 465.31 | 857 | 860 | 201.7 |
| D | 7 | 238 | 663910 | 3210.84 | 856 | 832 | 206.5 |
| D | 7 | 96 | 81344 | 389.87 | 856 | 832 | 206.5 |
| D | 12 | 1 | 56699 | 270.53 | 856 | 832 | 206.5 |
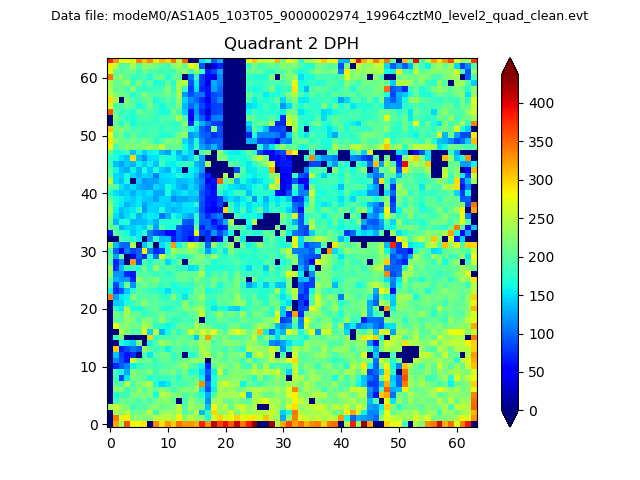
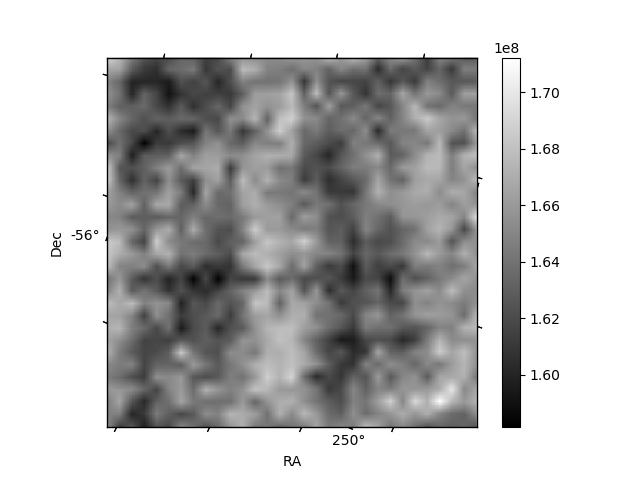
Histogram calculated using DETX and DETY for each event in the final _common_clean file
| Quadrant A |  |
 |
Quadrant B |
|---|---|---|---|
| Quadrant D |  |
 |
Quadrant C |
| Plot type | Count rate plots | Images |
|---|---|---|
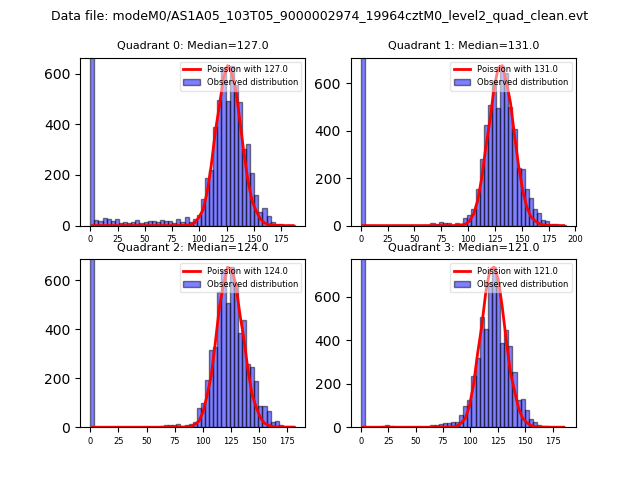
| Comparison with Poisson distribution Blue bars denote a histogram of data divided into 1 sec bins. Red curve is a Poisson curve with rate = median count rate of data. |
 |
 |
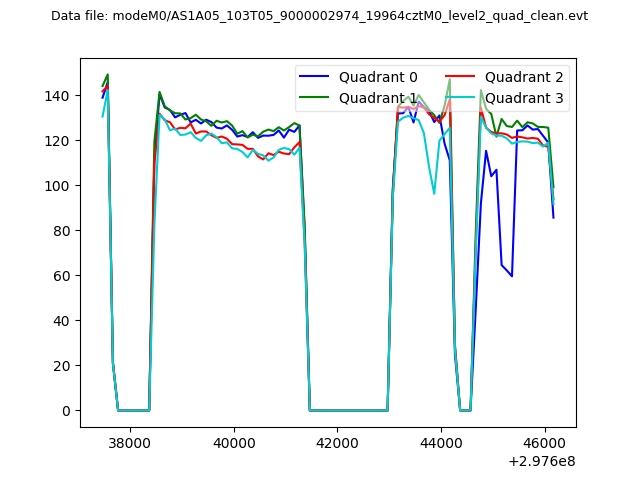
| Quadrant-wise count rates Data is divided into 100 sec bins |
 |
|
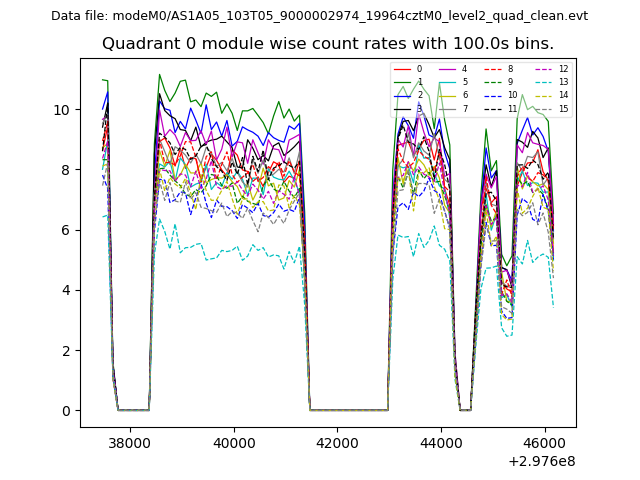
| Module-wise count rates for Quadrant A Data is divided into 100 sec bins |
 |
 |
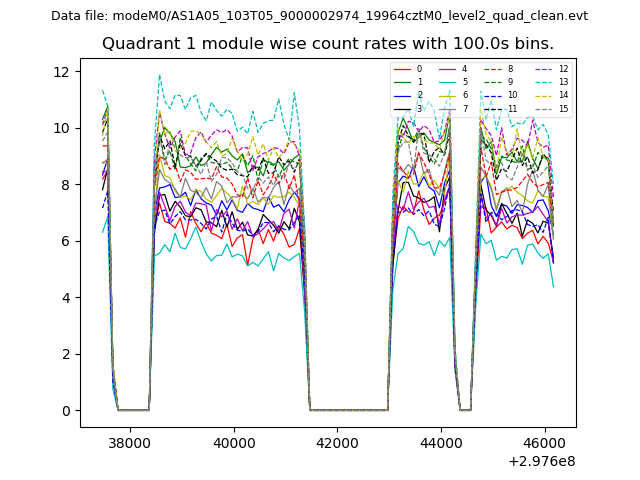
| Module-wise count rates for Quadrant B Data is divided into 100 sec bins |
 |
 |
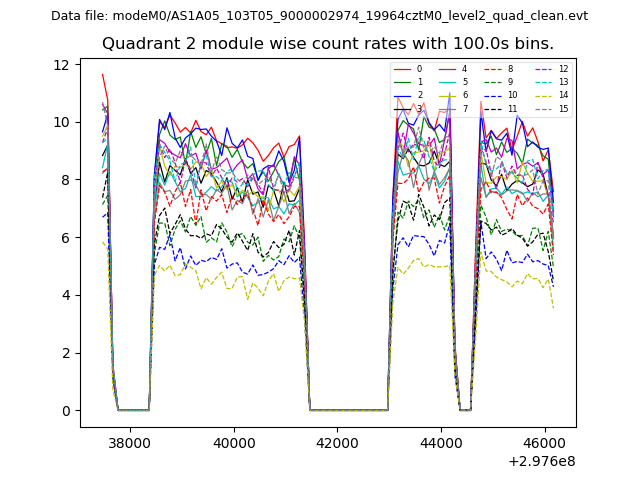
| Module-wise count rates for Quadrant C Data is divided into 100 sec bins |
 |
 |
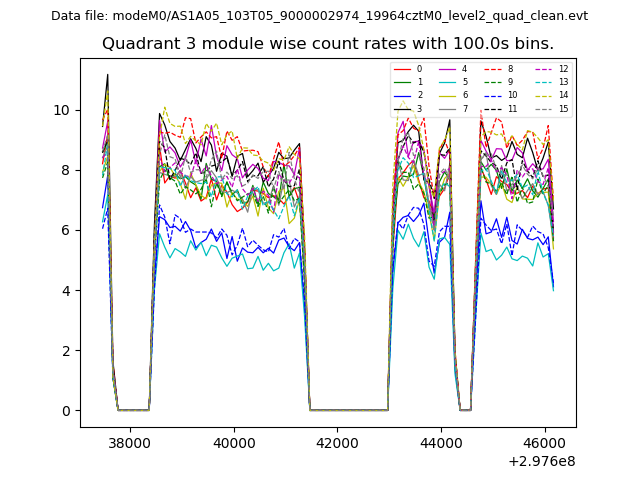
| Module-wise count rates for Quadrant D Data is divided into 100 sec bins |
 |
 |
| Parameter | Plot |
|---|---|
| CZT HV Monitor | 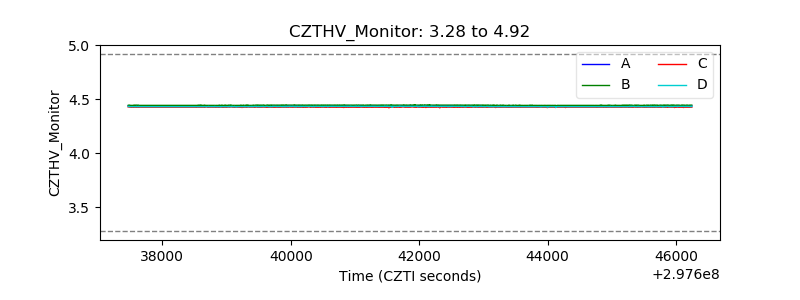 |
| D_VDD | 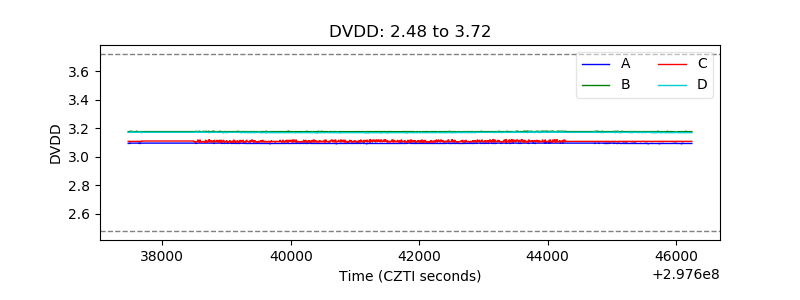 |
| Temperature 1 | 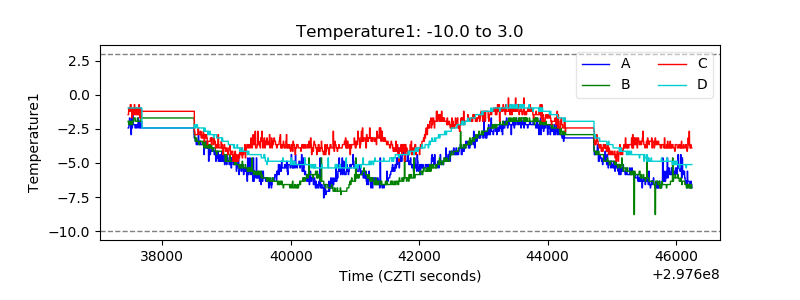 |
| Veto HV Monitor | 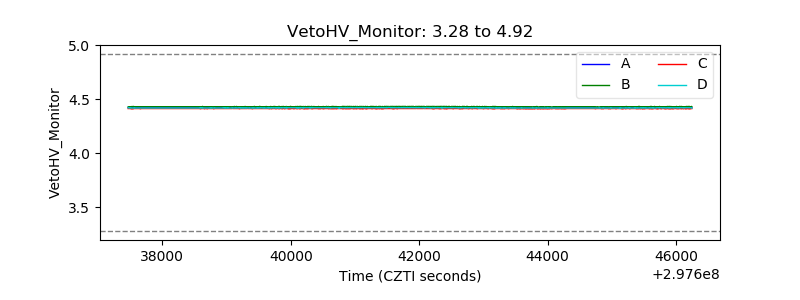 |
| Veto LLD | 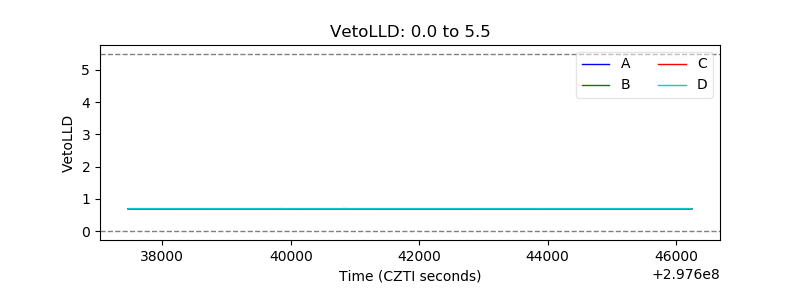 |
| Alpha Counter | 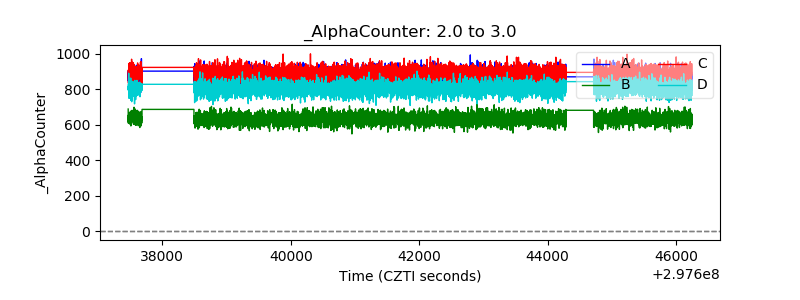 |
| _CPM_Rate | 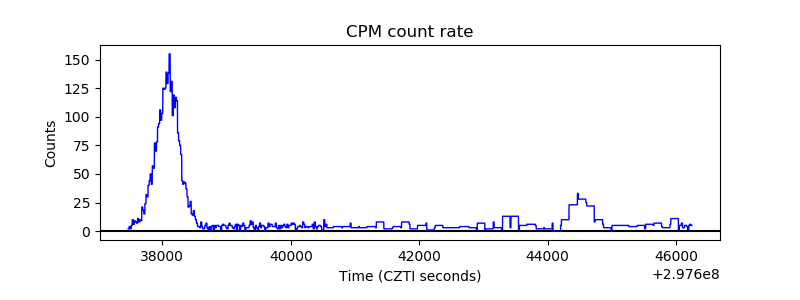 |
| CZT Counter | 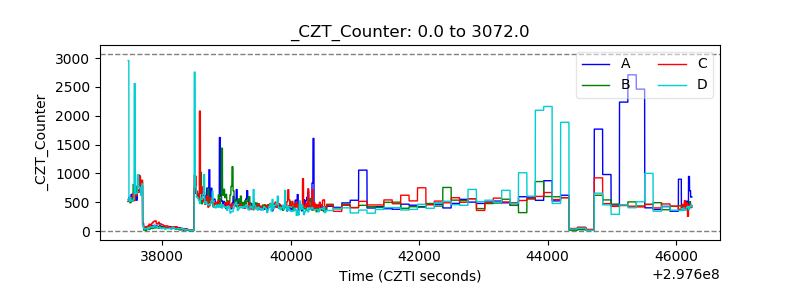 |
| +2.5 Volts monitor |  |
| +5 Volts monitor |  |
| _ROLL_ROT | 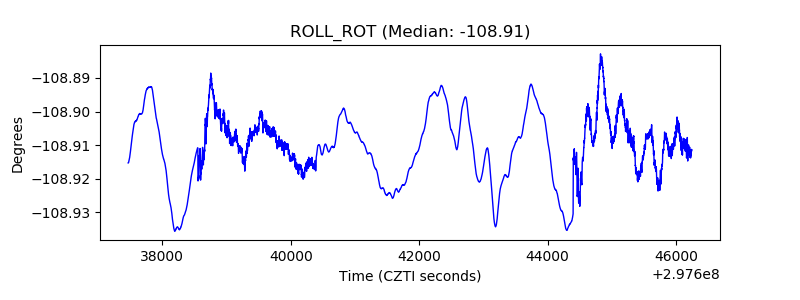 |
| _Roll_DEC | 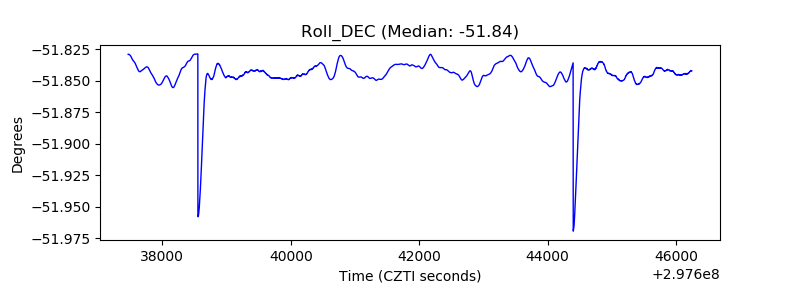 |
| _Roll_RA | 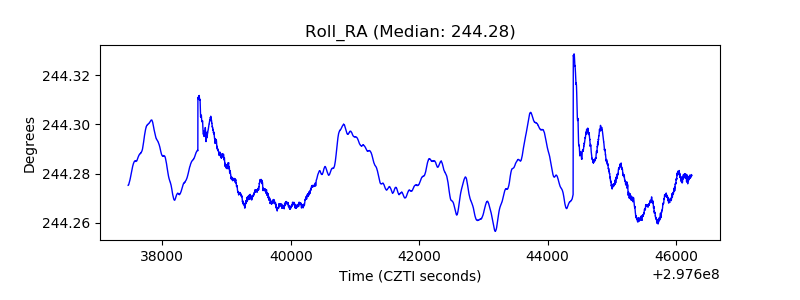 |
| Veto Counter | 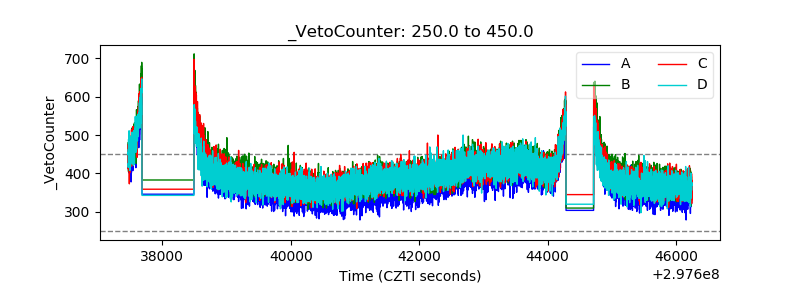 |