| Param | Original file | Final file |
|---|---|---|
| Filename | modeM0/AS1A05_103T05_9000002974_19965cztM0_level2.fits | modeM0/AS1A05_103T05_9000002974_19965cztM0_level2_quad_clean.evt |
| Size (bytes) | 668,828,160 | 125,861,760 |
| Size | 637.8 MB | 120.0 MB |
| Events in quadrant A | 10,235,552 | 615,895 |
| Events in quadrant B | 4,097,222 | 966,349 |
| Events in quadrant C | 4,238,487 | 908,530 |
| Events in quadrant D | 5,564,072 | 763,460 |
| Mode SS | |||
|---|---|---|---|
| Quadrant | BADHDUFLAG | Total packets | Discarded packets |
| A | 0 | 164 | 0 |
| B | 0 | 164 | 0 |
| C | 0 | 164 | 0 |
| D | 0 | 164 | 0 |
| Mode M0 | |||
|---|---|---|---|
| Quadrant | BADHDUFLAG | Total packets | Discarded packets |
| A | 0 | 35970 | 0 |
| B | 0 | 17534 | 0 |
| C | 0 | 17713 | 0 |
| D | 0 | 22268 | 0 |
| Mode M9 | |||
|---|---|---|---|
| Quadrant | BADHDUFLAG | Total packets | Discarded packets |
| A | 0 | 7 | 0 |
| B | 0 | 7 | 0 |
| C | 0 | 7 | 0 |
| D | 0 | 7 | 0 |
| Quadrant | Total seconds | Saturated seconds | Saturation percentage |
|---|---|---|---|
| A | 8006 | 3076 | 38.421184% |
| B | 8007 | 136 | 1.698514% |
| C | 8007 | 181 | 2.260522% |
| D | 8006 | 834 | 10.417187% |
Noise dominated data is calculated using 1-second bins in cleaned event files. If a bin has >2000 counts, and if more than 50% of those come from <1% of pixels, then it is considered to be noise-dominated and hence unusable.
| Quadrant | # 1 sec bins | Bins with >0 counts | Bins with >2000 counts | High rate bins dominated by noise | Noise dominated (total time) | Noise dominated (detector-on time) | Marked lightcurve |
|---|---|---|---|---|---|---|---|
| A | 8691 | 8006 | 2340 | 2340 | 26.92% | 29.23% | 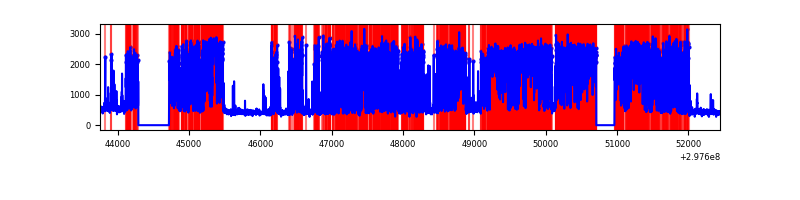 |
| B | 8692 | 8008 | 30 | 30 | 0.35% | 0.37% | 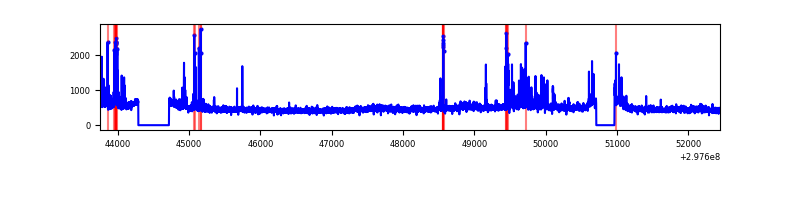 |
| C | 8692 | 8009 | 74 | 74 | 0.85% | 0.92% | 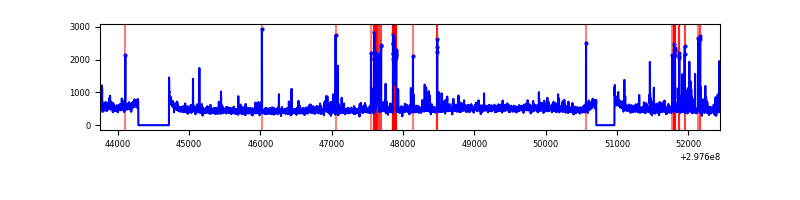 |
| D | 8691 | 8007 | 756 | 756 | 8.70% | 9.44% | 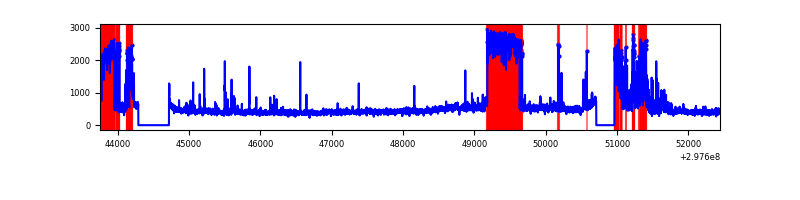 |
Top three noisy pixels from each quadrant. If the there are fewer than three noisy pixels in the level2.evt file, extra rows are filled as -1
| Pixel properties | Quadrant properties | ||||||
|---|---|---|---|---|---|---|---|
| Quadrant | DetID | PixID | Counts | Sigma | Mean | Median | Sigma |
| A | 14 | 238 | 7367335 | 49844.97 | 733 | 719 | 147.8 |
| A | 14 | 254 | 38297 | 254.27 | 733 | 719 | 147.8 |
| A | 11 | 29 | 7789 | 47.84 | 733 | 719 | 147.8 |
| B | 7 | 220 | 218684 | 1201.35 | 950 | 923 | 181.3 |
| B | 0 | 190 | 33952 | 182.22 | 950 | 923 | 181.3 |
| B | 0 | 198 | 29511 | 157.71 | 950 | 923 | 181.3 |
| C | 9 | 221 | 414743 | 1935.06 | 908 | 912 | 213.9 |
| C | 14 | 238 | 142340 | 661.31 | 908 | 912 | 213.9 |
| C | 3 | 233 | 105438 | 488.76 | 908 | 912 | 213.9 |
| D | 1 | 20 | 1078163 | 5196.42 | 867 | 843 | 207.3 |
| D | 7 | 238 | 742182 | 3575.83 | 867 | 843 | 207.3 |
| D | 12 | 218 | 311827 | 1500.02 | 867 | 843 | 207.3 |
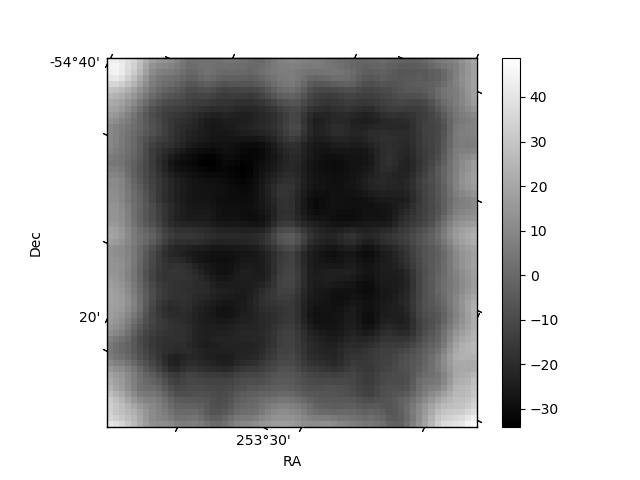
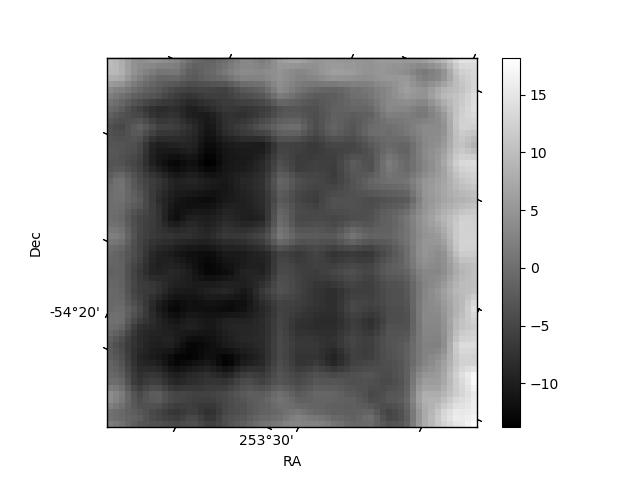
Histogram calculated using DETX and DETY for each event in the final _common_clean file
| Quadrant A | 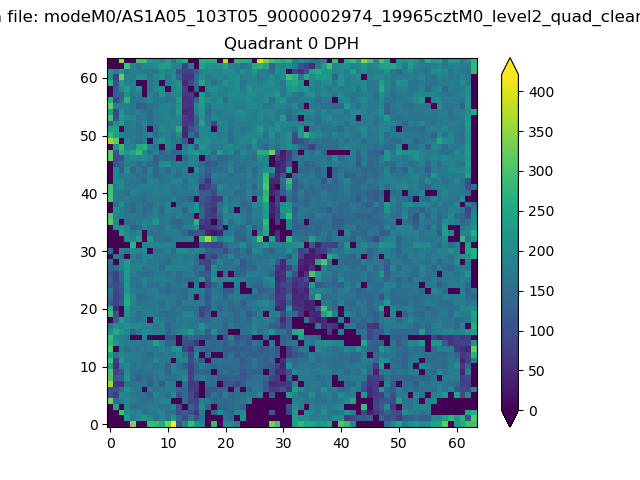 |
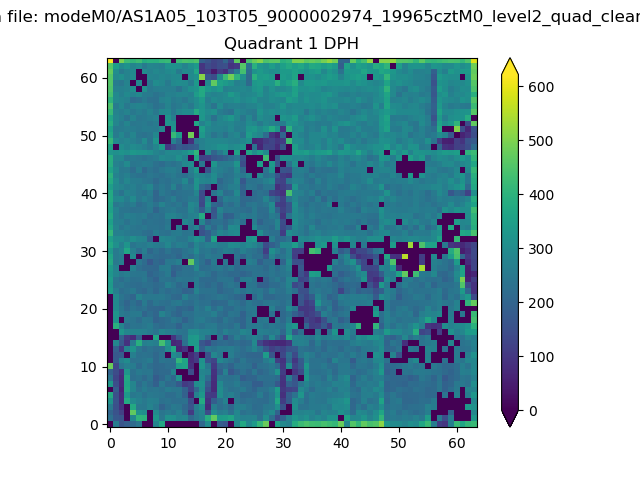 |
Quadrant B |
|---|---|---|---|
| Quadrant D |  |
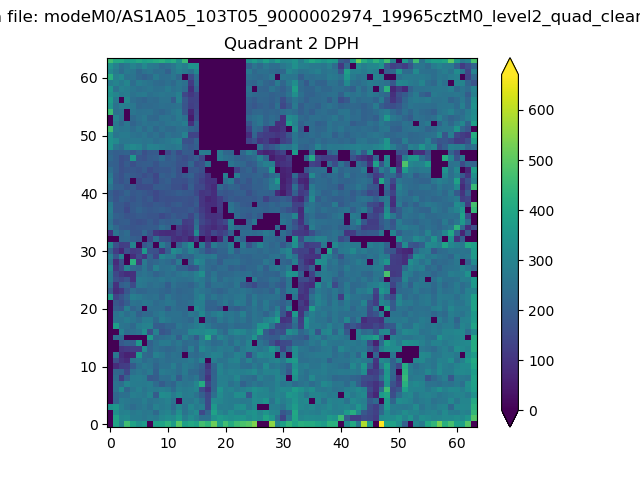 |
Quadrant C |
| Plot type | Count rate plots | Images |
|---|---|---|
| Comparison with Poisson distribution Blue bars denote a histogram of data divided into 1 sec bins. Red curve is a Poisson curve with rate = median count rate of data. |
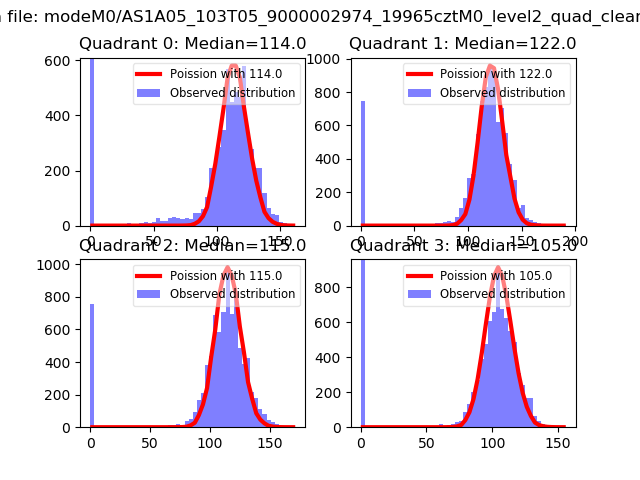 |
 |
| Quadrant-wise count rates Data is divided into 100 sec bins |
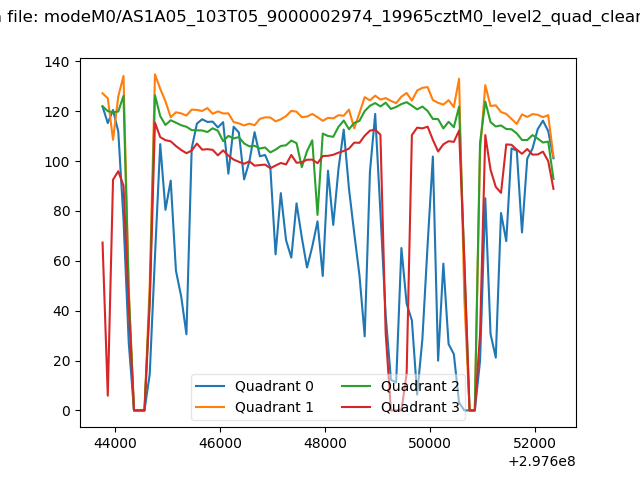 |
|
| Module-wise count rates for Quadrant A Data is divided into 100 sec bins |
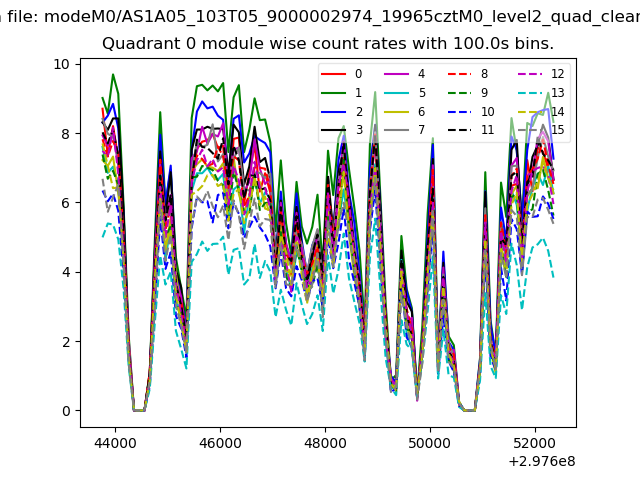 |
 |
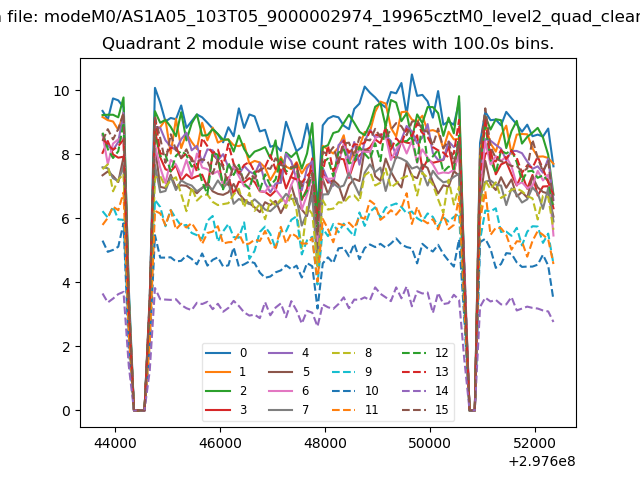
| Module-wise count rates for Quadrant B Data is divided into 100 sec bins |
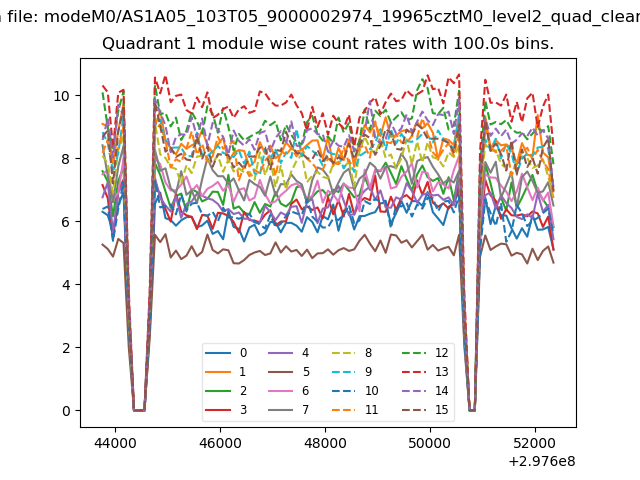 |
 |
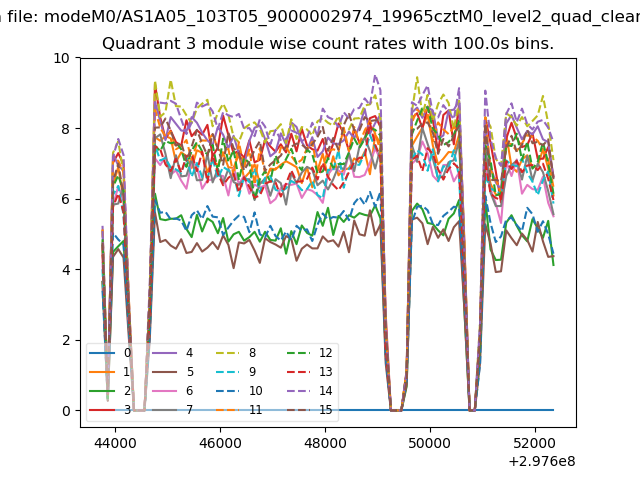
| Module-wise count rates for Quadrant C Data is divided into 100 sec bins |
 |
 |
| Module-wise count rates for Quadrant D Data is divided into 100 sec bins |
 |
 |
| Parameter | Plot |
|---|---|
| CZT HV Monitor | 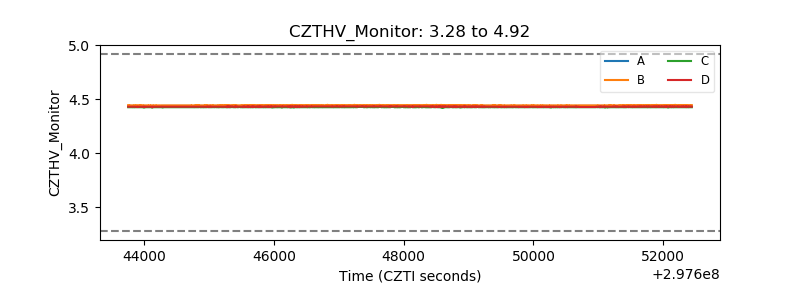 |
| D_VDD |  |
| Temperature 1 | 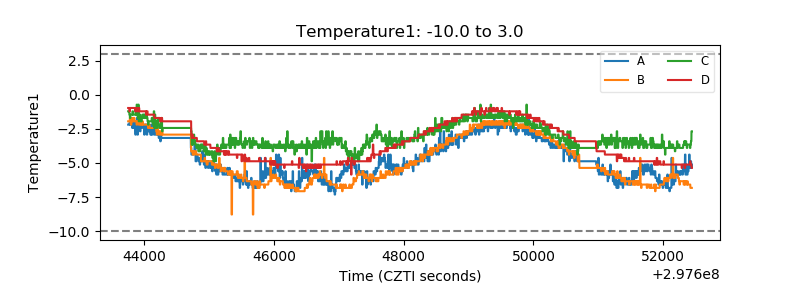 |
| Veto HV Monitor | 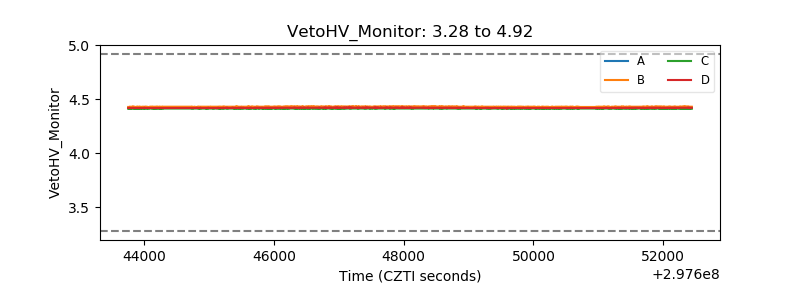 |
| Veto LLD | 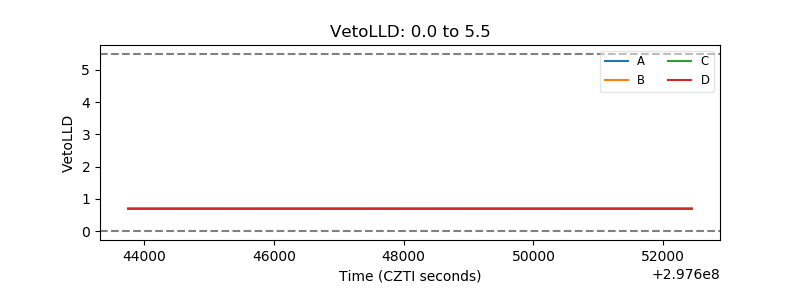 |
| Alpha Counter | 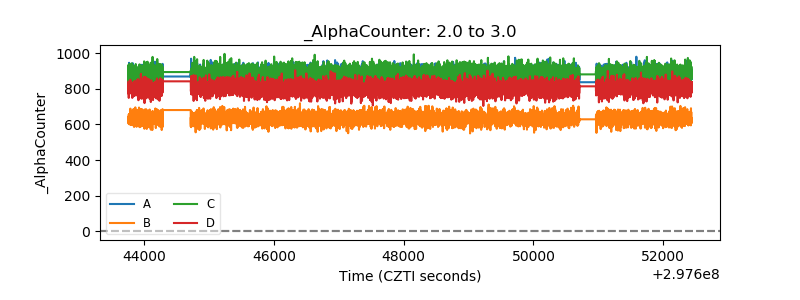 |
| _CPM_Rate | 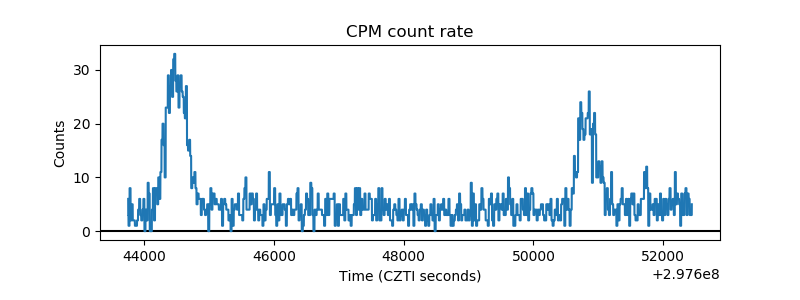 |
| CZT Counter | 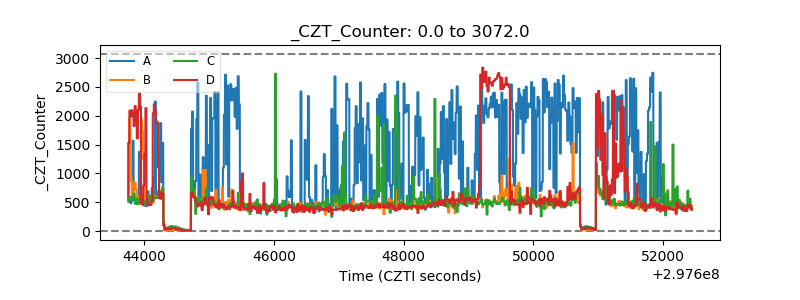 |
| +2.5 Volts monitor |  |
| +5 Volts monitor |  |
| _ROLL_ROT | 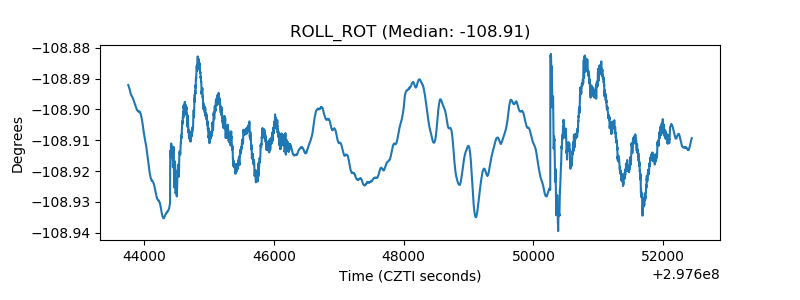 |
| _Roll_DEC | 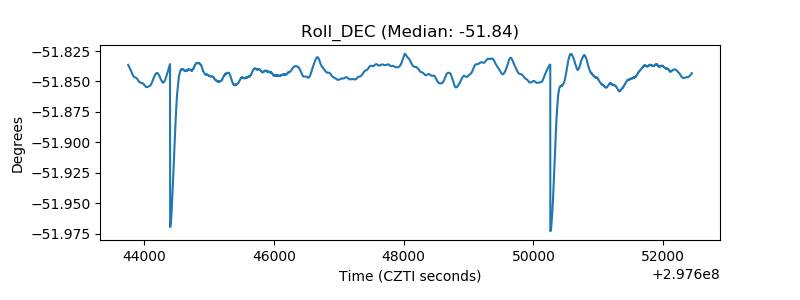 |
| _Roll_RA | 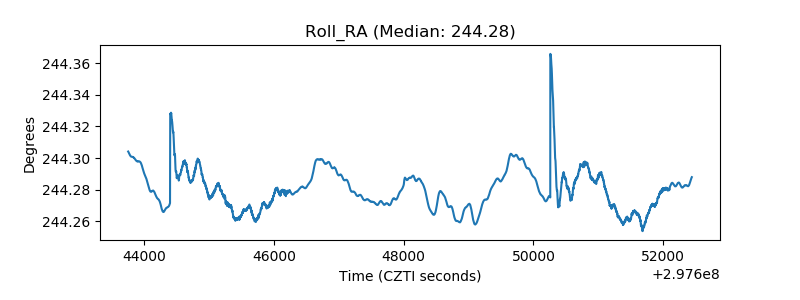 |
| Veto Counter | 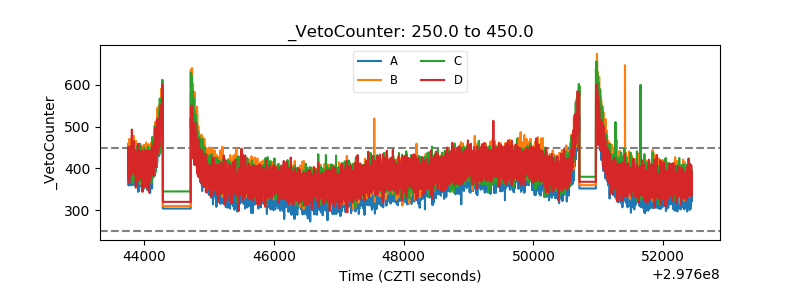 |