| Param | Original file | Final file |
|---|---|---|
| Filename | modeM0/AS1A05_103T05_9000002974_19966cztM0_level2.evt | modeM0/AS1A05_103T05_9000002974_19966cztM0_level2_quad_clean.evt |
| Size (bytes) | 801,279,360 | 105,039,360 |
| Size | 764.2 MB | 100.2 MB |
| Events in quadrant A | 11,805,612 | 435,448 |
| Events in quadrant B | 3,777,678 | 770,934 |
| Events in quadrant C | 4,162,662 | 731,360 |
| Events in quadrant D | 4,002,602 | 709,550 |
| Mode SS | |||
|---|---|---|---|
| Quadrant | BADHDUFLAG | Total packets | Discarded packets |
| A | 0 | 158 | 0 |
| B | 0 | 158 | 0 |
| C | 0 | 158 | 0 |
| D | 0 | 158 | 0 |
| Mode M0 | |||
|---|---|---|---|
| Quadrant | BADHDUFLAG | Total packets | Discarded packets |
| A | 0 | 40387 | 4 |
| B | 0 | 16327 | 2 |
| C | 0 | 17229 | 2 |
| D | 0 | 17470 | 2 |
| Mode M9 | |||
|---|---|---|---|
| Quadrant | BADHDUFLAG | Total packets | Discarded packets |
| A | 0 | 6 | 0 |
| B | 0 | 6 | 0 |
| C | 0 | 6 | 0 |
| D | 0 | 6 | 0 |
| Quadrant | Total seconds | Saturated seconds | Saturation percentage |
|---|---|---|---|
| A | 7644 | 4034 | 52.773417% |
| B | 7644 | 166 | 2.171638% |
| C | 7644 | 212 | 2.773417% |
| D | 7644 | 233 | 3.048142% |
Noise dominated data is calculated using 1-second bins in cleaned event files. If a bin has >2000 counts, and if more than 50% of those come from <1% of pixels, then it is considered to be noise-dominated and hence unusable.
| Quadrant | # 1 sec bins | Bins with >0 counts | Bins with >2000 counts | High rate bins dominated by noise | Noise dominated (total time) | Noise dominated (detector-on time) | Marked lightcurve |
|---|---|---|---|---|---|---|---|
| A | 8303 | 7643 | 3130 | 3130 | 37.70% | 40.95% | 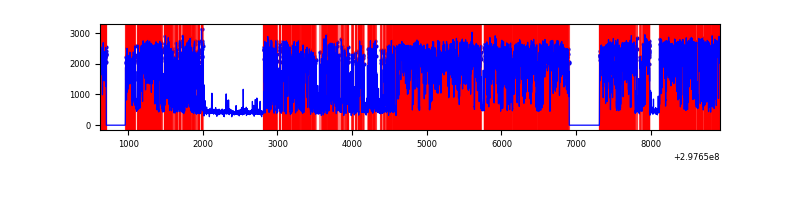 |
| B | 8304 | 7644 | 11 | 11 | 0.13% | 0.14% | 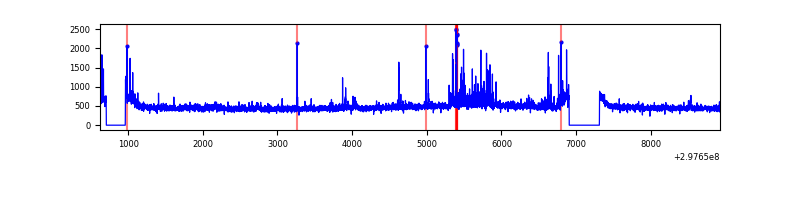 |
| C | 8304 | 7645 | 44 | 44 | 0.53% | 0.58% | 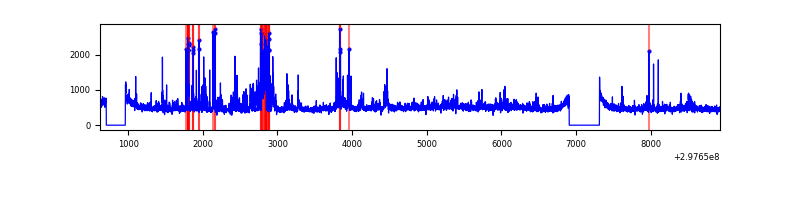 |
| D | 8304 | 7644 | 129 | 129 | 1.55% | 1.69% | 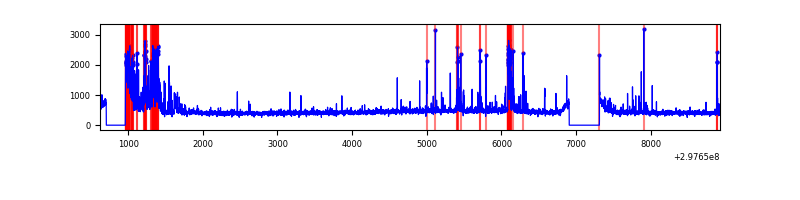 |
Top three noisy pixels from each quadrant. If the there are fewer than three noisy pixels in the level2.evt file, extra rows are filled as -1
| Pixel properties | Quadrant properties | ||||||
|---|---|---|---|---|---|---|---|
| Quadrant | DetID | PixID | Counts | Sigma | Mean | Median | Sigma |
| A | 14 | 238 | 9550558 | 81933.66 | 570 | 559 | 116.6 |
| A | 14 | 254 | 49015 | 415.73 | 570 | 559 | 116.6 |
| A | 11 | 29 | 6952 | 54.85 | 570 | 559 | 116.6 |
| B | 7 | 220 | 139435 | 809.27 | 901 | 876 | 171.2 |
| B | 0 | 190 | 23953 | 134.78 | 901 | 876 | 171.2 |
| B | 12 | 111 | 21298 | 119.28 | 901 | 876 | 171.2 |
| C | 9 | 221 | 493443 | 2421.41 | 867 | 872 | 203.4 |
| C | 14 | 238 | 136948 | 668.93 | 867 | 872 | 203.4 |
| C | 3 | 233 | 129842 | 634.0 | 867 | 872 | 203.4 |
| D | 12 | 218 | 488815 | 2347.37 | 861 | 837 | 207.9 |
| D | 7 | 238 | 181189 | 867.56 | 861 | 837 | 207.9 |
| D | 2 | 234 | 32288 | 151.29 | 861 | 837 | 207.9 |
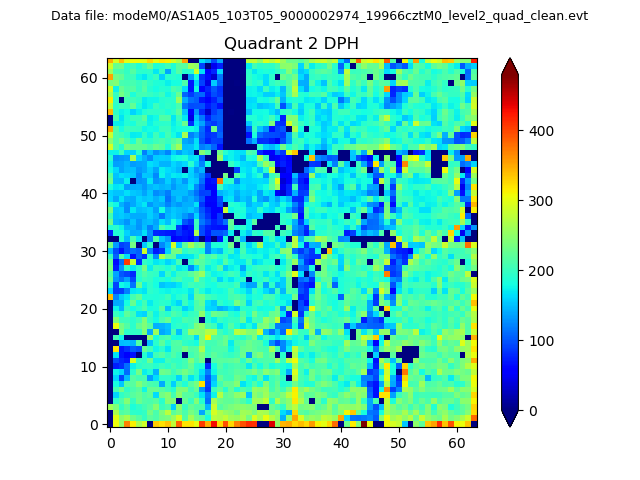
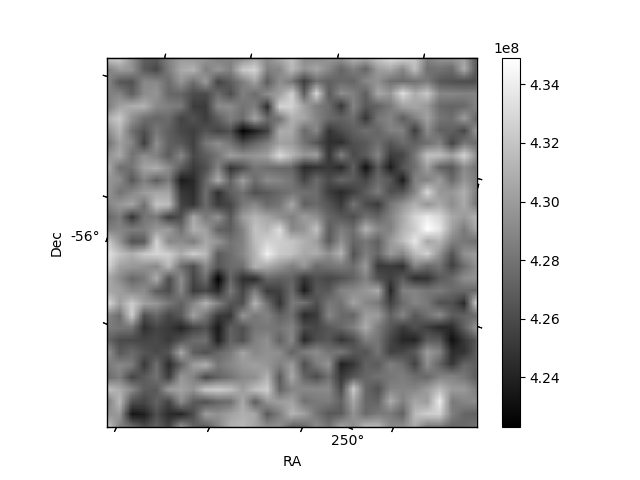
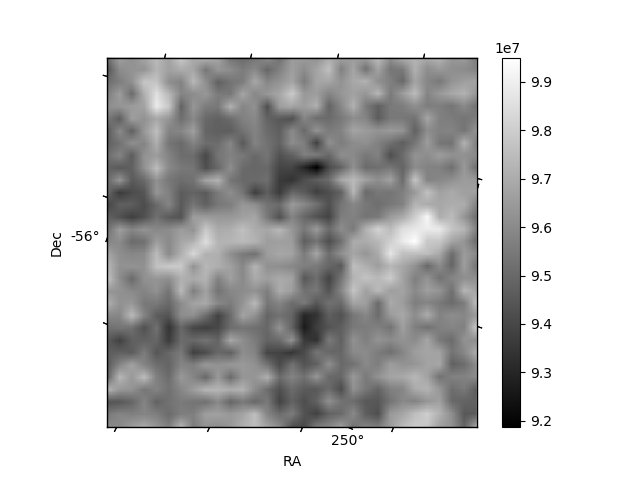
Histogram calculated using DETX and DETY for each event in the final _common_clean file
| Quadrant A | 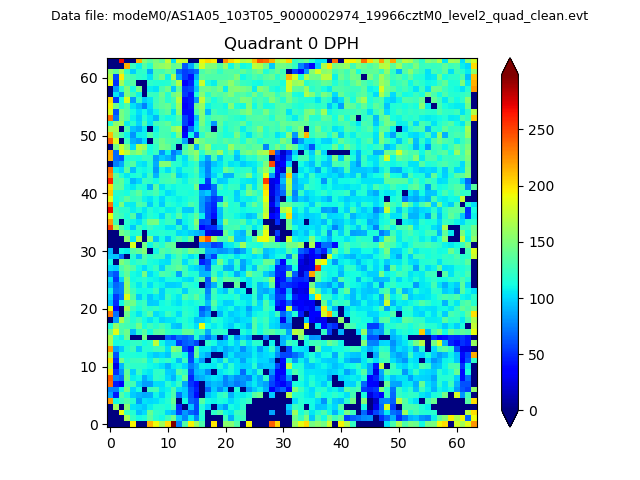 |
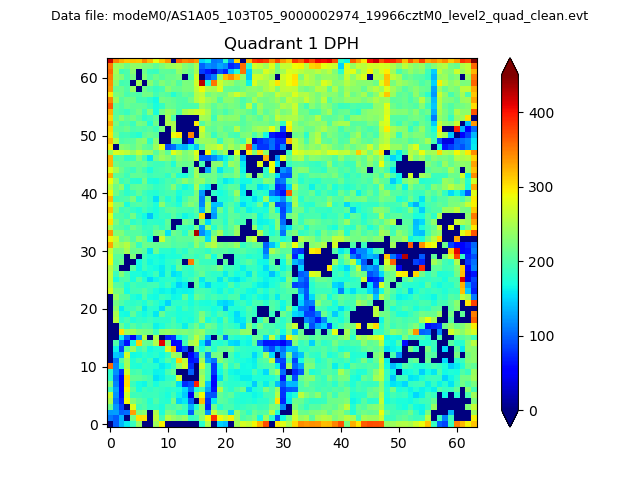 |
Quadrant B |
|---|---|---|---|
| Quadrant D | 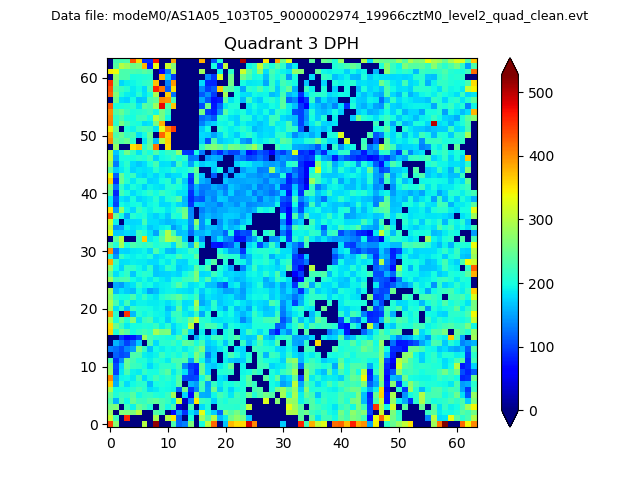 |
 |
Quadrant C |
| Plot type | Count rate plots | Images |
|---|---|---|
| Comparison with Poisson distribution Blue bars denote a histogram of data divided into 1 sec bins. Red curve is a Poisson curve with rate = median count rate of data. |
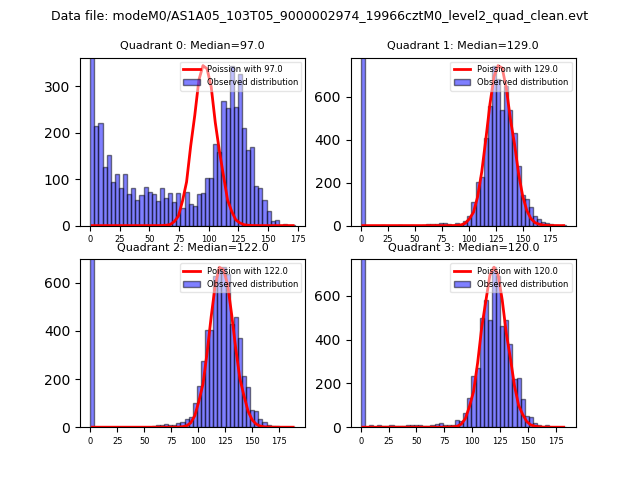 |
 |
| Quadrant-wise count rates Data is divided into 100 sec bins |
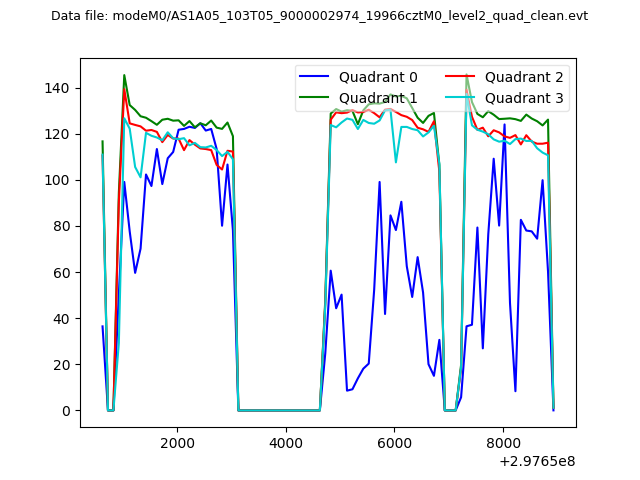 |
|
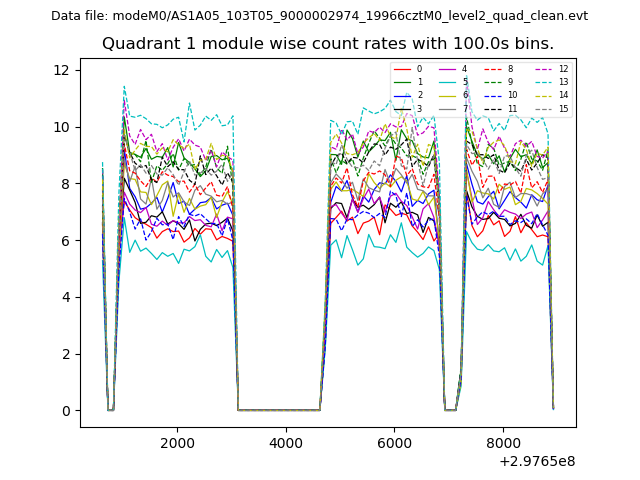
| Module-wise count rates for Quadrant A Data is divided into 100 sec bins |
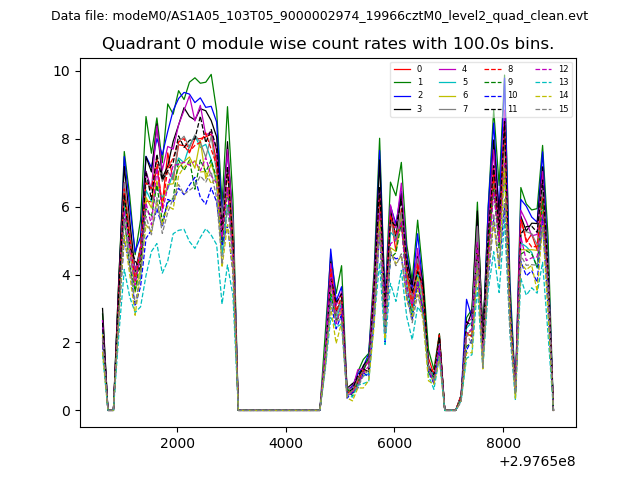 |
 |
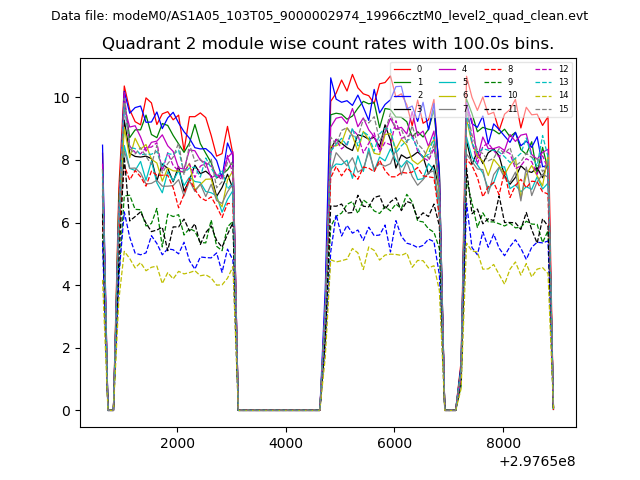
| Module-wise count rates for Quadrant B Data is divided into 100 sec bins |
 |
 |
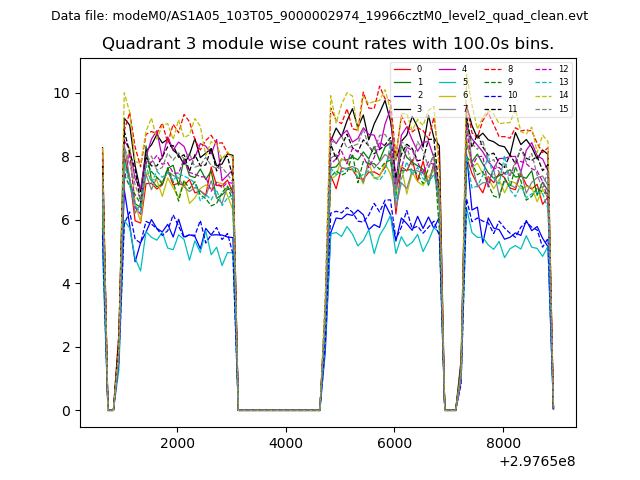
| Module-wise count rates for Quadrant C Data is divided into 100 sec bins |
 |
 |
| Module-wise count rates for Quadrant D Data is divided into 100 sec bins |
 |
 |
| Parameter | Plot |
|---|---|
| CZT HV Monitor | 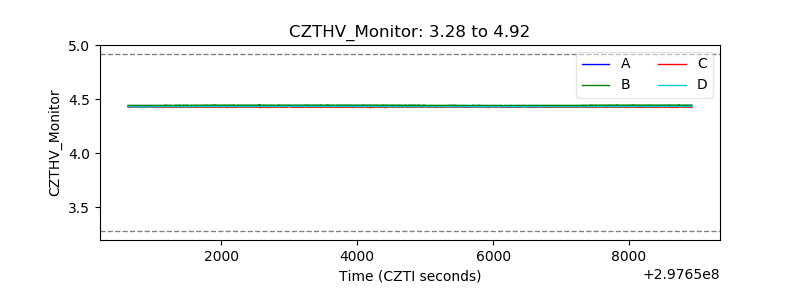 |
| D_VDD | 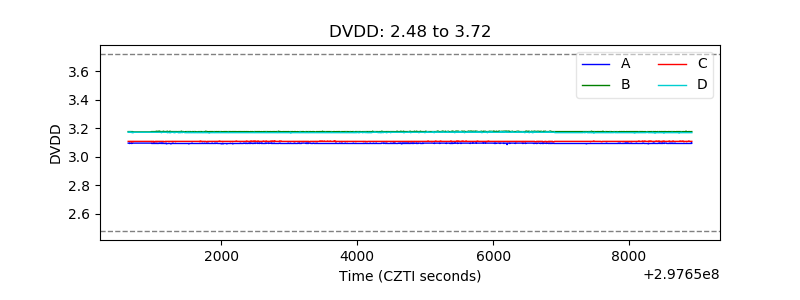 |
| Temperature 1 | 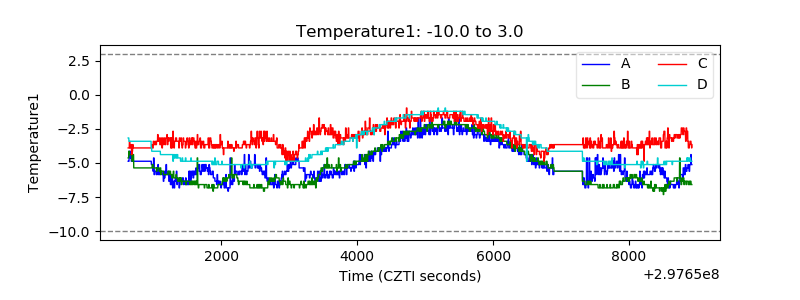 |
| Veto HV Monitor | 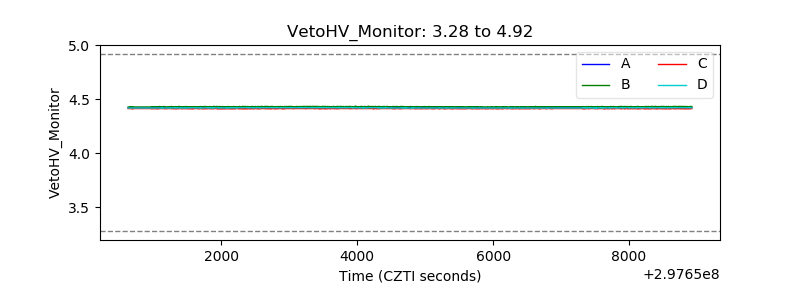 |
| Veto LLD | 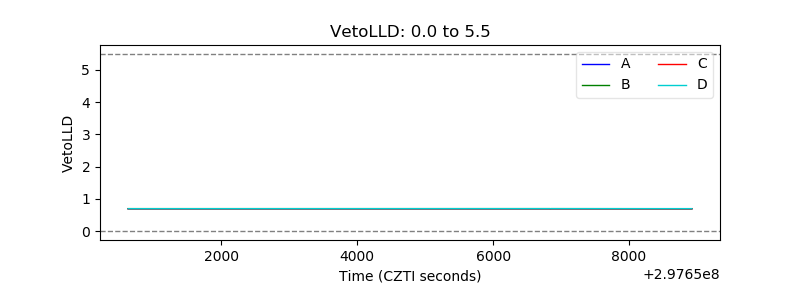 |
| Alpha Counter | 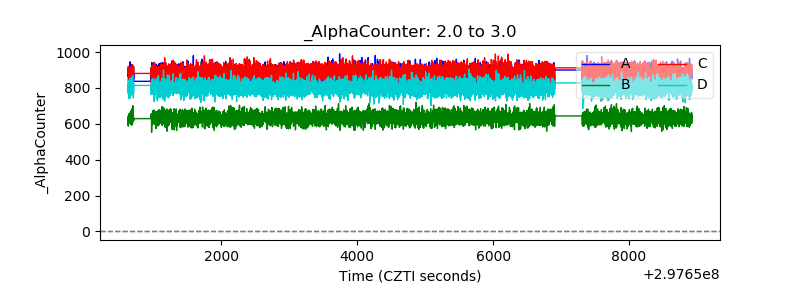 |
| _CPM_Rate | 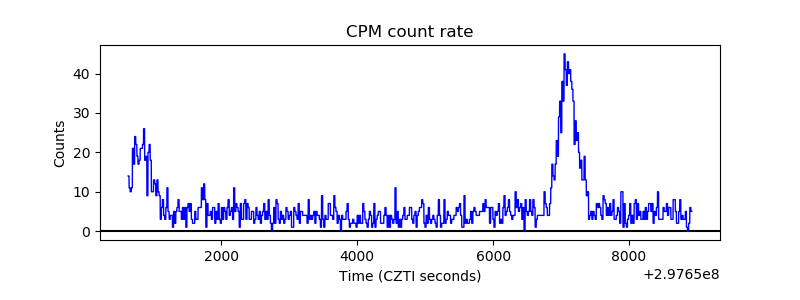 |
| CZT Counter | 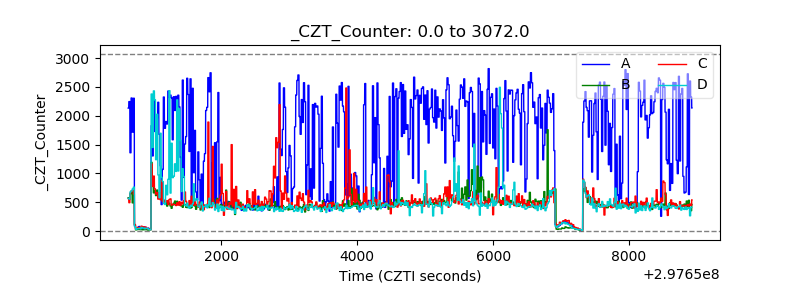 |
| +2.5 Volts monitor |  |
| +5 Volts monitor |  |
| _ROLL_ROT | 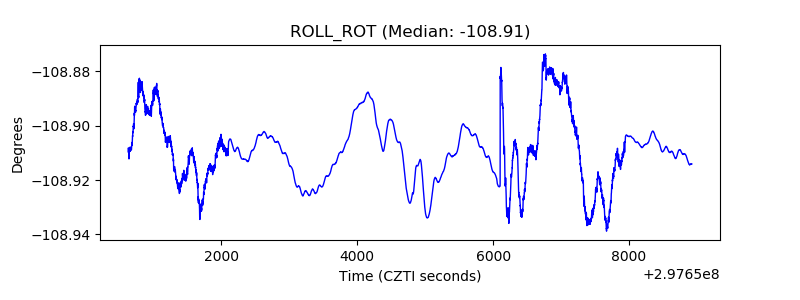 |
| _Roll_DEC | 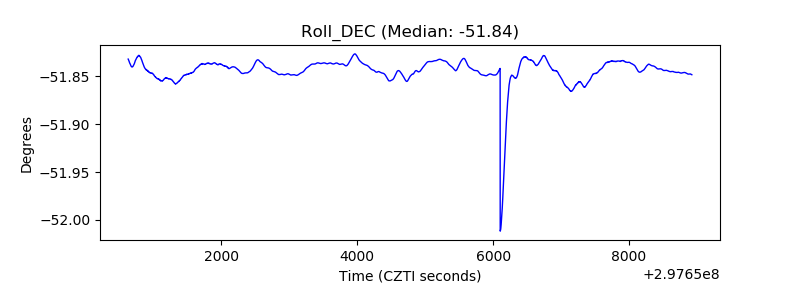 |
| _Roll_RA | 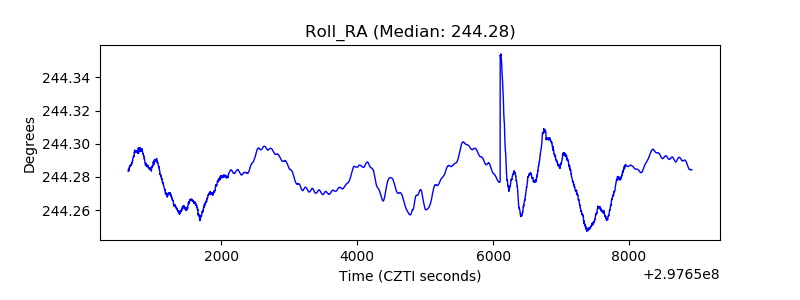 |
| Veto Counter | 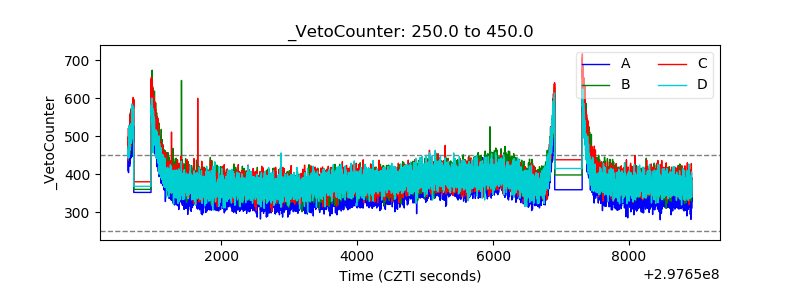 |