| Param | Original file | Final file |
|---|---|---|
| Filename | modeM0/AS1A05_103T05_9000002974_19968cztM0_level2.evt | modeM0/AS1A05_103T05_9000002974_19968cztM0_level2_quad_clean.evt |
| Size (bytes) | 577,416,960 | 61,430,400 |
| Size | 550.7 MB | 58.6 MB |
| Events in quadrant A | 9,747,565 | 210,423 |
| Events in quadrant B | 2,442,610 | 444,032 |
| Events in quadrant C | 2,560,424 | 425,493 |
| Events in quadrant D | 2,386,965 | 418,470 |
| Mode SS | |||
|---|---|---|---|
| Quadrant | BADHDUFLAG | Total packets | Discarded packets |
| A | 0 | 104 | 0 |
| B | 0 | 104 | 0 |
| C | 0 | 104 | 0 |
| D | 0 | 104 | 0 |
| Mode M0 | |||
|---|---|---|---|
| Quadrant | BADHDUFLAG | Total packets | Discarded packets |
| A | 0 | 32489 | 0 |
| B | 0 | 10604 | 0 |
| C | 0 | 10837 | 0 |
| D | 0 | 10787 | 0 |
| Quadrant | Total seconds | Saturated seconds | Saturation percentage |
|---|---|---|---|
| A | 5138 | 3458 | 67.302452% |
| B | 5139 | 22 | 0.428099% |
| C | 5139 | 38 | 0.739443% |
| D | 5139 | 26 | 0.505935% |
Noise dominated data is calculated using 1-second bins in cleaned event files. If a bin has >2000 counts, and if more than 50% of those come from <1% of pixels, then it is considered to be noise-dominated and hence unusable.
| Quadrant | # 1 sec bins | Bins with >0 counts | Bins with >2000 counts | High rate bins dominated by noise | Noise dominated (total time) | Noise dominated (detector-on time) | Marked lightcurve |
|---|---|---|---|---|---|---|---|
| A | 5137 | 5137 | 2916 | 2916 | 56.76% | 56.76% | 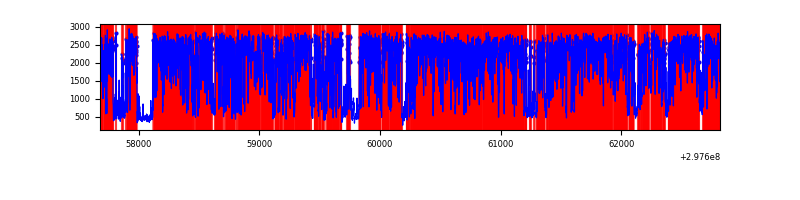 |
| B | 5139 | 5139 | 14 | 14 | 0.27% | 0.27% |  |
| C | 5139 | 5139 | 12 | 12 | 0.23% | 0.23% | 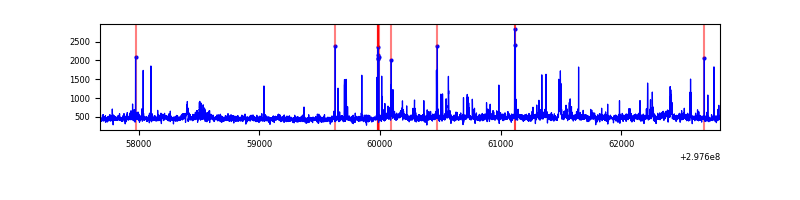 |
| D | 5139 | 5139 | 26 | 26 | 0.51% | 0.51% |  |
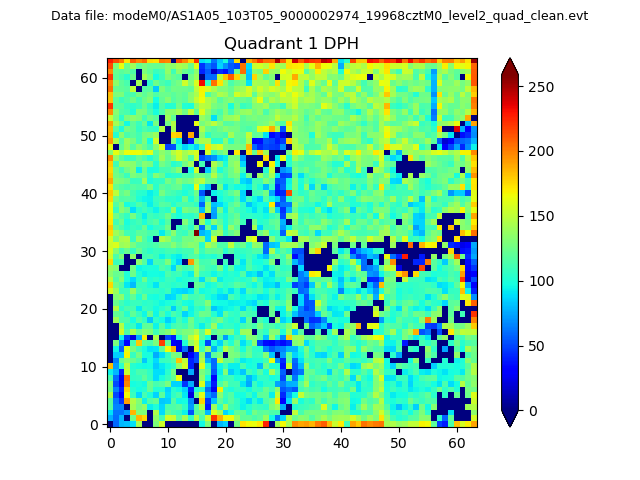
Top three noisy pixels from each quadrant. If the there are fewer than three noisy pixels in the level2.evt file, extra rows are filled as -1
| Pixel properties | Quadrant properties | ||||||
|---|---|---|---|---|---|---|---|
| Quadrant | DetID | PixID | Counts | Sigma | Mean | Median | Sigma |
| A | 14 | 238 | 8441164 | 125508.02 | 326 | 319 | 67.3 |
| A | 14 | 254 | 40355 | 595.3 | 326 | 319 | 67.3 |
| A | 11 | 29 | 5178 | 72.25 | 326 | 319 | 67.3 |
| B | 7 | 220 | 72924 | 634.5 | 591 | 574 | 114.0 |
| B | 0 | 230 | 14670 | 123.62 | 591 | 574 | 114.0 |
| B | 12 | 111 | 13348 | 112.03 | 591 | 574 | 114.0 |
| C | 9 | 221 | 159606 | 1188.77 | 567 | 570 | 133.8 |
| C | 3 | 233 | 93477 | 694.46 | 567 | 570 | 133.8 |
| C | 14 | 238 | 89559 | 665.18 | 567 | 570 | 133.8 |
| D | 1 | 52 | 77362 | 548.69 | 572 | 555 | 140.0 |
| D | 12 | 218 | 48021 | 339.09 | 572 | 555 | 140.0 |
| D | 7 | 238 | 39578 | 278.77 | 572 | 555 | 140.0 |
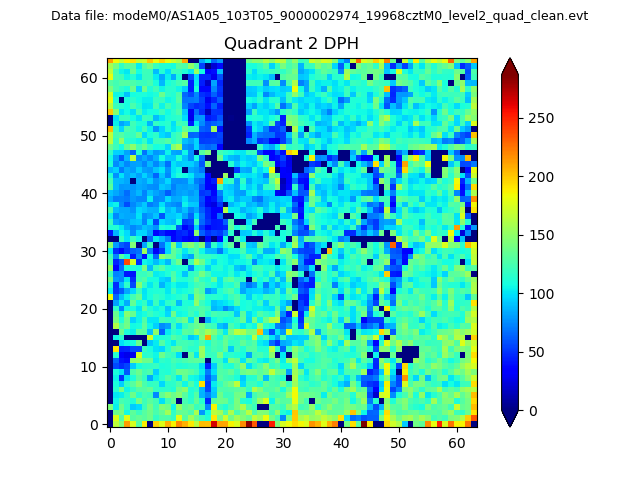
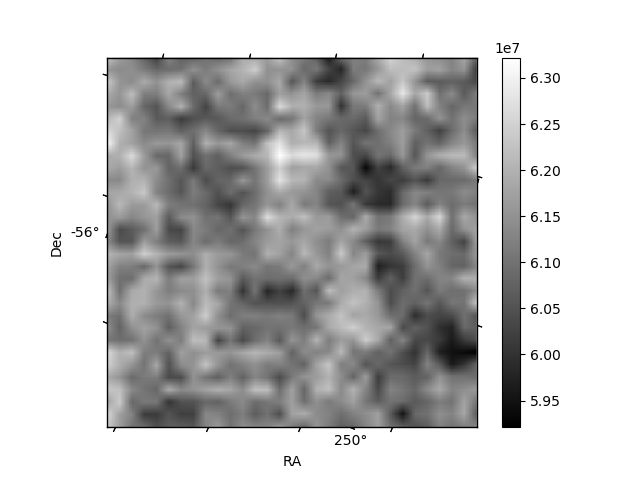
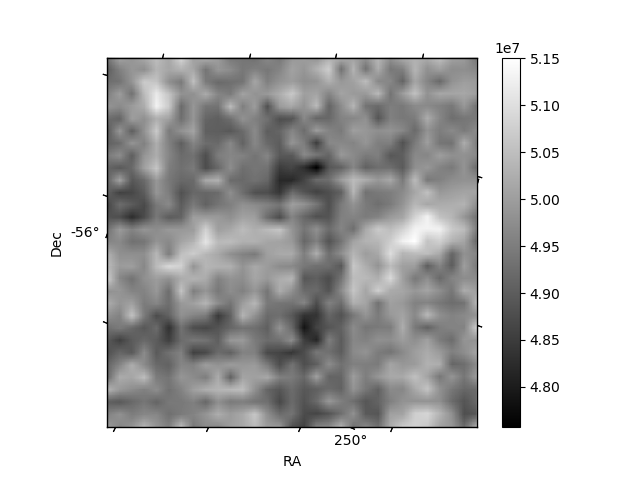
Histogram calculated using DETX and DETY for each event in the final _common_clean file
| Quadrant A | 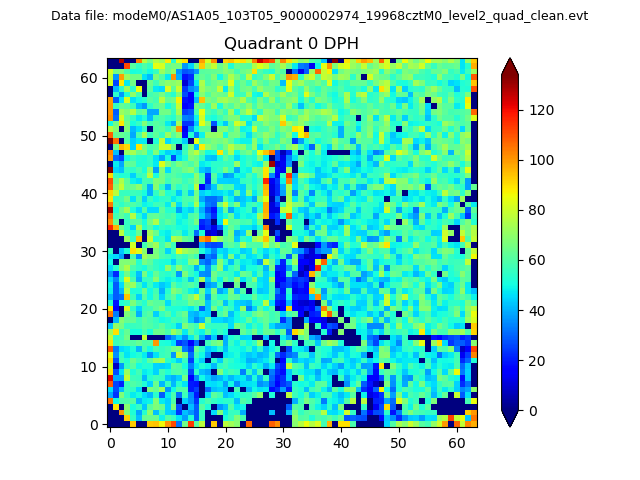 |
 |
Quadrant B |
|---|---|---|---|
| Quadrant D | 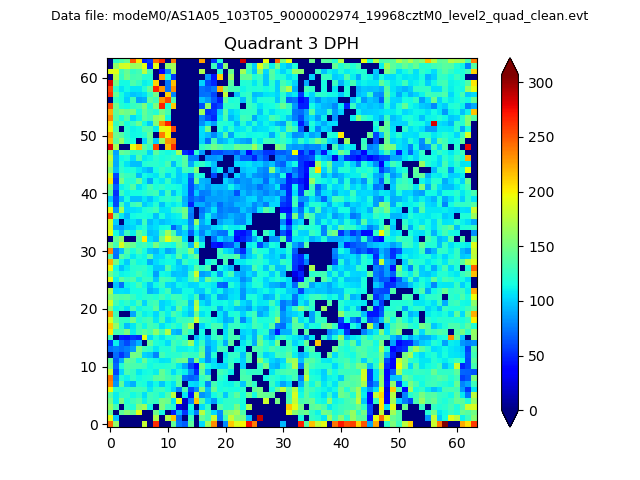 |
 |
Quadrant C |
| Plot type | Count rate plots | Images |
|---|---|---|
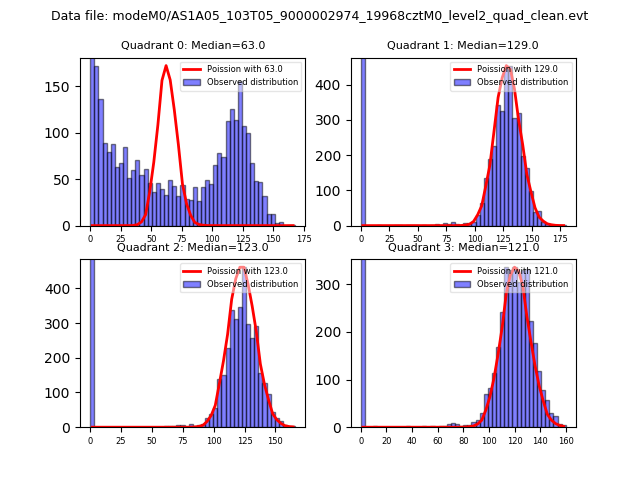
| Comparison with Poisson distribution Blue bars denote a histogram of data divided into 1 sec bins. Red curve is a Poisson curve with rate = median count rate of data. |
 |
 |
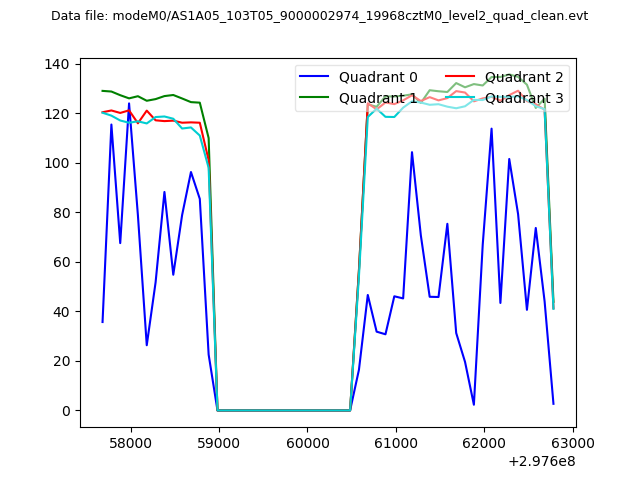
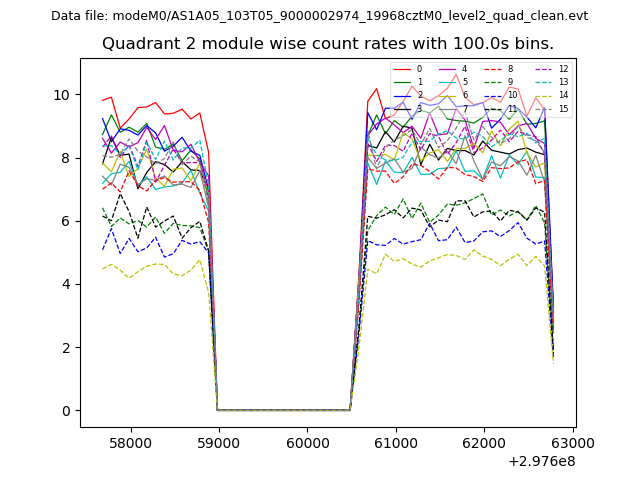
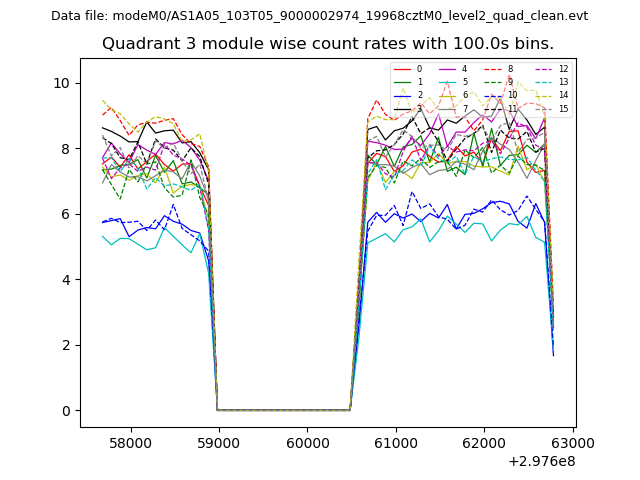
| Quadrant-wise count rates Data is divided into 100 sec bins |
 |
|
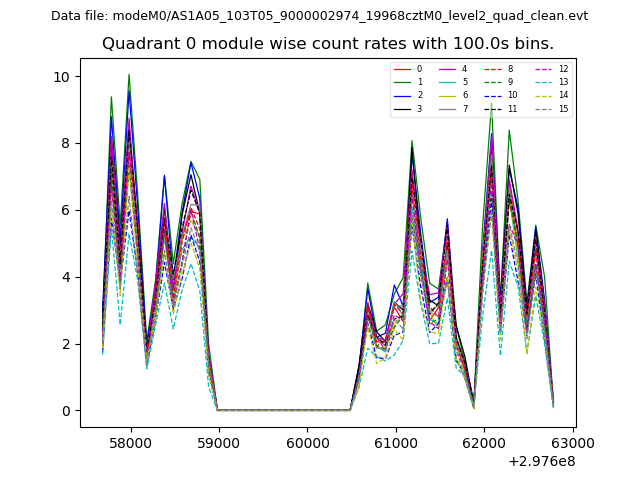
| Module-wise count rates for Quadrant A Data is divided into 100 sec bins |
 |
 |
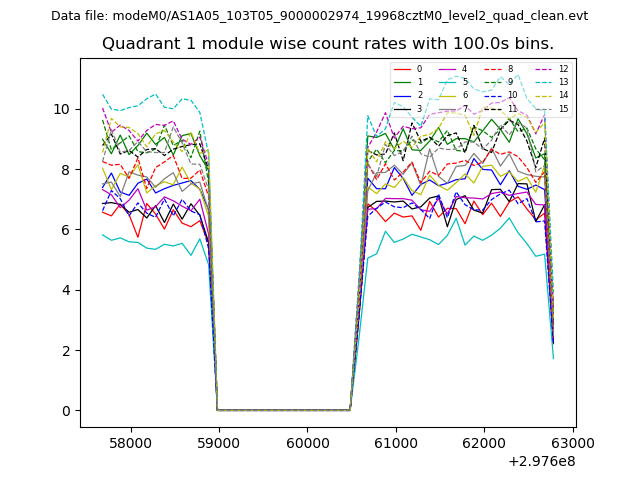
| Module-wise count rates for Quadrant B Data is divided into 100 sec bins |
 |
 |
| Module-wise count rates for Quadrant C Data is divided into 100 sec bins |
 |
 |
| Module-wise count rates for Quadrant D Data is divided into 100 sec bins |
 |
 |
| Parameter | Plot |
|---|---|
| CZT HV Monitor | 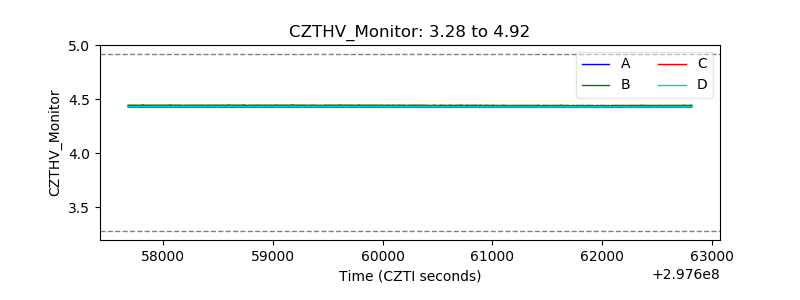 |
| D_VDD | 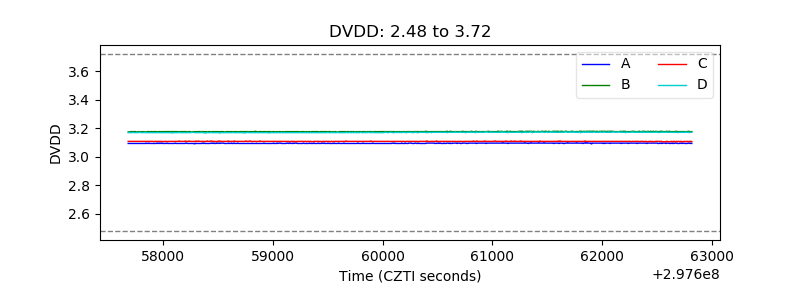 |
| Temperature 1 |  |
| Veto HV Monitor | 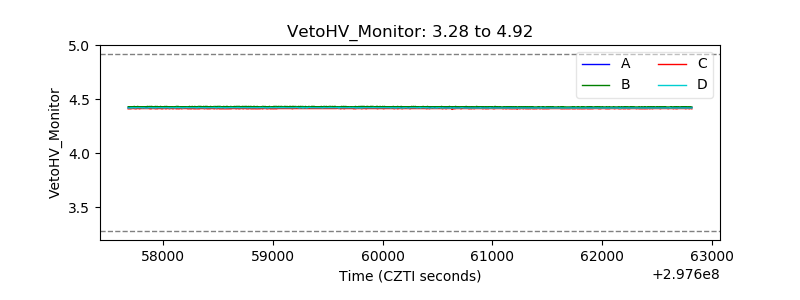 |
| Veto LLD | 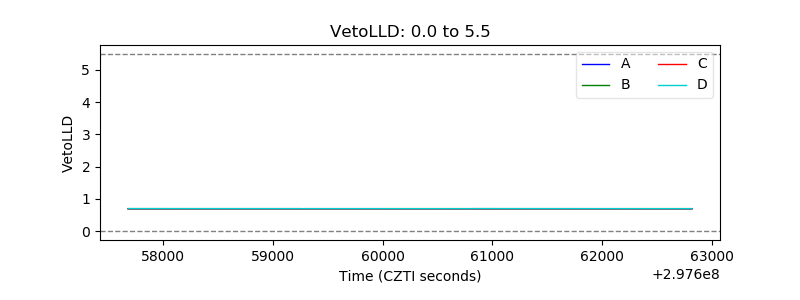 |
| Alpha Counter | 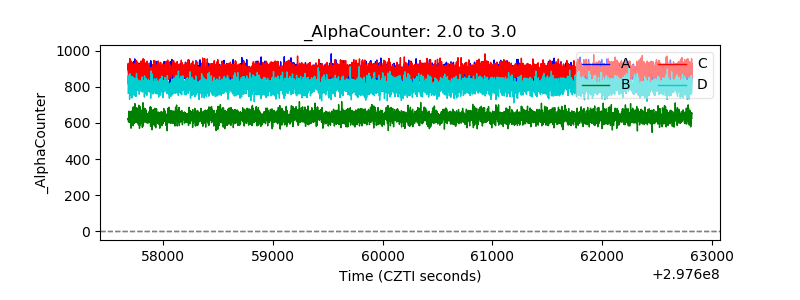 |
| _CPM_Rate | 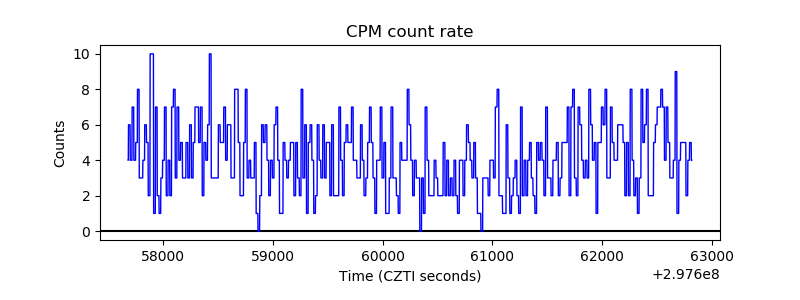 |
| CZT Counter | 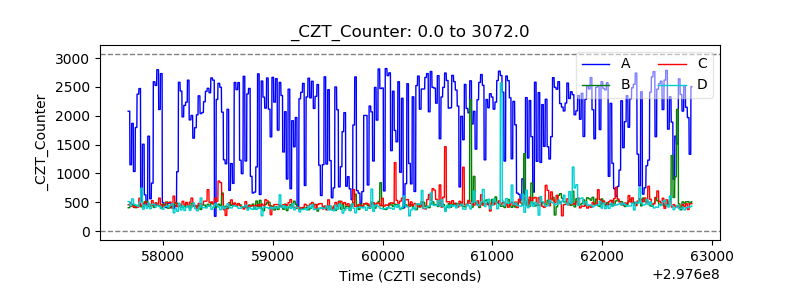 |
| +2.5 Volts monitor |  |
| +5 Volts monitor |  |
| _ROLL_ROT | 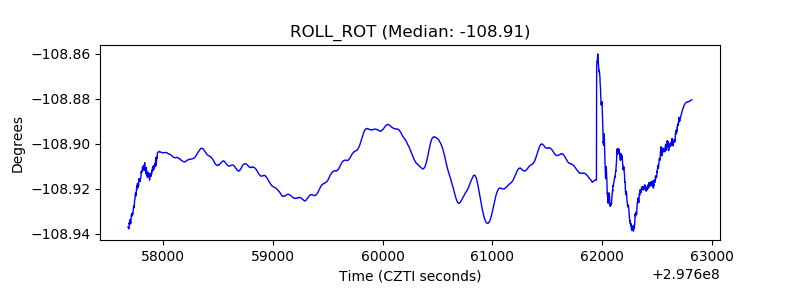 |
| _Roll_DEC | 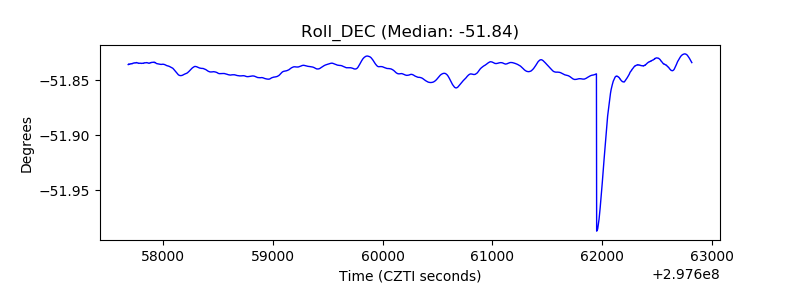 |
| _Roll_RA | 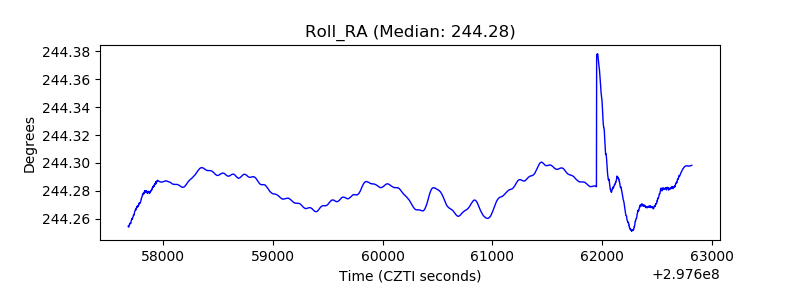 |
| Veto Counter | 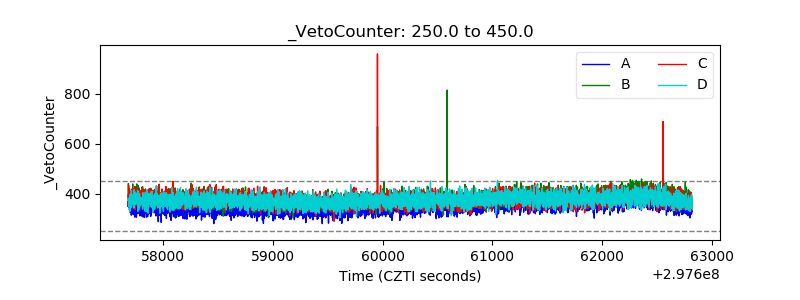 |