| Param | Original file | Final file |
|---|---|---|
| Filename | modeM0/AS1T03_036T01_9000002972cztM0_level2.fits | modeM0/AS1T03_036T01_9000002972cztM0_level2_quad_clean.evt |
| Size (bytes) | 129,369,600 | 62,850,240 |
| Size | 123.4 MB | 59.9 MB |
| Events in quadrant A | 805,652 | 296,120 |
| Events in quadrant B | 796,102 | 288,503 |
| Events in quadrant C | 797,098 | 263,992 |
| Events in quadrant D | 686,108 | 220,986 |
| Mode M0 | |||
|---|---|---|---|
| Quadrant | BADHDUFLAG | Total packets | Discarded packets |
| A | 0 | 33975 | 0 |
| B | 0 | 29772 | 0 |
| C | 0 | 35080 | 0 |
| D | 0 | 37105 | 0 |
| Mode SS | |||
|---|---|---|---|
| Quadrant | BADHDUFLAG | Total packets | Discarded packets |
| A | 0 | 246 | 0 |
| B | 0 | 246 | 0 |
| C | 0 | 246 | 0 |
| D | 0 | 246 | 0 |
| Mode M9 | |||
|---|---|---|---|
| Quadrant | BADHDUFLAG | Total packets | Discarded packets |
| A | 0 | 39 | 0 |
| B | 0 | 39 | 0 |
| C | 0 | 39 | 0 |
| D | 0 | 39 | 0 |
| Quadrant | Total seconds | Saturated seconds | Saturation percentage |
|---|---|---|---|
| A | 12034 | 1317 | 10.943992% |
| B | 12034 | 446 | 3.706166% |
| C | 12034 | 598 | 4.969254% |
| D | 12034 | 1330 | 11.052019% |
Noise dominated data is calculated using 1-second bins in cleaned event files. If a bin has >2000 counts, and if more than 50% of those come from <1% of pixels, then it is considered to be noise-dominated and hence unusable.
| Quadrant | # 1 sec bins | Bins with >0 counts | Bins with >2000 counts | High rate bins dominated by noise | Noise dominated (total time) | Noise dominated (detector-on time) | Marked lightcurve |
|---|---|---|---|---|---|---|---|
| A | 15909 | 11972 | 0 | 0 | 0.00% | 0.00% |  |
| B | 15909 | 12030 | 0 | 0 | 0.00% | 0.00% |  |
| C | 15909 | 12031 | 0 | 0 | 0.00% | 0.00% |  |
| D | 15908 | 12030 | 0 | 0 | 0.00% | 0.00% |  |
Top three noisy pixels from each quadrant. If the there are fewer than three noisy pixels in the level2.evt file, extra rows are filled as -1
| Pixel properties | Quadrant properties | ||||||
|---|---|---|---|---|---|---|---|
| Quadrant | DetID | PixID | Counts | Sigma | Mean | Median | Sigma |
| A | 0 | 29 | 755 | 10.68 | 210 | 199 | 52.1 |
| A | 0 | 30 | 621 | 8.11 | 210 | 199 | 52.1 |
| A | 9 | 19 | 617 | 8.03 | 210 | 199 | 52.1 |
| B | 2 | 9 | 605 | 9.31 | 210 | 202 | 43.3 |
| B | 5 | 128 | 542 | 7.85 | 210 | 202 | 43.3 |
| B | 3 | 17 | 531 | 7.6 | 210 | 202 | 43.3 |
| C | 3 | 202 | 604 | 7.34 | 210 | 198 | 55.3 |
| C | 1 | 81 | 598 | 7.23 | 210 | 198 | 55.3 |
| C | 1 | 80 | 584 | 6.98 | 210 | 198 | 55.3 |
| D | 6 | 83 | 490 | 5.89 | 196 | 180 | 52.6 |
| D | 3 | 14 | 485 | 5.79 | 196 | 180 | 52.6 |
| D | 7 | 3 | 484 | 5.78 | 196 | 180 | 52.6 |
Histogram calculated using DETX and DETY for each event in the final _common_clean file
| Quadrant A | 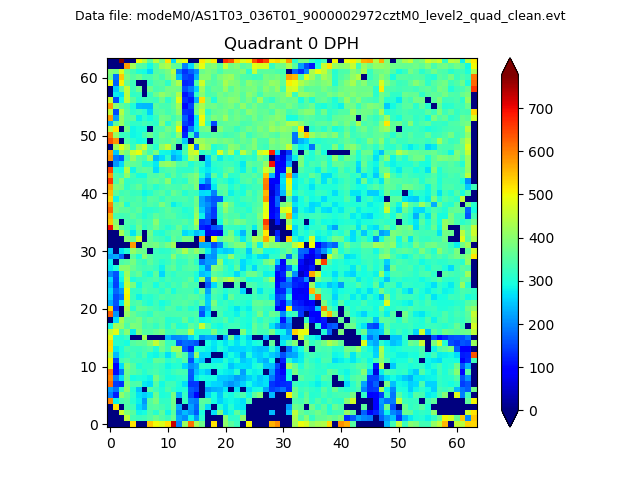 |
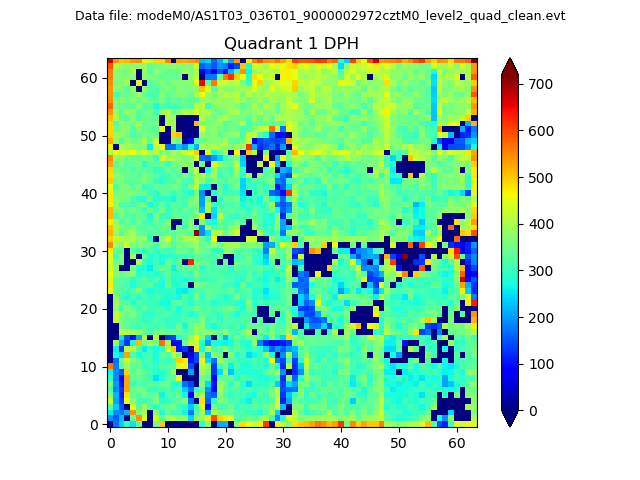 |
Quadrant B |
|---|---|---|---|
| Quadrant D |  |
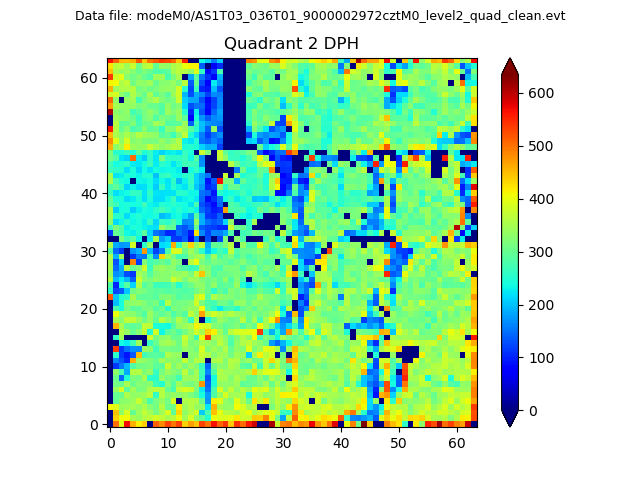 |
Quadrant C |
| Plot type | Count rate plots | Images |
|---|---|---|
| Comparison with Poisson distribution Blue bars denote a histogram of data divided into 1 sec bins. Red curve is a Poisson curve with rate = median count rate of data. |
 |
 |
| Quadrant-wise count rates Data is divided into 100 sec bins |
 |
|
| Module-wise count rates for Quadrant A Data is divided into 100 sec bins |
 |
 |
| Module-wise count rates for Quadrant B Data is divided into 100 sec bins |
 |
 |
| Module-wise count rates for Quadrant C Data is divided into 100 sec bins |
 |
 |
| Module-wise count rates for Quadrant D Data is divided into 100 sec bins |
 |
 |
| Parameter | Plot |
|---|---|
| CZT HV Monitor |  |
| D_VDD |  |
| Temperature 1 |  |
| Veto HV Monitor |  |
| Veto LLD | 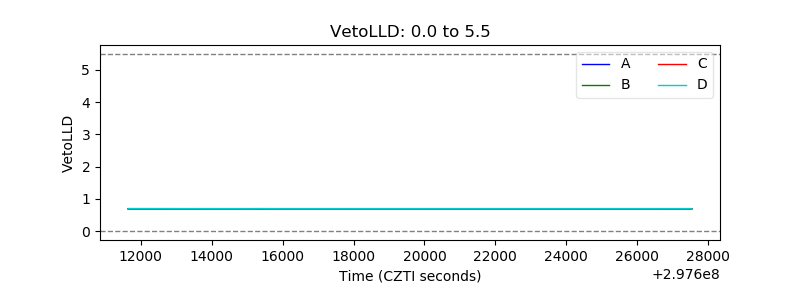 |
| Alpha Counter |  |
| _CPM_Rate | 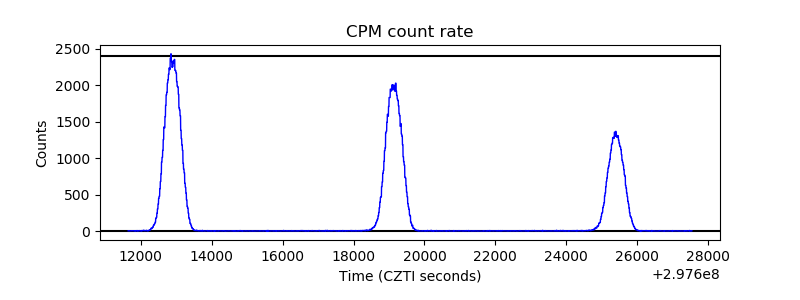 |
| CZT Counter |  |
| +2.5 Volts monitor |  |
| +5 Volts monitor |  |
| _ROLL_ROT |  |
| _Roll_DEC |  |
| _Roll_RA |  |
| Veto Counter |  |