| Param | Original file | Final file |
|---|---|---|
| Filename | modeM0/AS1T03_036T01_9000002972_19959cztM0_level2.evt | modeM0/AS1T03_036T01_9000002972_19959cztM0_level2_quad_clean.evt |
| Size (bytes) | 259,493,760 | 40,498,560 |
| Size | 247.5 MB | 38.6 MB |
| Events in quadrant A | 2,867,104 | 245,506 |
| Events in quadrant B | 1,542,735 | 290,269 |
| Events in quadrant C | 1,642,171 | 266,520 |
| Events in quadrant D | 1,653,172 | 262,079 |
| Mode M0 | |||
|---|---|---|---|
| Quadrant | BADHDUFLAG | Total packets | Discarded packets |
| A | 0 | 10038 | 1 |
| B | 0 | 6202 | 1 |
| C | 0 | 6584 | 1 |
| D | 0 | 6477 | 1 |
| Mode SS | |||
|---|---|---|---|
| Quadrant | BADHDUFLAG | Total packets | Discarded packets |
| A | 0 | 46 | 0 |
| B | 0 | 46 | 0 |
| C | 0 | 46 | 0 |
| D | 0 | 46 | 0 |
| Mode M9 | |||
|---|---|---|---|
| Quadrant | BADHDUFLAG | Total packets | Discarded packets |
| A | 0 | 13 | 0 |
| B | 0 | 13 | 0 |
| C | 0 | 13 | 0 |
| D | 0 | 13 | 0 |
| Quadrant | Total seconds | Saturated seconds | Saturation percentage |
|---|---|---|---|
| A | 2240 | 809 | 36.116071% |
| B | 2240 | 139 | 6.205357% |
| C | 2240 | 137 | 6.116071% |
| D | 2240 | 175 | 7.812500% |
Noise dominated data is calculated using 1-second bins in cleaned event files. If a bin has >2000 counts, and if more than 50% of those come from <1% of pixels, then it is considered to be noise-dominated and hence unusable.
| Quadrant | # 1 sec bins | Bins with >0 counts | Bins with >2000 counts | High rate bins dominated by noise | Noise dominated (total time) | Noise dominated (detector-on time) | Marked lightcurve |
|---|---|---|---|---|---|---|---|
| A | 3500 | 2240 | 616 | 616 | 17.60% | 27.50% | 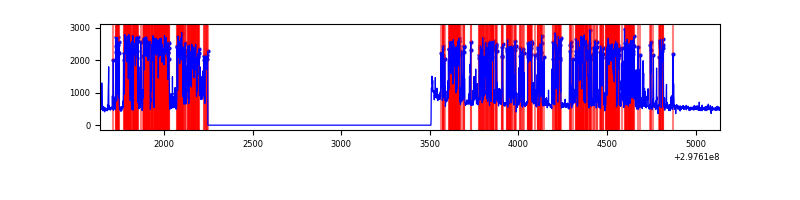 |
| B | 3500 | 2240 | 36 | 36 | 1.03% | 1.61% |  |
| C | 3500 | 2240 | 2 | 2 | 0.06% | 0.09% | 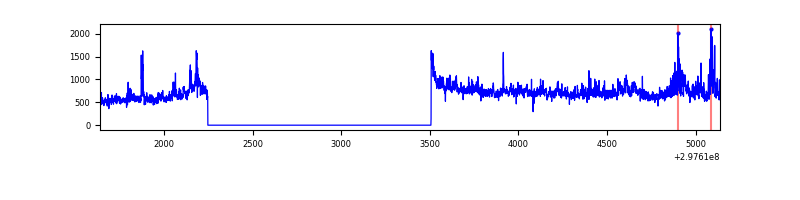 |
| D | 3500 | 2240 | 110 | 110 | 3.14% | 4.91% | 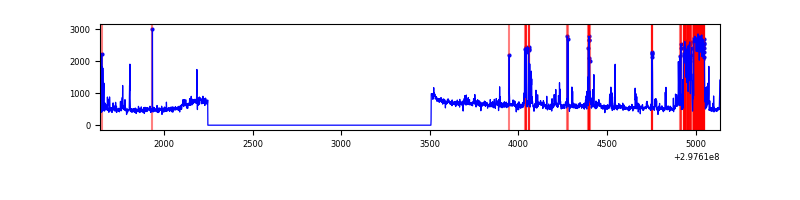 |
Top three noisy pixels from each quadrant. If the there are fewer than three noisy pixels in the level2.evt file, extra rows are filled as -1
| Pixel properties | Quadrant properties | ||||||
|---|---|---|---|---|---|---|---|
| Quadrant | DetID | PixID | Counts | Sigma | Mean | Median | Sigma |
| A | 14 | 238 | 1797580 | 32324.1 | 272 | 267 | 55.6 |
| A | 14 | 254 | 8872 | 154.76 | 272 | 267 | 55.6 |
| A | 5 | 16 | 8804 | 153.54 | 272 | 267 | 55.6 |
| B | 7 | 220 | 206158 | 3206.76 | 331 | 324 | 64.2 |
| B | 4 | 171 | 11609 | 175.81 | 331 | 324 | 64.2 |
| B | 0 | 198 | 9428 | 141.83 | 331 | 324 | 64.2 |
| C | 3 | 233 | 313516 | 4196.25 | 318 | 321 | 74.6 |
| C | 14 | 238 | 50245 | 668.89 | 318 | 321 | 74.6 |
| C | 9 | 221 | 28091 | 372.07 | 318 | 321 | 74.6 |
| D | 9 | 1 | 229588 | 2845.18 | 328 | 319 | 80.6 |
| D | 12 | 218 | 93414 | 1155.29 | 328 | 319 | 80.6 |
| D | 12 | 233 | 42120 | 518.74 | 328 | 319 | 80.6 |
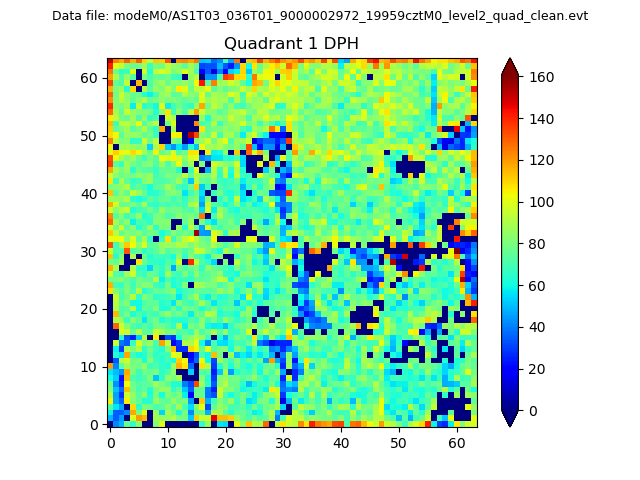
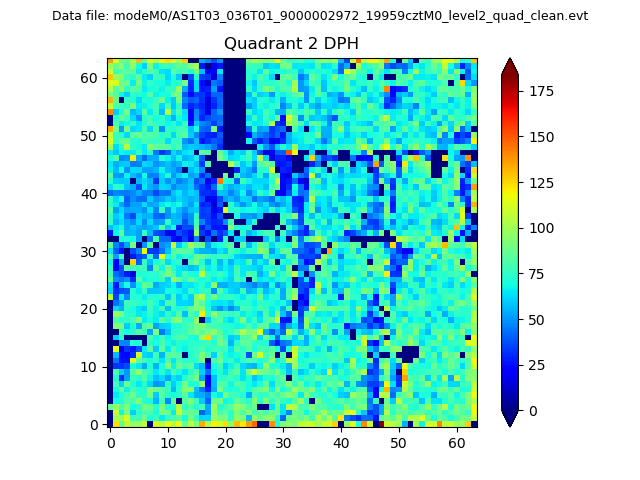
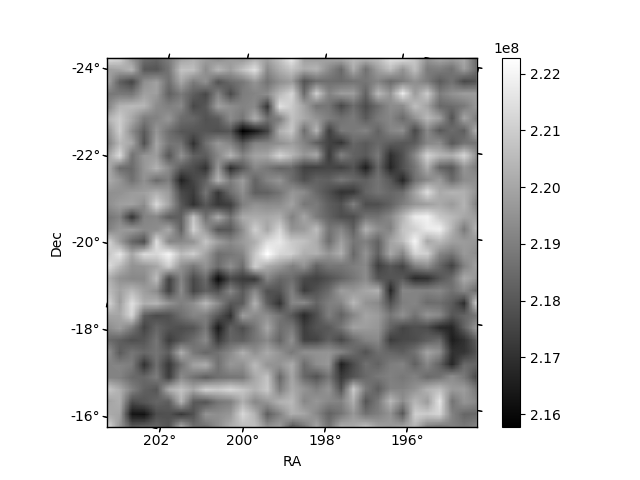
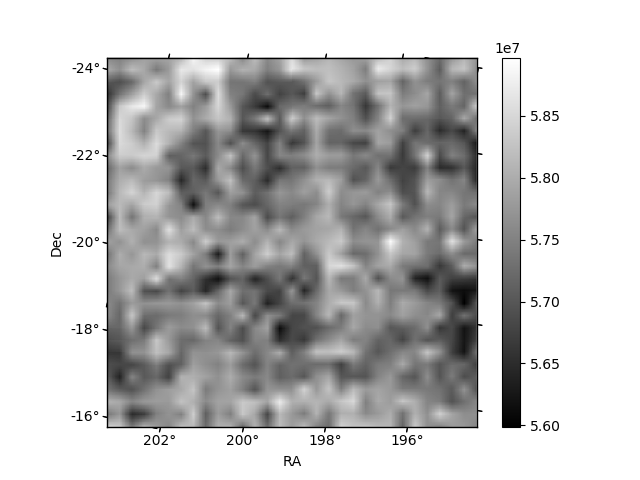
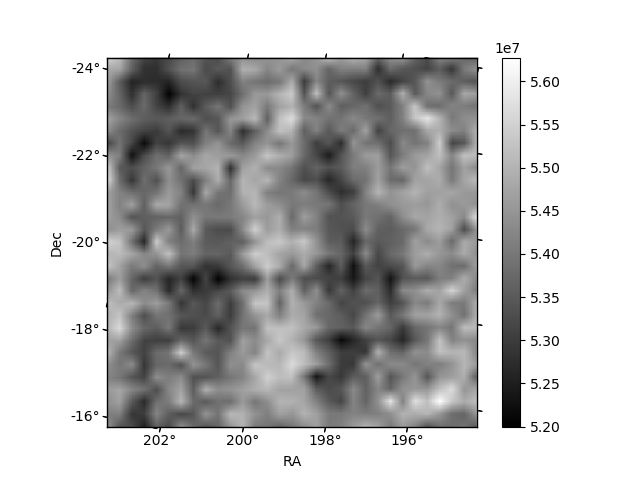
Histogram calculated using DETX and DETY for each event in the final _common_clean file
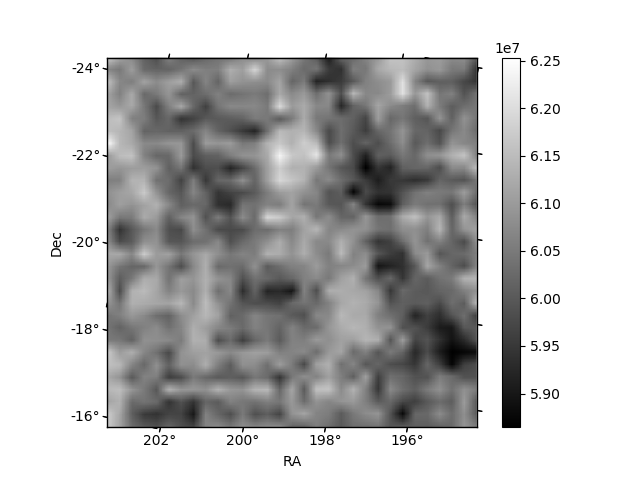
| Quadrant A | 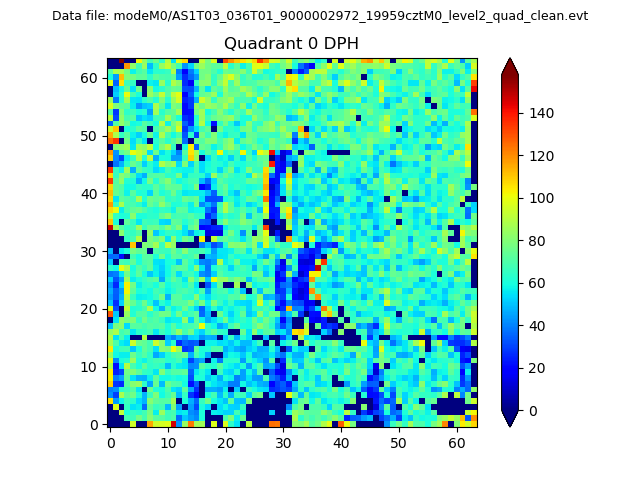 |
 |
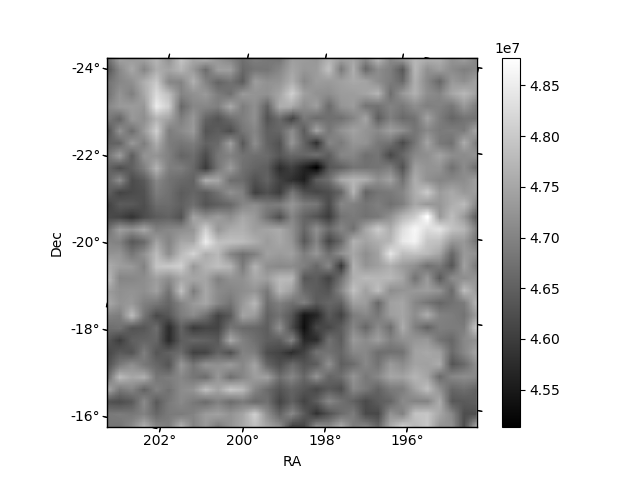
Quadrant B |
|---|---|---|---|
| Quadrant D | 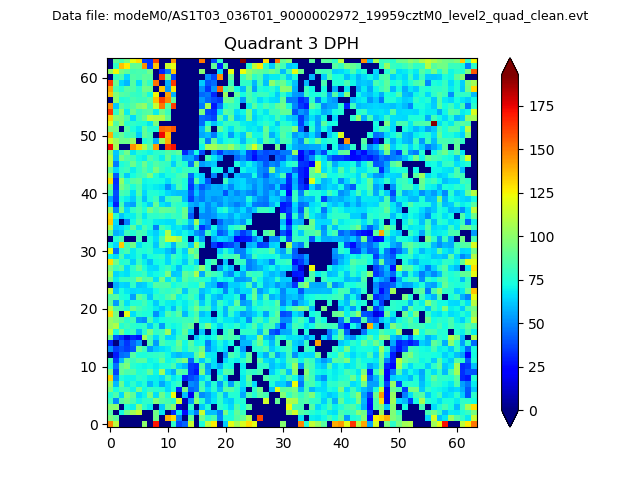 |
 |
Quadrant C |
| Plot type | Count rate plots | Images |
|---|---|---|
| Comparison with Poisson distribution Blue bars denote a histogram of data divided into 1 sec bins. Red curve is a Poisson curve with rate = median count rate of data. |
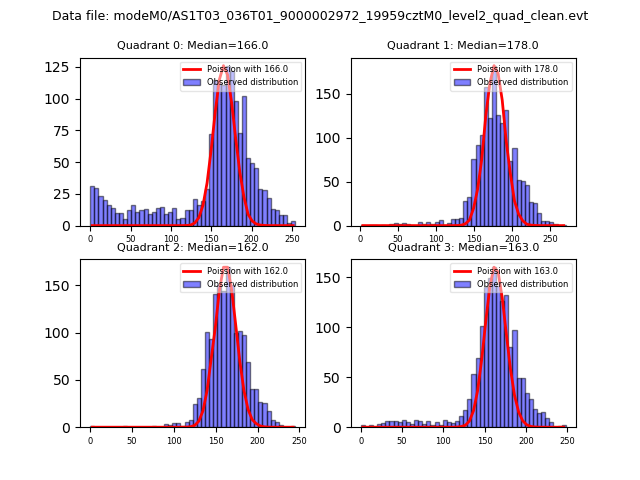 |
 |
| Quadrant-wise count rates Data is divided into 100 sec bins |
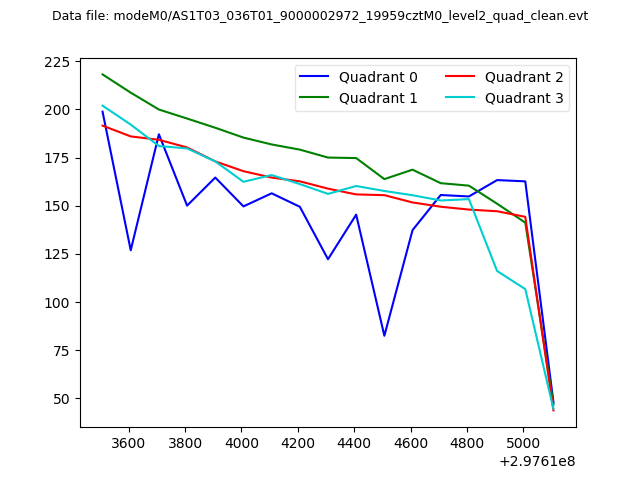 |
|
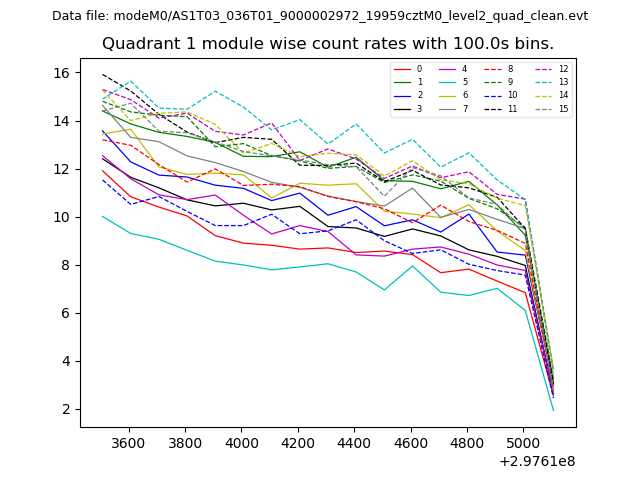
| Module-wise count rates for Quadrant A Data is divided into 100 sec bins |
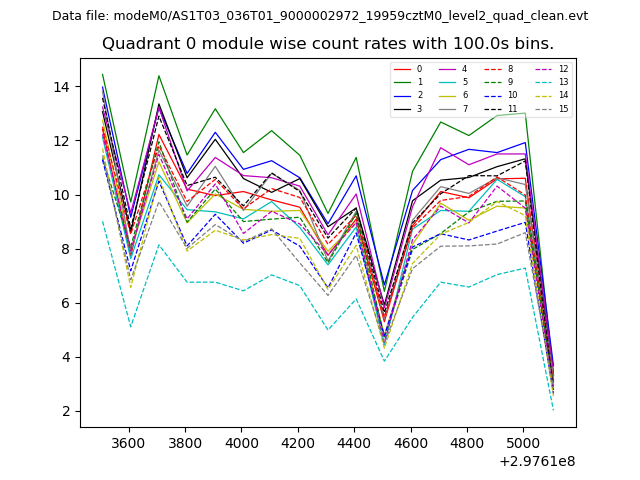 |
 |
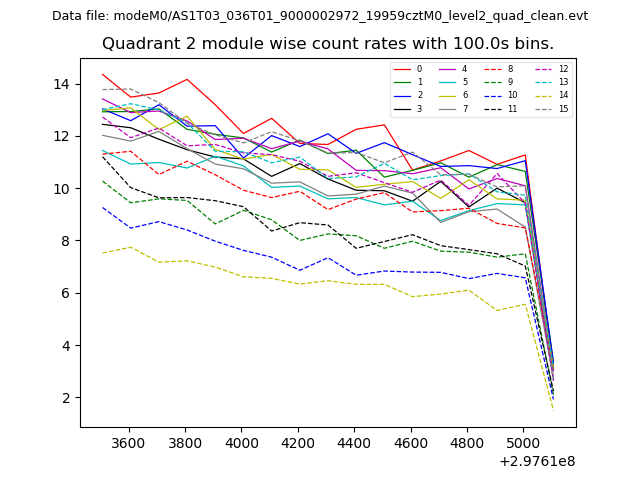
| Module-wise count rates for Quadrant B Data is divided into 100 sec bins |
 |
 |
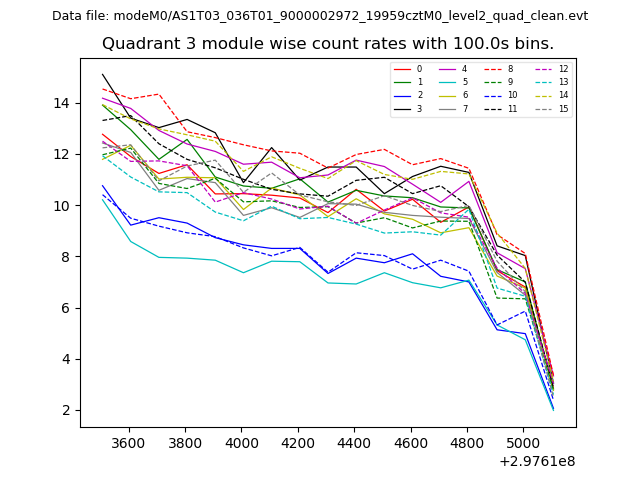
| Module-wise count rates for Quadrant C Data is divided into 100 sec bins |
 |
 |
| Module-wise count rates for Quadrant D Data is divided into 100 sec bins |
 |
 |
| Parameter | Plot |
|---|---|
| CZT HV Monitor | 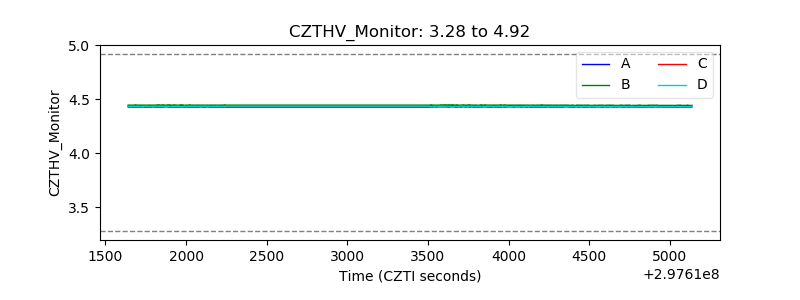 |
| D_VDD |  |
| Temperature 1 | 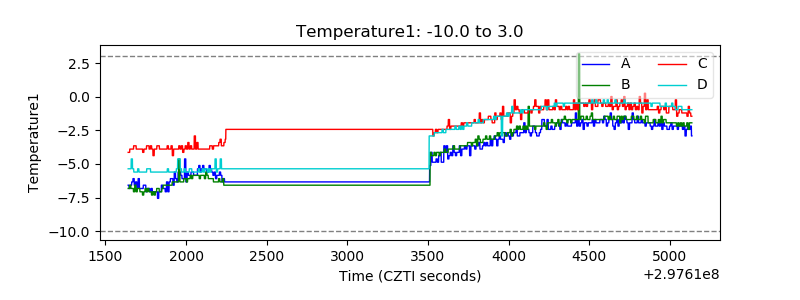 |
| Veto HV Monitor | 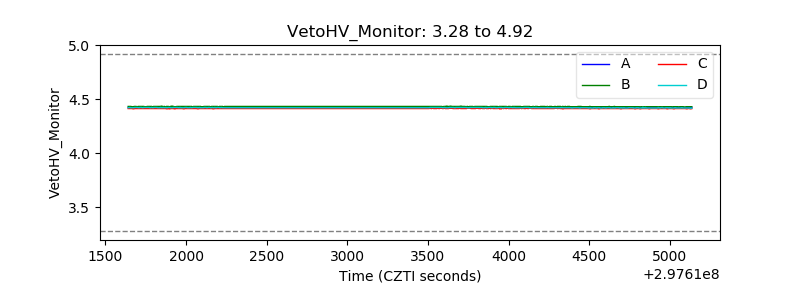 |
| Veto LLD | 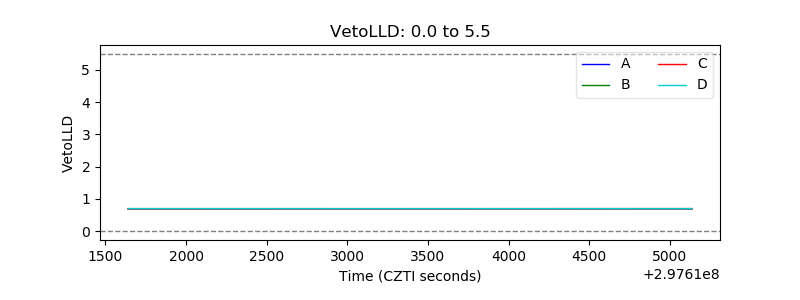 |
| Alpha Counter | 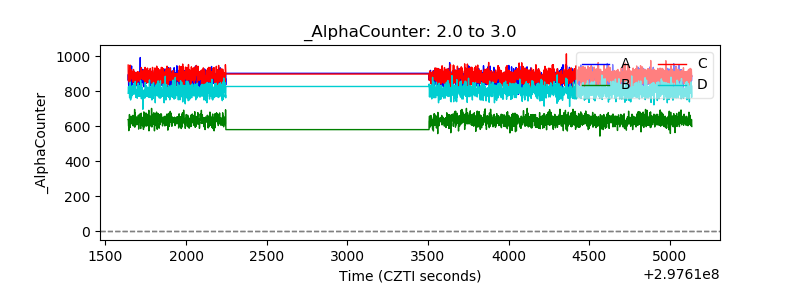 |
| _CPM_Rate | 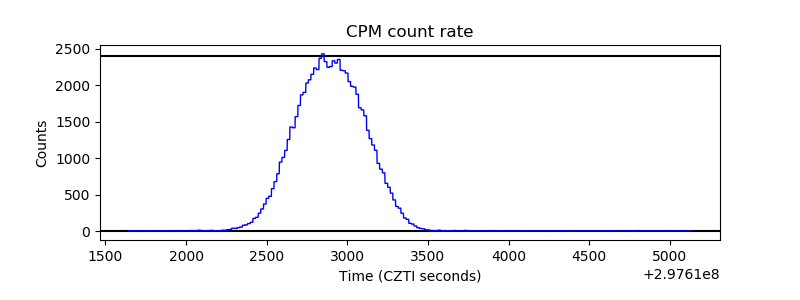 |
| CZT Counter | 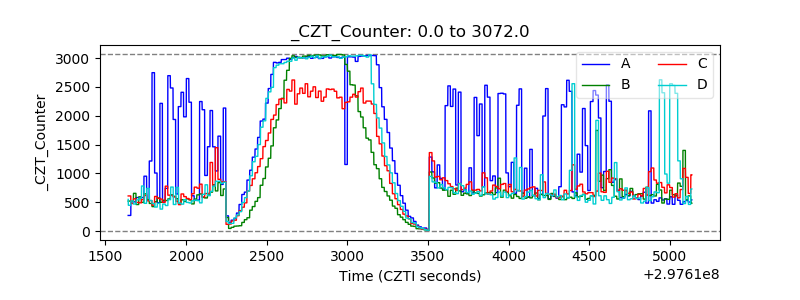 |
| +2.5 Volts monitor |  |
| +5 Volts monitor |  |
| _ROLL_ROT | 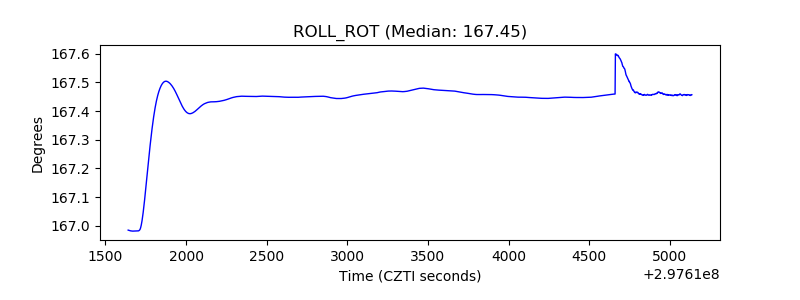 |
| _Roll_DEC | 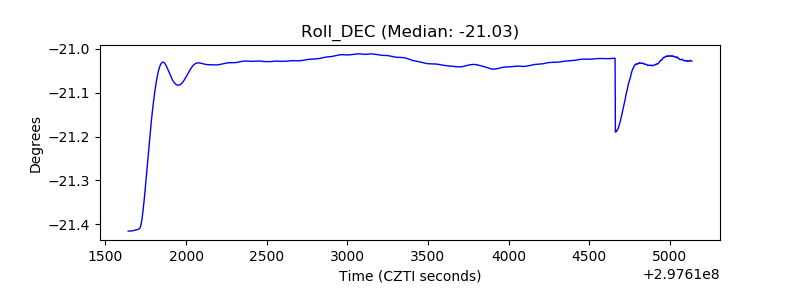 |
| _Roll_RA | 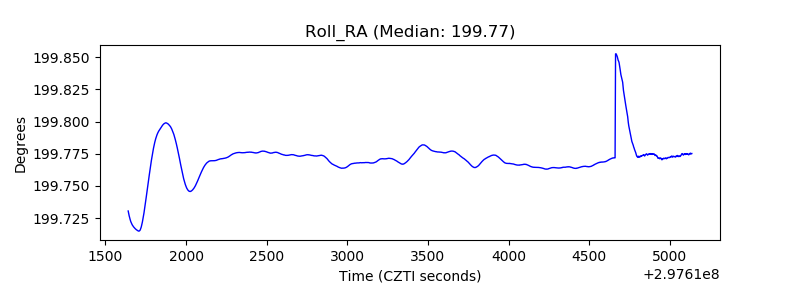 |
| Veto Counter | 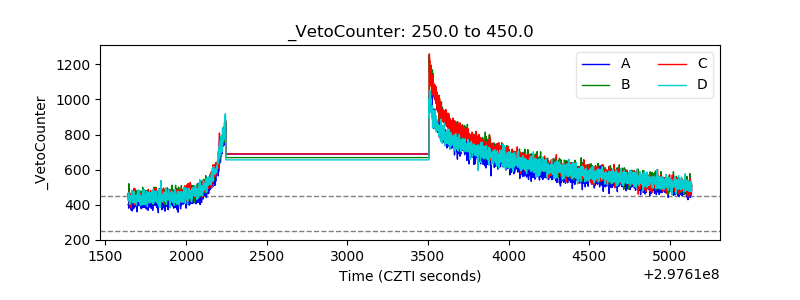 |