| Param | Original file | Final file |
|---|---|---|
| Filename | modeM0/AS1T03_036T01_9000002972_19960cztM0_level2.evt | modeM0/AS1T03_036T01_9000002972_19960cztM0_level2_quad_clean.evt |
| Size (bytes) | 600,079,680 | 101,977,920 |
| Size | 572.3 MB | 97.3 MB |
| Events in quadrant A | 4,640,941 | 687,088 |
| Events in quadrant B | 3,840,755 | 699,827 |
| Events in quadrant C | 4,727,193 | 649,298 |
| Events in quadrant D | 4,562,356 | 636,672 |
| Mode M0 | |||
|---|---|---|---|
| Quadrant | BADHDUFLAG | Total packets | Discarded packets |
| A | 0 | 17562 | 2 |
| B | 0 | 15323 | 1 |
| C | 0 | 18482 | 1 |
| D | 0 | 17517 | 1 |
| Mode SS | |||
|---|---|---|---|
| Quadrant | BADHDUFLAG | Total packets | Discarded packets |
| A | 0 | 122 | 0 |
| B | 0 | 122 | 0 |
| C | 0 | 122 | 0 |
| D | 0 | 122 | 0 |
| Mode M9 | |||
|---|---|---|---|
| Quadrant | BADHDUFLAG | Total packets | Discarded packets |
| A | 0 | 13 | 0 |
| B | 0 | 13 | 0 |
| C | 0 | 13 | 0 |
| D | 0 | 13 | 0 |
| Quadrant | Total seconds | Saturated seconds | Saturation percentage |
|---|---|---|---|
| A | 5939 | 673 | 11.331874% |
| B | 5939 | 258 | 4.344166% |
| C | 5940 | 329 | 5.538721% |
| D | 5940 | 523 | 8.804714% |
Noise dominated data is calculated using 1-second bins in cleaned event files. If a bin has >2000 counts, and if more than 50% of those come from <1% of pixels, then it is considered to be noise-dominated and hence unusable.
| Quadrant | # 1 sec bins | Bins with >0 counts | Bins with >2000 counts | High rate bins dominated by noise | Noise dominated (total time) | Noise dominated (detector-on time) | Marked lightcurve |
|---|---|---|---|---|---|---|---|
| A | 7249 | 5939 | 489 | 489 | 6.75% | 8.23% | 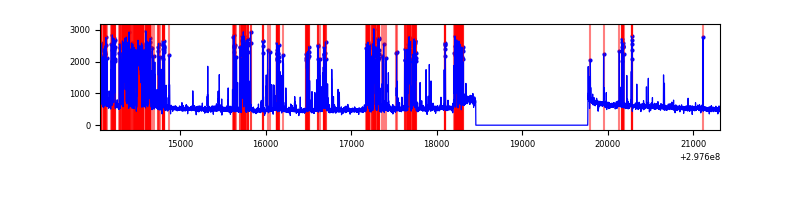 |
| B | 7249 | 5939 | 119 | 119 | 1.64% | 2.00% | 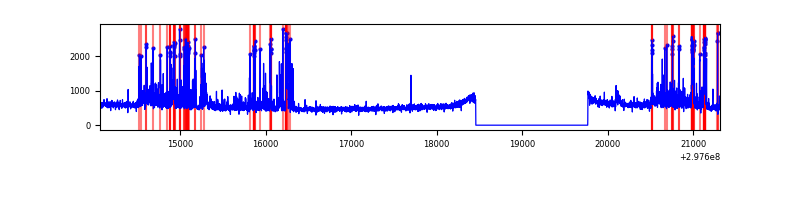 |
| C | 7250 | 5940 | 153 | 153 | 2.11% | 2.58% | 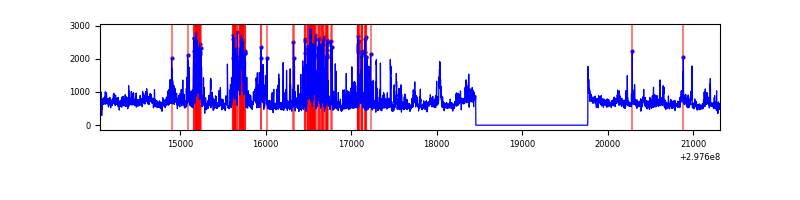 |
| D | 7250 | 5940 | 470 | 470 | 6.48% | 7.91% | 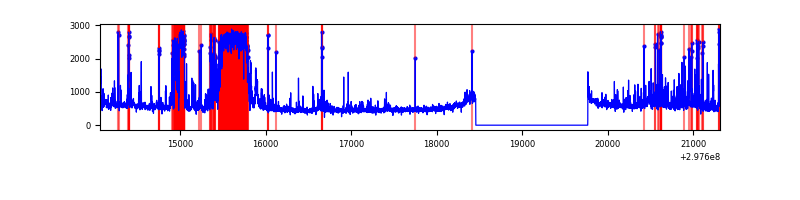 |
Top three noisy pixels from each quadrant. If the there are fewer than three noisy pixels in the level2.evt file, extra rows are filled as -1
| Pixel properties | Quadrant properties | ||||||
|---|---|---|---|---|---|---|---|
| Quadrant | DetID | PixID | Counts | Sigma | Mean | Median | Sigma |
| A | 14 | 238 | 1514184 | 9849.18 | 772 | 759 | 153.7 |
| A | 14 | 254 | 135510 | 876.94 | 772 | 759 | 153.7 |
| A | 11 | 29 | 10576 | 63.89 | 772 | 759 | 153.7 |
| B | 7 | 220 | 612869 | 4162.07 | 784 | 767 | 147.1 |
| B | 0 | 197 | 84192 | 567.26 | 784 | 767 | 147.1 |
| B | 4 | 216 | 19114 | 124.75 | 784 | 767 | 147.1 |
| C | 3 | 233 | 1635063 | 9489.76 | 745 | 752 | 172.2 |
| C | 14 | 238 | 118431 | 683.31 | 745 | 752 | 172.2 |
| C | 9 | 221 | 47133 | 269.31 | 745 | 752 | 172.2 |
| D | 7 | 38 | 798872 | 4315.61 | 762 | 743 | 184.9 |
| D | 12 | 233 | 310081 | 1672.64 | 762 | 743 | 184.9 |
| D | 9 | 1 | 234417 | 1263.51 | 762 | 743 | 184.9 |
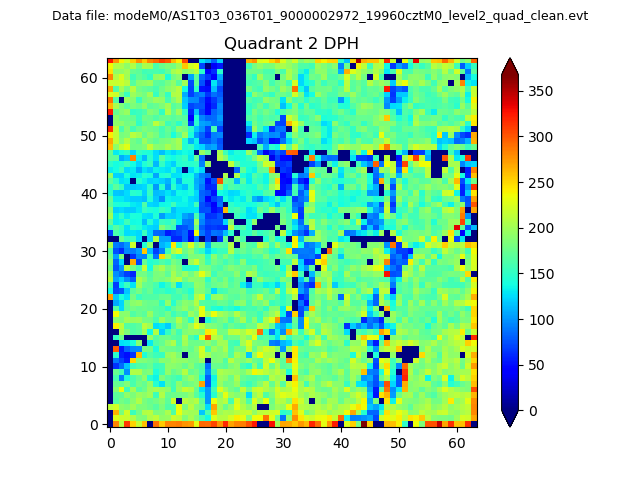
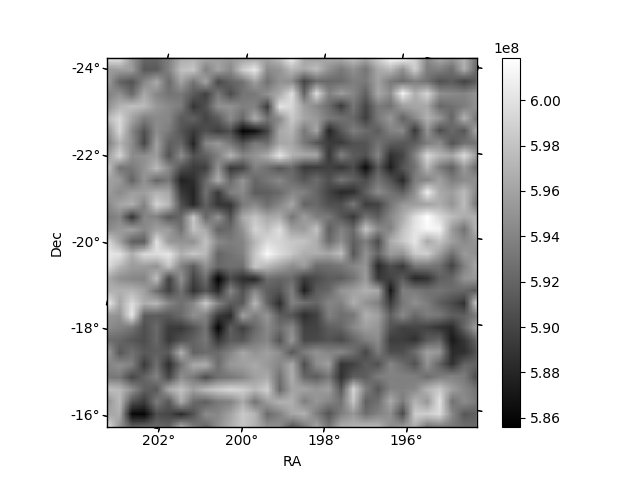
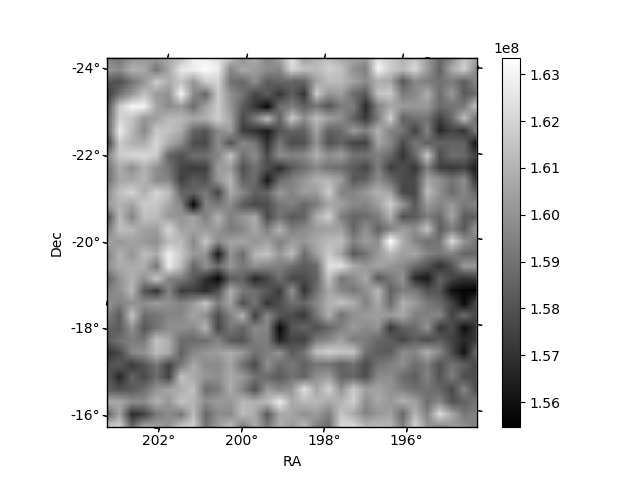
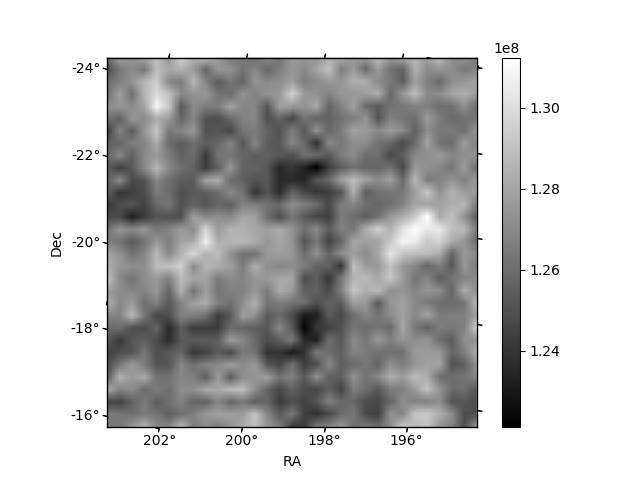
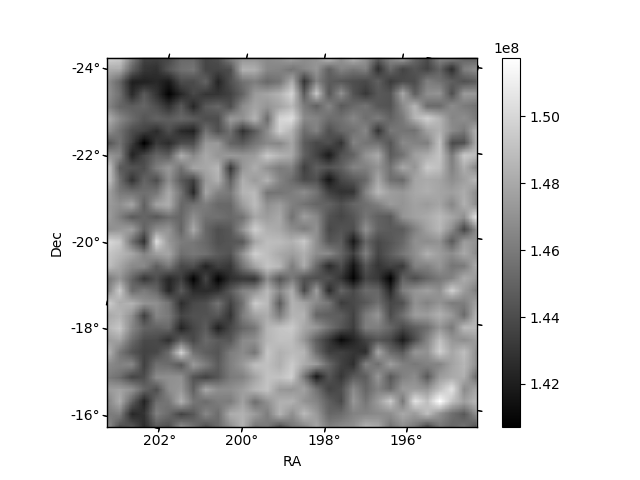
Histogram calculated using DETX and DETY for each event in the final _common_clean file
| Quadrant A | 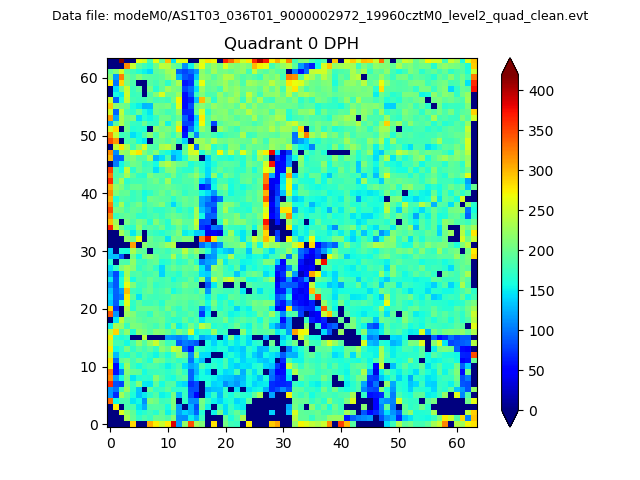 |
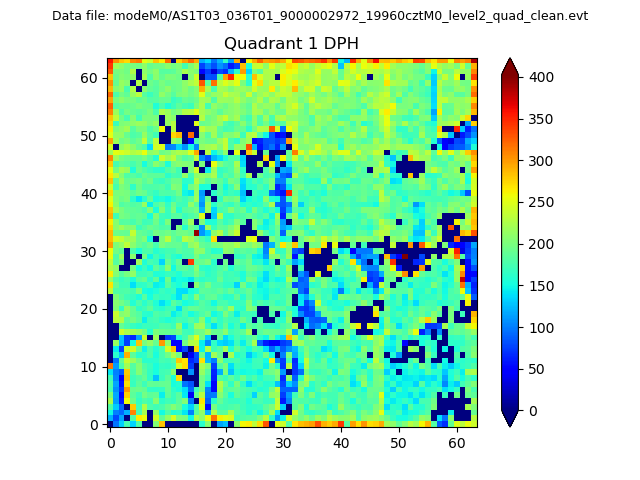 |
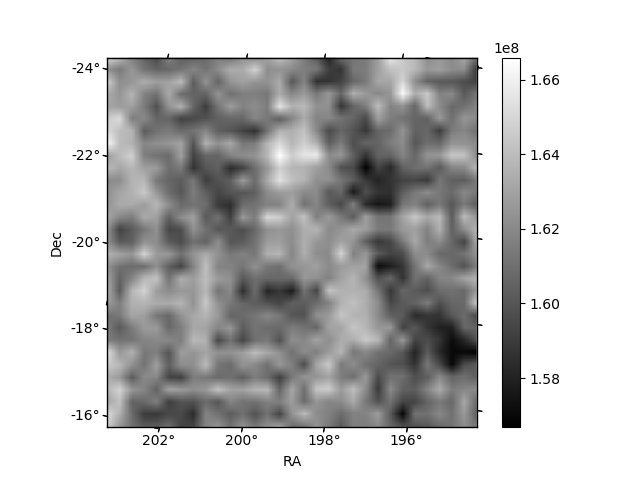
Quadrant B |
|---|---|---|---|
| Quadrant D | 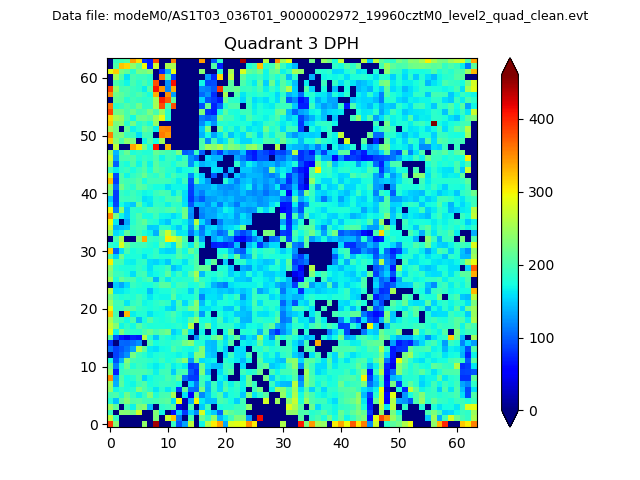 |
 |
Quadrant C |
| Plot type | Count rate plots | Images |
|---|---|---|
| Comparison with Poisson distribution Blue bars denote a histogram of data divided into 1 sec bins. Red curve is a Poisson curve with rate = median count rate of data. |
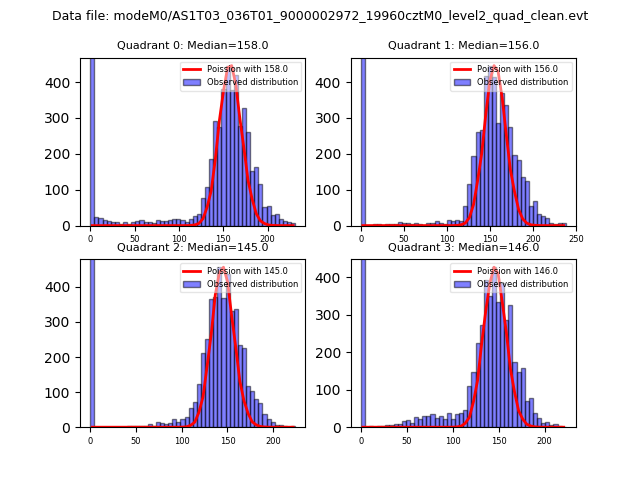 |
 |
| Quadrant-wise count rates Data is divided into 100 sec bins |
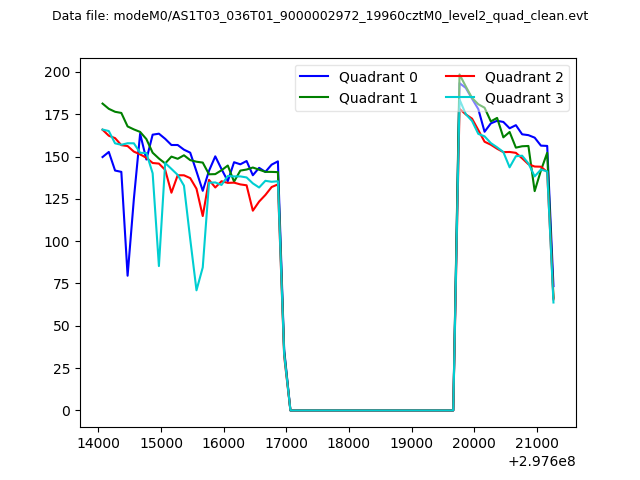 |
|
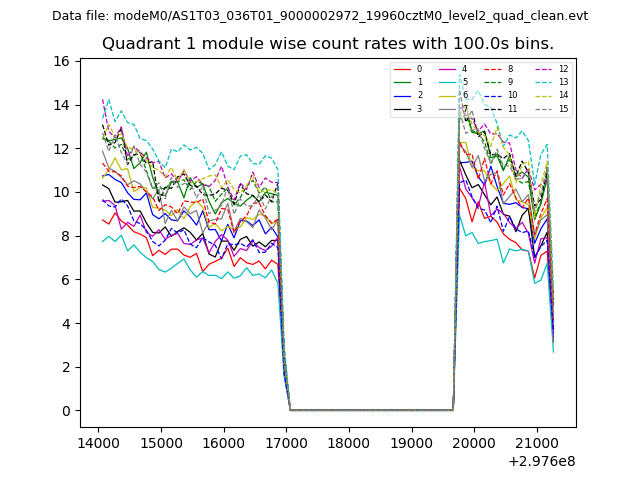
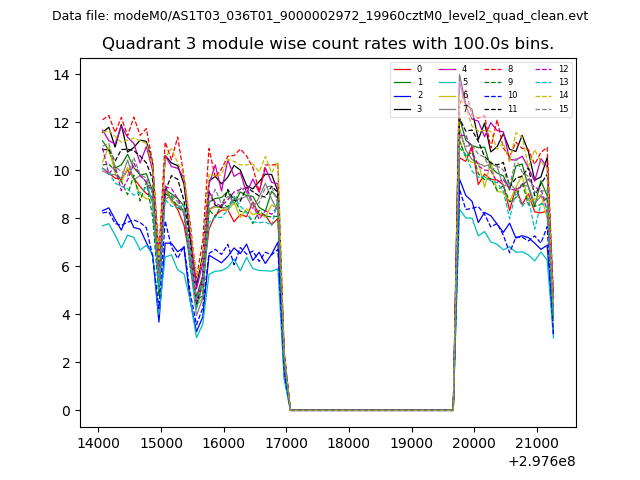
| Module-wise count rates for Quadrant A Data is divided into 100 sec bins |
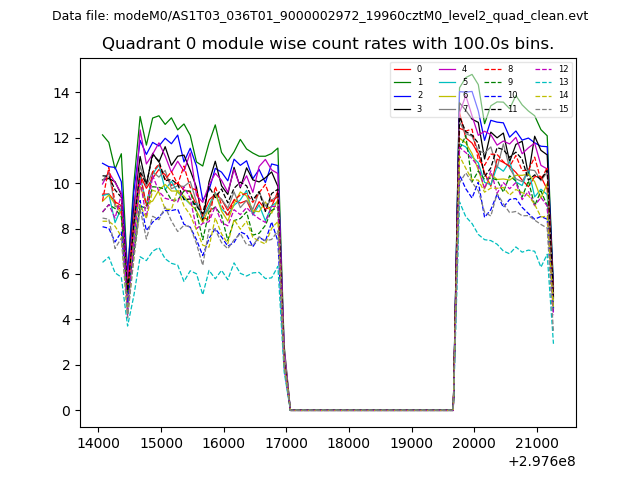 |
 |
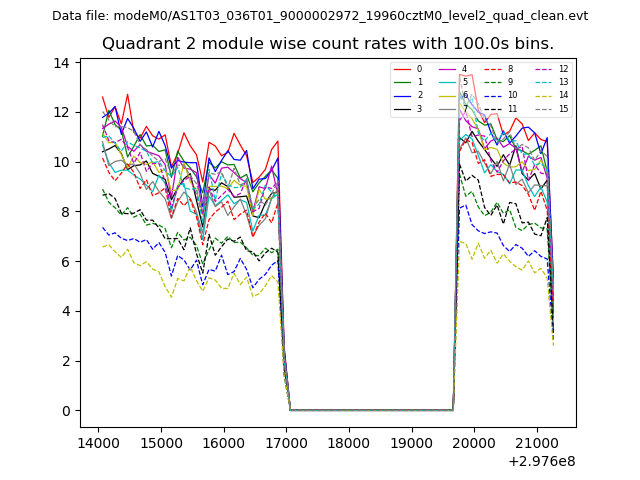
| Module-wise count rates for Quadrant B Data is divided into 100 sec bins |
 |
 |
| Module-wise count rates for Quadrant C Data is divided into 100 sec bins |
 |
 |
| Module-wise count rates for Quadrant D Data is divided into 100 sec bins |
 |
 |
| Parameter | Plot |
|---|---|
| CZT HV Monitor | 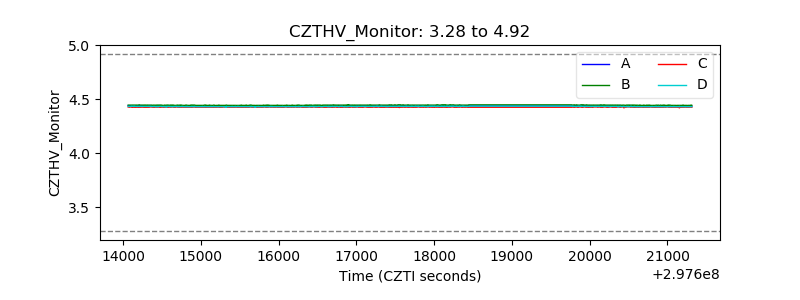 |
| D_VDD | 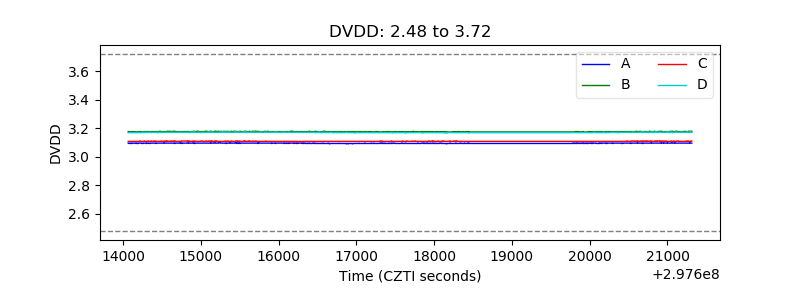 |
| Temperature 1 | 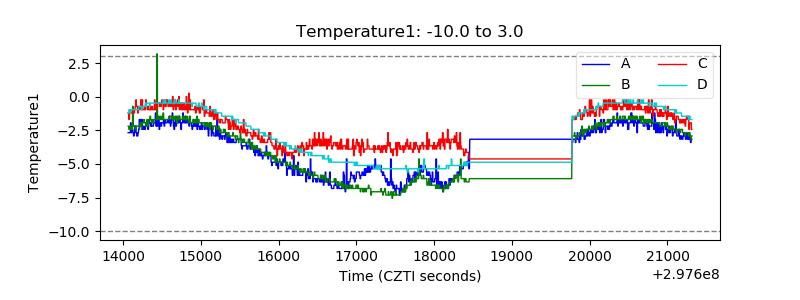 |
| Veto HV Monitor | 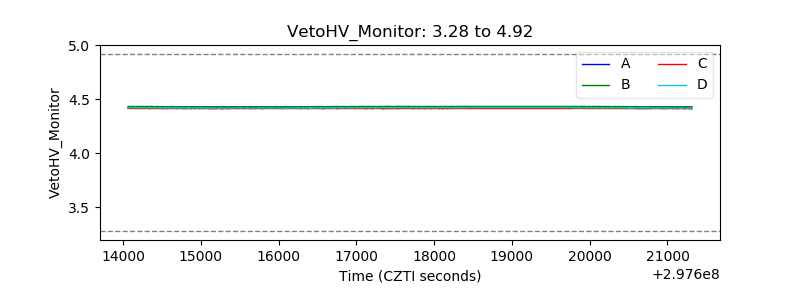 |
| Veto LLD | 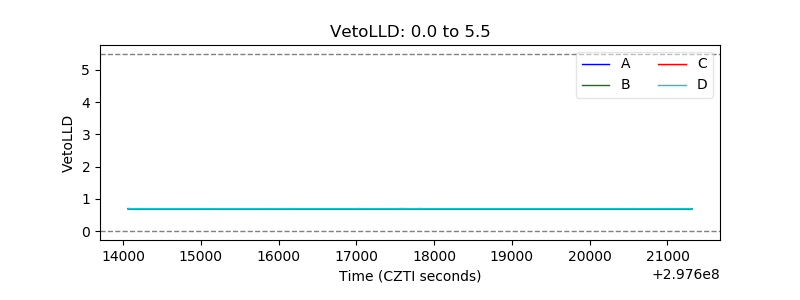 |
| Alpha Counter | 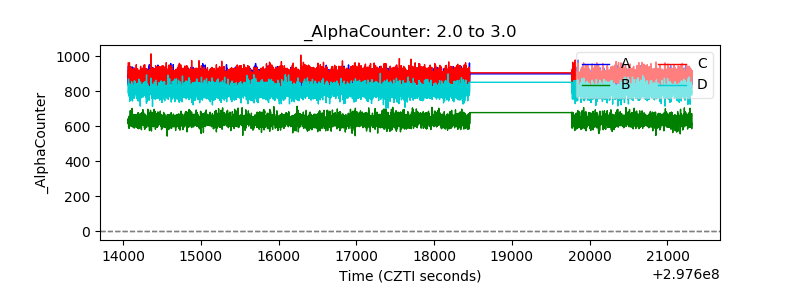 |
| _CPM_Rate | 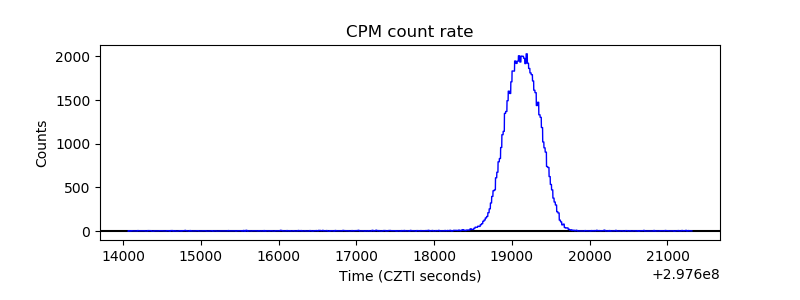 |
| CZT Counter | 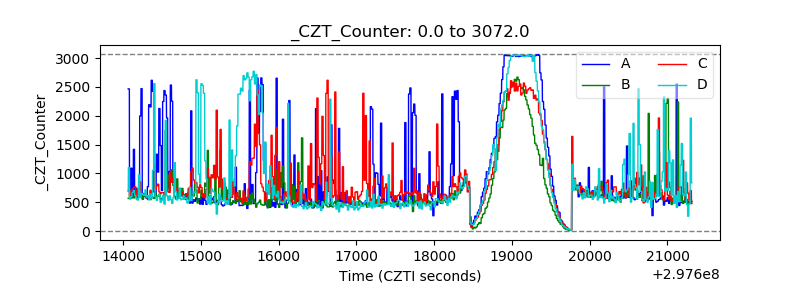 |
| +2.5 Volts monitor | 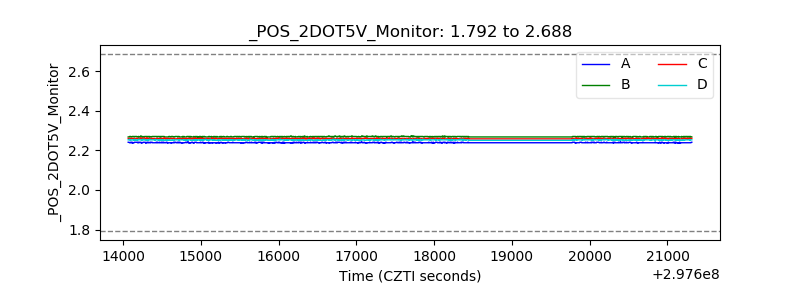 |
| +5 Volts monitor | 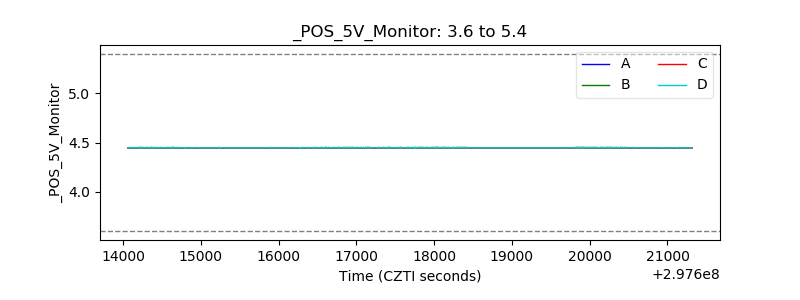 |
| _ROLL_ROT | 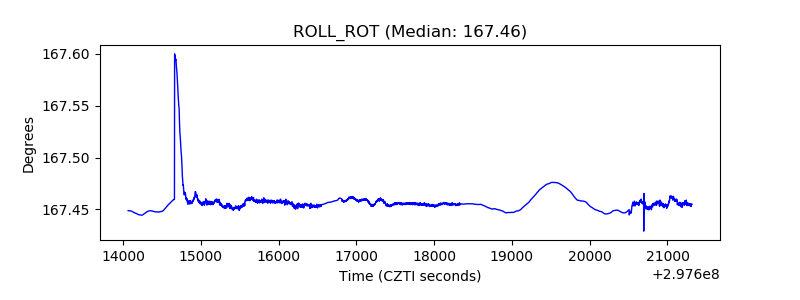 |
| _Roll_DEC | 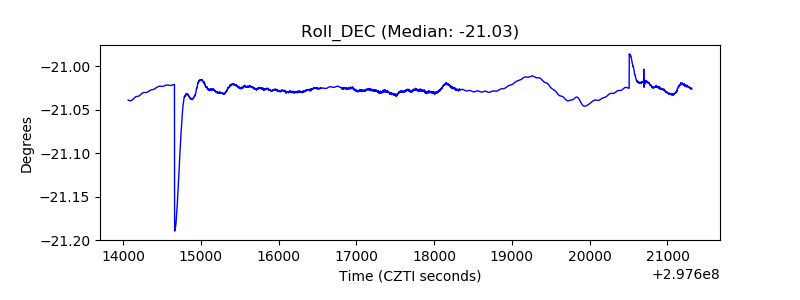 |
| _Roll_RA | 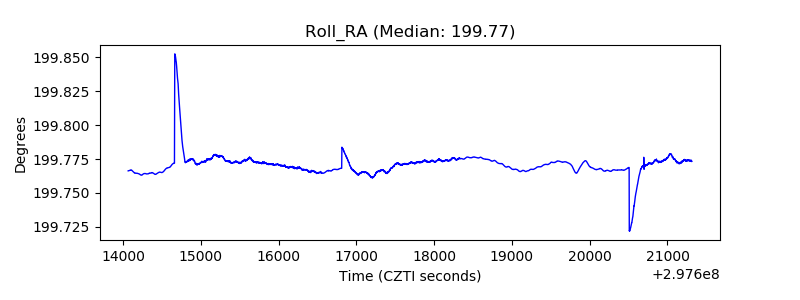 |
| Veto Counter | 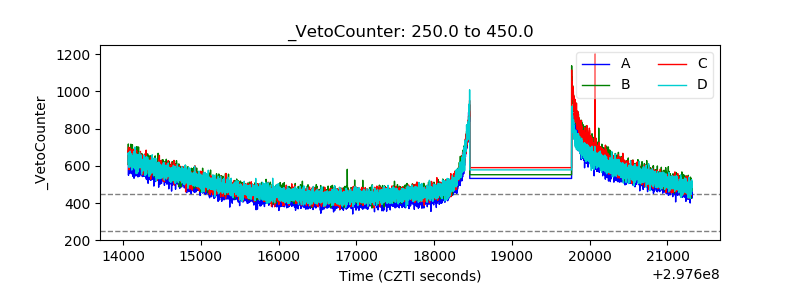 |