| Param | Original file | Final file |
|---|---|---|
| Filename | modeM0/AS1T03_036T01_9000002972_19961cztM0_level2.evt | modeM0/AS1T03_036T01_9000002972_19961cztM0_level2_quad_clean.evt |
| Size (bytes) | 559,416,960 | 100,932,480 |
| Size | 533.5 MB | 96.3 MB |
| Events in quadrant A | 3,418,445 | 697,638 |
| Events in quadrant B | 3,813,909 | 681,612 |
| Events in quadrant C | 4,275,914 | 635,354 |
| Events in quadrant D | 5,008,215 | 603,522 |
| Mode M0 | |||
|---|---|---|---|
| Quadrant | BADHDUFLAG | Total packets | Discarded packets |
| A | 0 | 14103 | 2 |
| B | 0 | 15488 | 2 |
| C | 0 | 17171 | 2 |
| D | 0 | 19205 | 4 |
| Mode SS | |||
|---|---|---|---|
| Quadrant | BADHDUFLAG | Total packets | Discarded packets |
| A | 0 | 128 | 0 |
| B | 0 | 128 | 0 |
| C | 0 | 128 | 0 |
| D | 0 | 128 | 0 |
| Mode M9 | |||
|---|---|---|---|
| Quadrant | BADHDUFLAG | Total packets | Discarded packets |
| A | 0 | 16 | 0 |
| B | 0 | 17 | 0 |
| C | 0 | 17 | 0 |
| D | 0 | 17 | 0 |
| Quadrant | Total seconds | Saturated seconds | Saturation percentage |
|---|---|---|---|
| A | 6279 | 130 | 2.070393% |
| B | 6279 | 181 | 2.882625% |
| C | 6279 | 171 | 2.723364% |
| D | 6278 | 575 | 9.158968% |
Noise dominated data is calculated using 1-second bins in cleaned event files. If a bin has >2000 counts, and if more than 50% of those come from <1% of pixels, then it is considered to be noise-dominated and hence unusable.
| Quadrant | # 1 sec bins | Bins with >0 counts | Bins with >2000 counts | High rate bins dominated by noise | Noise dominated (total time) | Noise dominated (detector-on time) | Marked lightcurve |
|---|---|---|---|---|---|---|---|
| A | 7584 | 6279 | 26 | 26 | 0.34% | 0.41% | 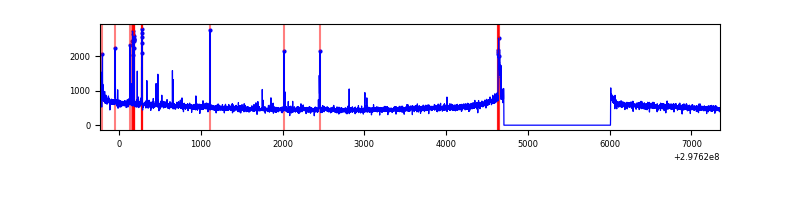 |
| B | 7584 | 6279 | 69 | 69 | 0.91% | 1.10% |  |
| C | 7584 | 6279 | 5 | 5 | 0.07% | 0.08% | 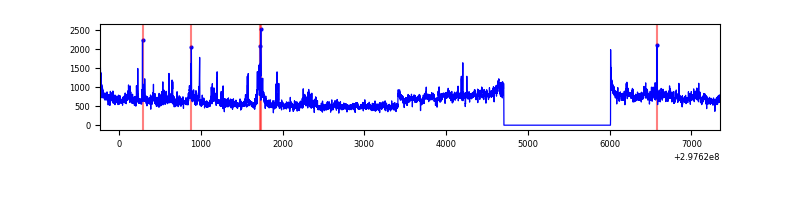 |
| D | 7582 | 6277 | 541 | 541 | 7.14% | 8.62% | 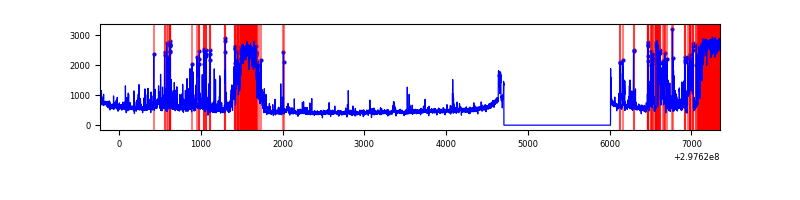 |
Top three noisy pixels from each quadrant. If the there are fewer than three noisy pixels in the level2.evt file, extra rows are filled as -1
| Pixel properties | Quadrant properties | ||||||
|---|---|---|---|---|---|---|---|
| Quadrant | DetID | PixID | Counts | Sigma | Mean | Median | Sigma |
| A | 14 | 238 | 144072 | 852.22 | 847 | 835 | 168.1 |
| A | 14 | 254 | 9609 | 52.2 | 847 | 835 | 168.1 |
| A | 0 | 226 | 7502 | 39.67 | 847 | 835 | 168.1 |
| B | 7 | 220 | 373496 | 2373.66 | 827 | 809 | 157.0 |
| B | 0 | 197 | 113286 | 716.37 | 827 | 809 | 157.0 |
| B | 0 | 190 | 29132 | 180.39 | 827 | 809 | 157.0 |
| C | 3 | 233 | 607711 | 3369.31 | 784 | 792 | 180.1 |
| C | 10 | 222 | 453084 | 2510.9 | 784 | 792 | 180.1 |
| C | 14 | 238 | 123178 | 679.43 | 784 | 792 | 180.1 |
| D | 7 | 38 | 1063434 | 5581.26 | 789 | 770 | 190.4 |
| D | 12 | 218 | 671381 | 3522.14 | 789 | 770 | 190.4 |
| D | 12 | 233 | 167881 | 877.69 | 789 | 770 | 190.4 |
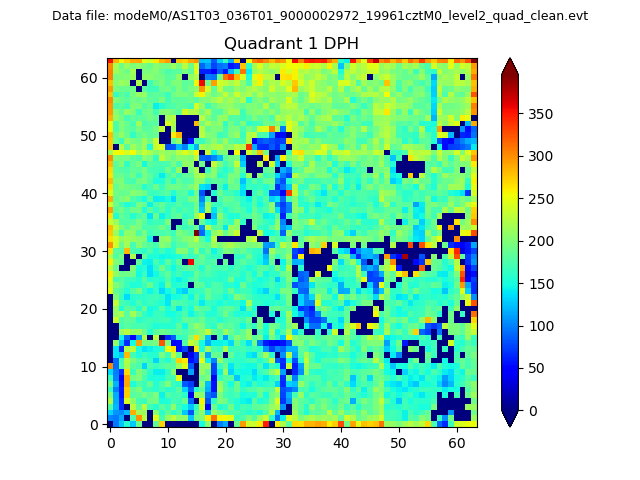
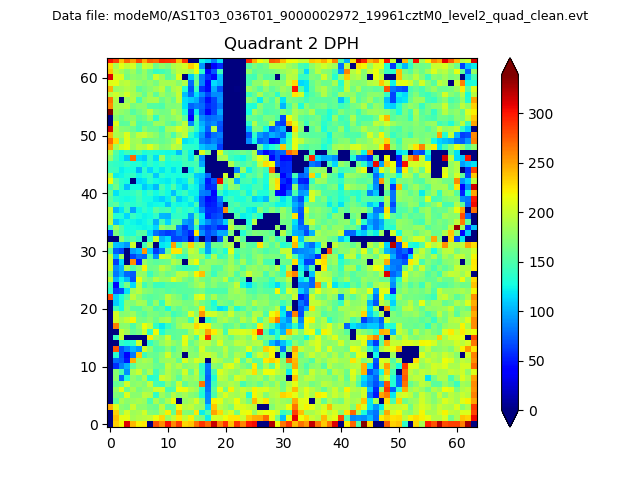
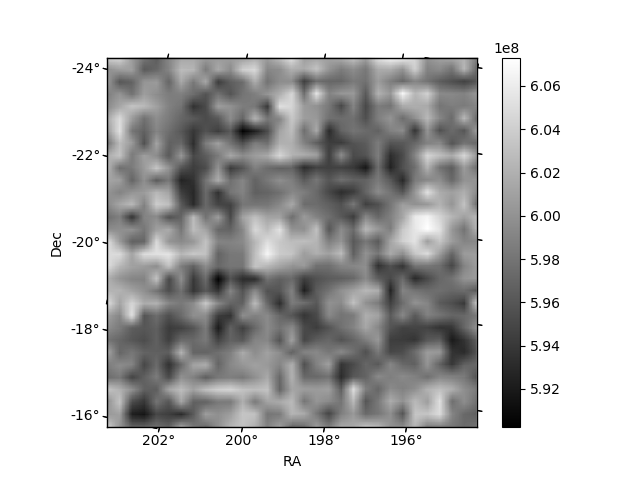
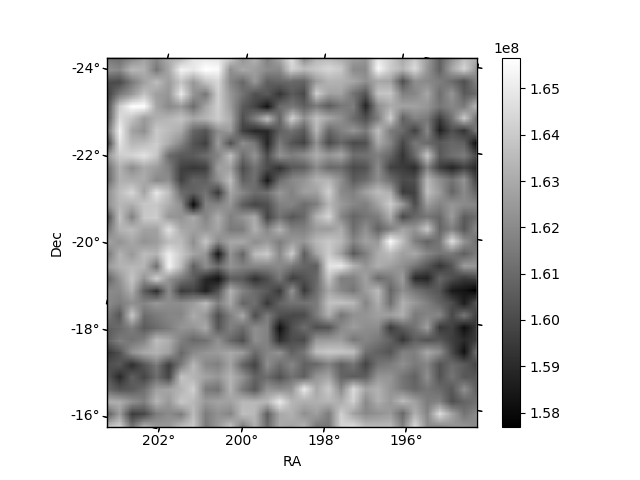
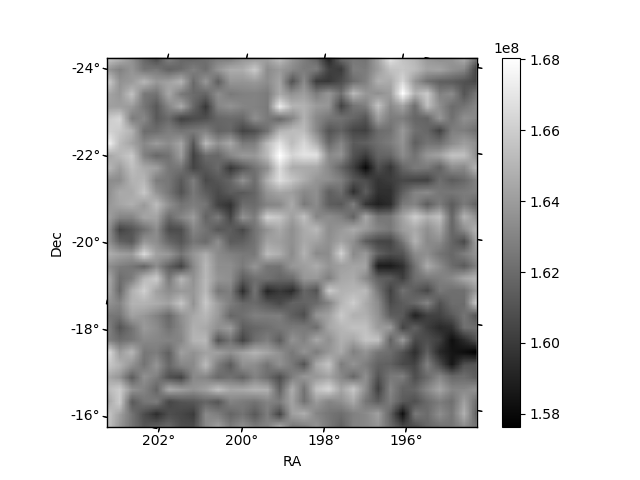
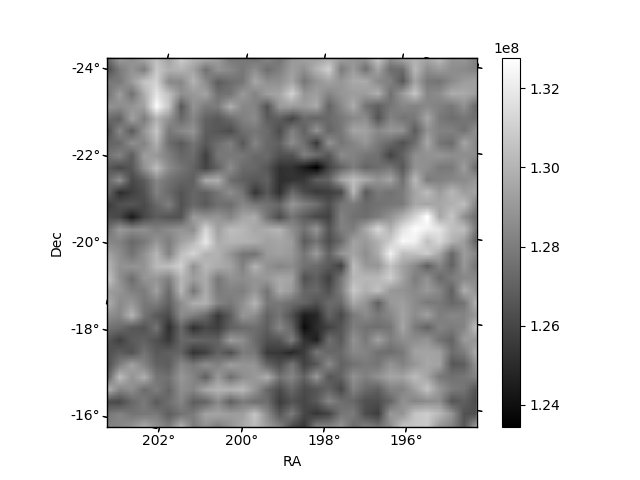
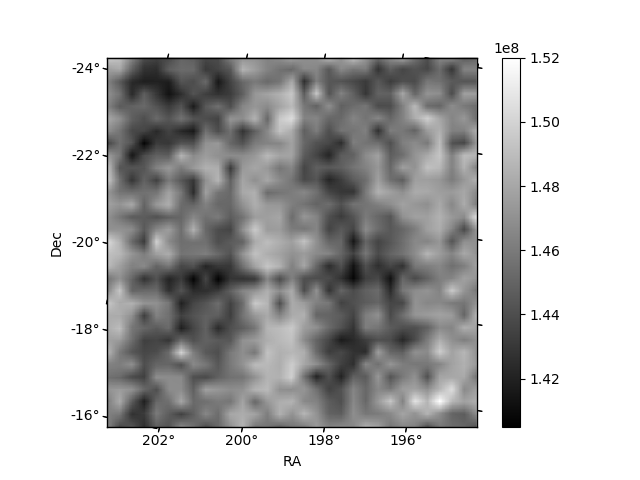
Histogram calculated using DETX and DETY for each event in the final _common_clean file
| Quadrant A | 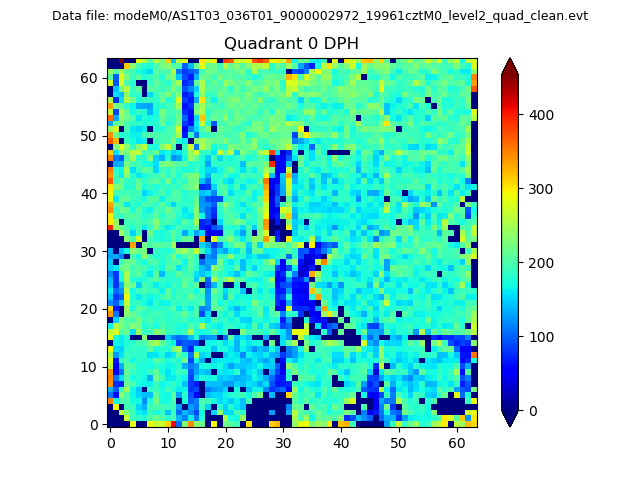 |
 |
Quadrant B |
|---|---|---|---|
| Quadrant D | 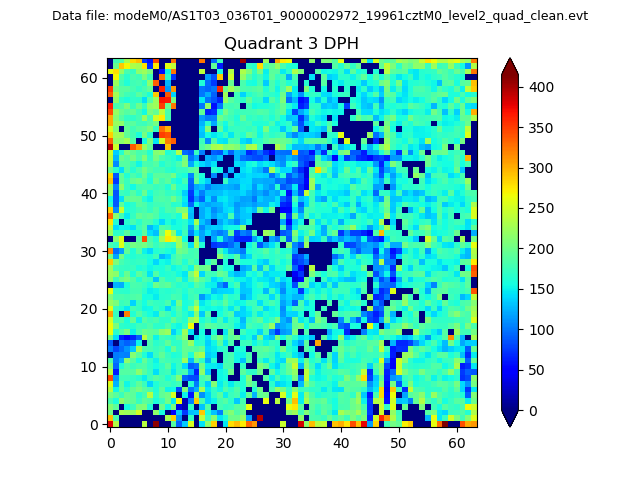 |
 |
Quadrant C |
| Plot type | Count rate plots | Images |
|---|---|---|
| Comparison with Poisson distribution Blue bars denote a histogram of data divided into 1 sec bins. Red curve is a Poisson curve with rate = median count rate of data. |
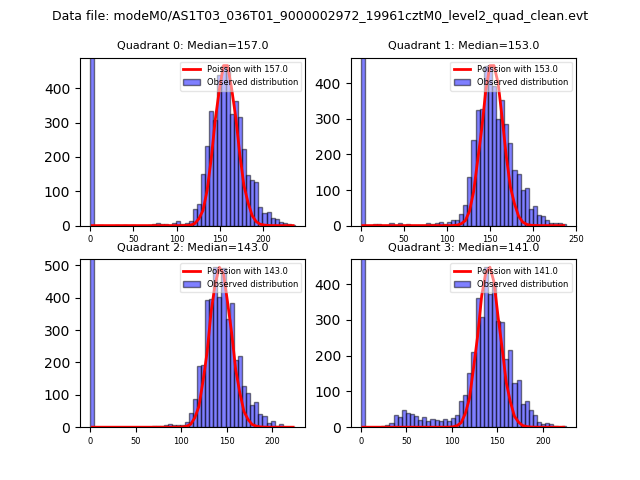 |
 |
| Quadrant-wise count rates Data is divided into 100 sec bins |
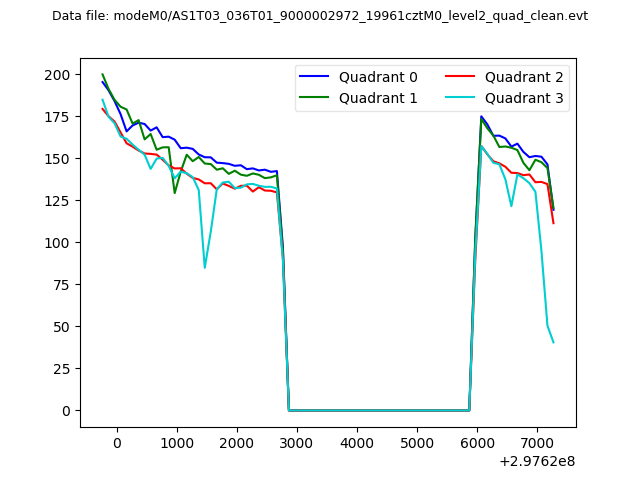 |
|
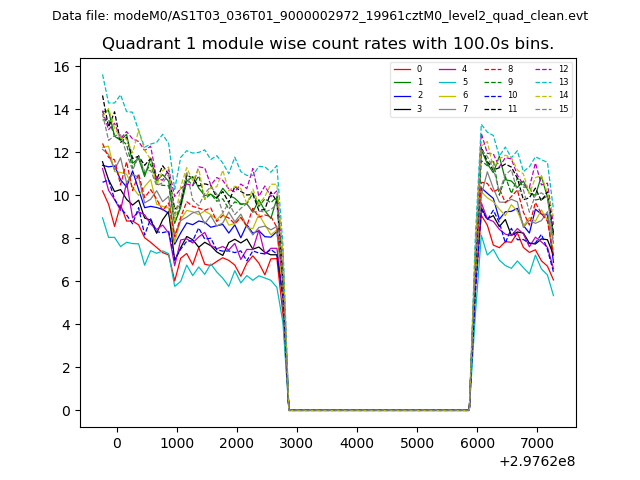
| Module-wise count rates for Quadrant A Data is divided into 100 sec bins |
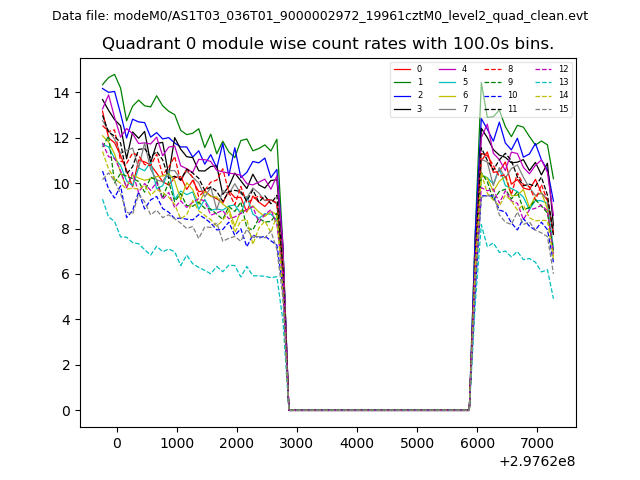 |
 |
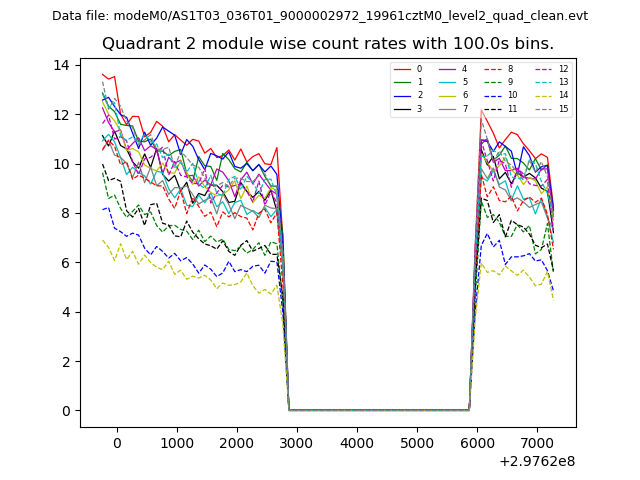
| Module-wise count rates for Quadrant B Data is divided into 100 sec bins |
 |
 |
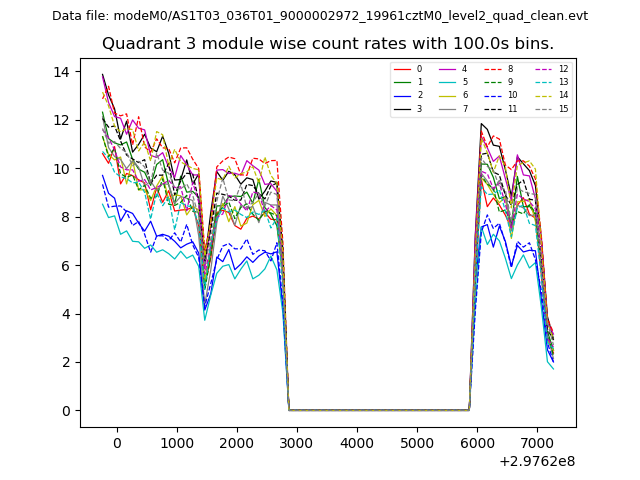
| Module-wise count rates for Quadrant C Data is divided into 100 sec bins |
 |
 |
| Module-wise count rates for Quadrant D Data is divided into 100 sec bins |
 |
 |
| Parameter | Plot |
|---|---|
| CZT HV Monitor | 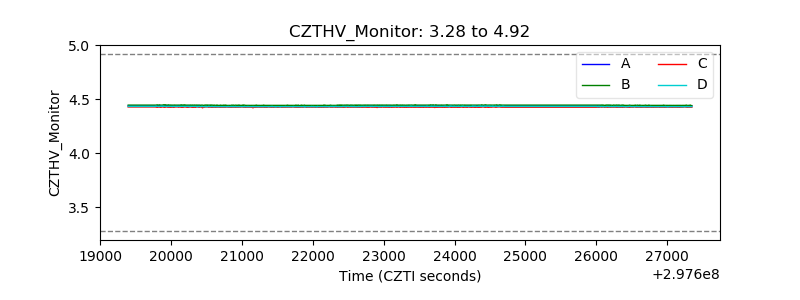 |
| D_VDD | 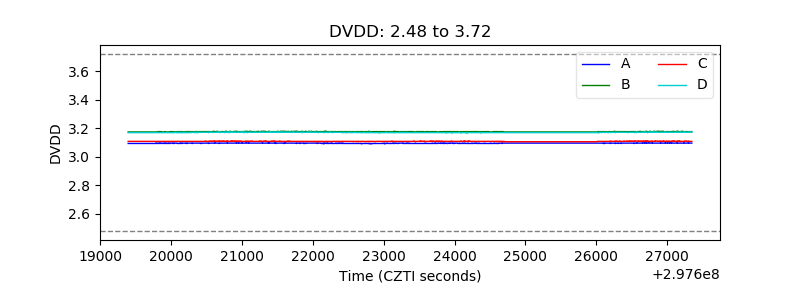 |
| Temperature 1 | 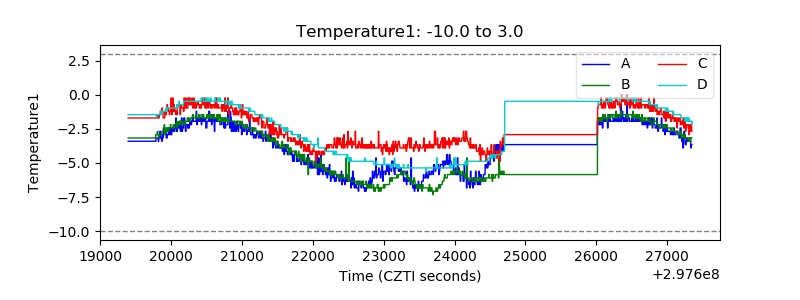 |
| Veto HV Monitor | 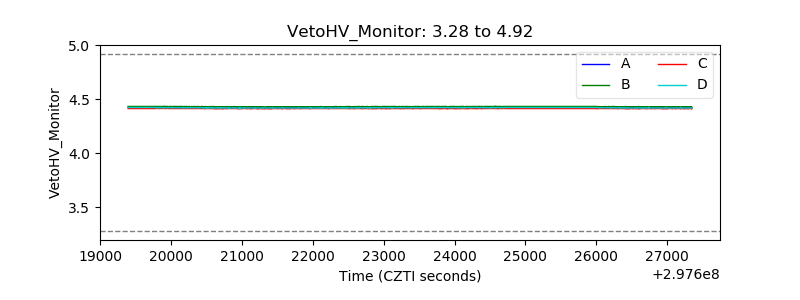 |
| Veto LLD | 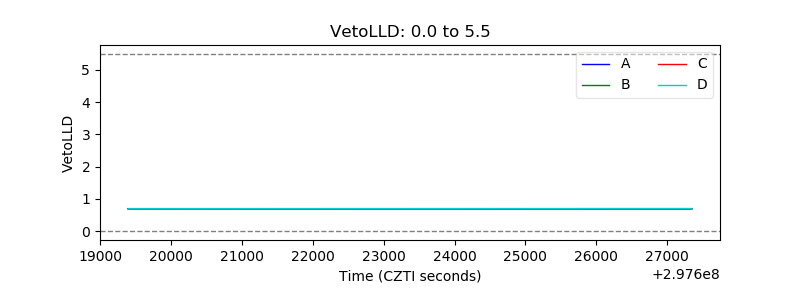 |
| Alpha Counter | 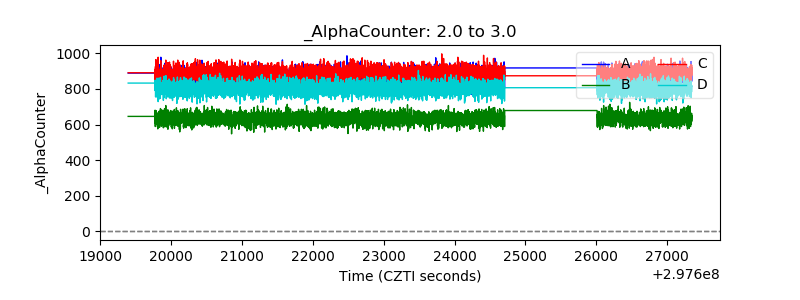 |
| _CPM_Rate | 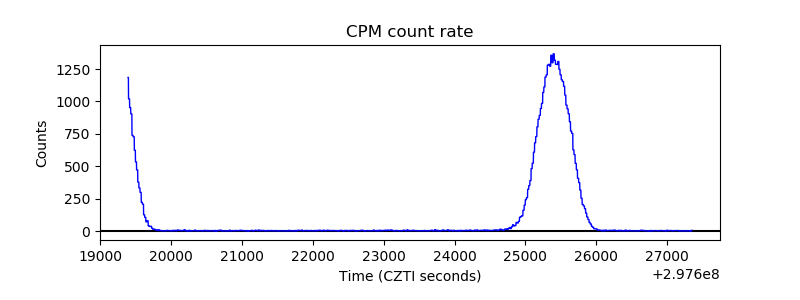 |
| CZT Counter | 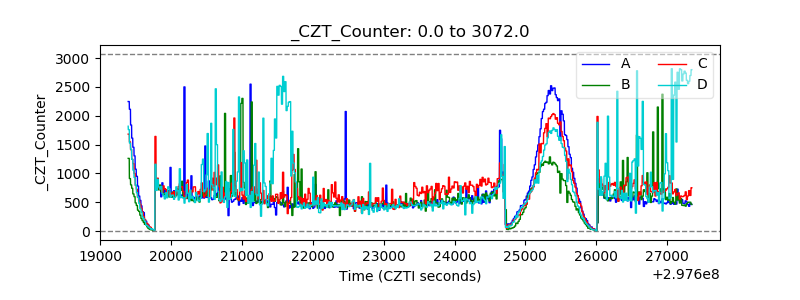 |
| +2.5 Volts monitor |  |
| +5 Volts monitor | 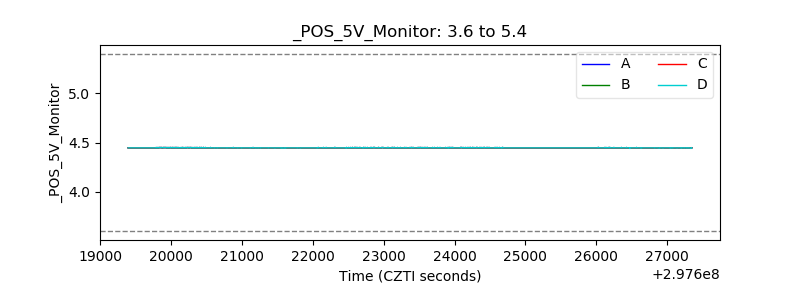 |
| _ROLL_ROT | 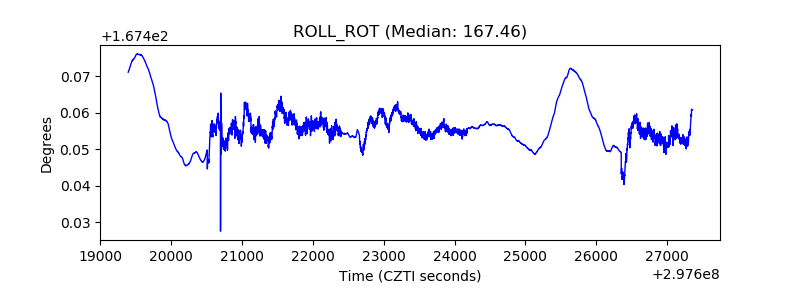 |
| _Roll_DEC | 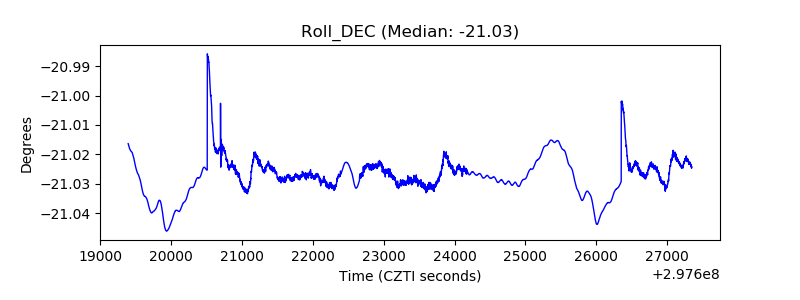 |
| _Roll_RA | 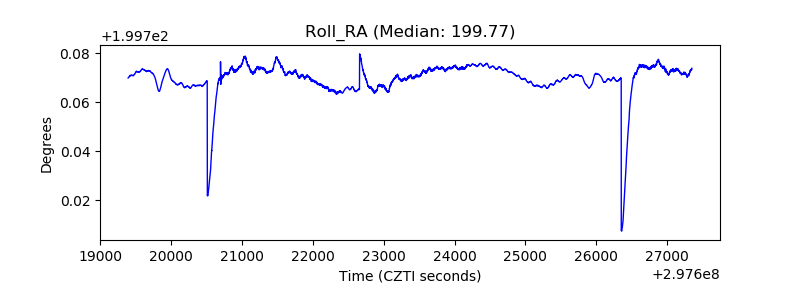 |
| Veto Counter | 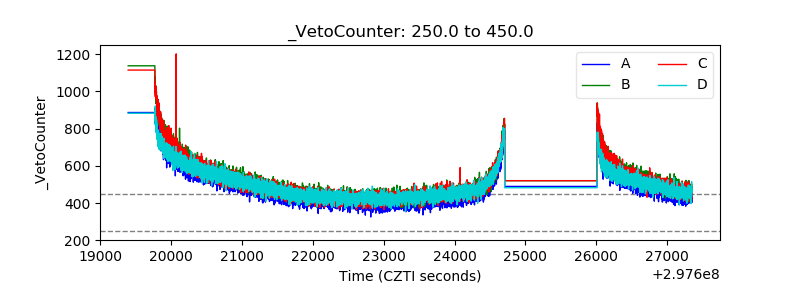 |