| Param | Original file | Final file |
|---|---|---|
| Filename | modeM0/AS1T03_036T01_9000002972_19962cztM0_level2.evt | modeM0/AS1T03_036T01_9000002972_19962cztM0_level2_quad_clean.evt |
| Size (bytes) | 173,882,880 | 32,682,240 |
| Size | 165.8 MB | 31.2 MB |
| Events in quadrant A | 819,498 | 241,079 |
| Events in quadrant B | 1,014,726 | 236,434 |
| Events in quadrant C | 1,139,481 | 218,000 |
| Events in quadrant D | 2,185,983 | 180,224 |
| Mode M0 | |||
|---|---|---|---|
| Quadrant | BADHDUFLAG | Total packets | Discarded packets |
| A | 0 | 3322 | 1 |
| B | 0 | 4046 | 1 |
| C | 0 | 4574 | 1 |
| D | 0 | 7566 | 1 |
| Mode SS | |||
|---|---|---|---|
| Quadrant | BADHDUFLAG | Total packets | Discarded packets |
| A | 0 | 30 | 0 |
| B | 0 | 30 | 0 |
| C | 0 | 30 | 0 |
| D | 0 | 30 | 0 |
| Mode M9 | |||
|---|---|---|---|
| Quadrant | BADHDUFLAG | Total packets | Discarded packets |
| A | 0 | 2 | 0 |
| B | 0 | 3 | 0 |
| C | 0 | 3 | 0 |
| D | 0 | 3 | 0 |
| Quadrant | Total seconds | Saturated seconds | Saturation percentage |
|---|---|---|---|
| A | 1535 | 6 | 0.390879% |
| B | 1535 | 33 | 2.149837% |
| C | 1535 | 26 | 1.693811% |
| D | 1535 | 498 | 32.442997% |
Noise dominated data is calculated using 1-second bins in cleaned event files. If a bin has >2000 counts, and if more than 50% of those come from <1% of pixels, then it is considered to be noise-dominated and hence unusable.
| Quadrant | # 1 sec bins | Bins with >0 counts | Bins with >2000 counts | High rate bins dominated by noise | Noise dominated (total time) | Noise dominated (detector-on time) | Marked lightcurve |
|---|---|---|---|---|---|---|---|
| A | 1535 | 1535 | 0 | 0 | 0.00% | 0.00% | 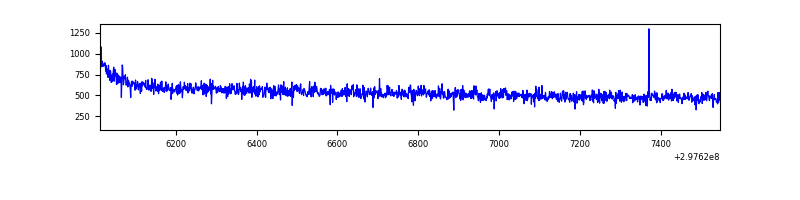 |
| B | 1535 | 1535 | 13 | 13 | 0.85% | 0.85% | 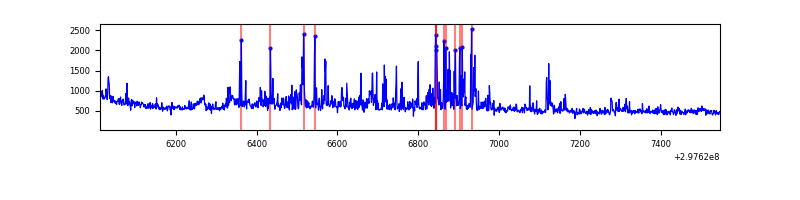 |
| C | 1535 | 1535 | 1 | 1 | 0.07% | 0.07% | 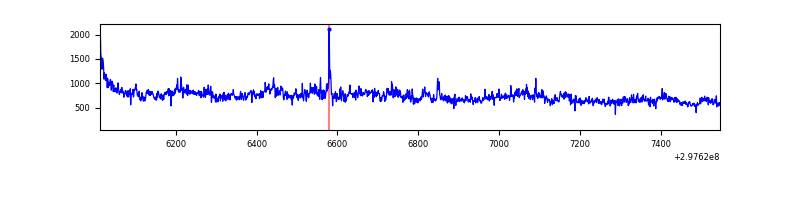 |
| D | 1534 | 1534 | 507 | 507 | 33.05% | 33.05% | 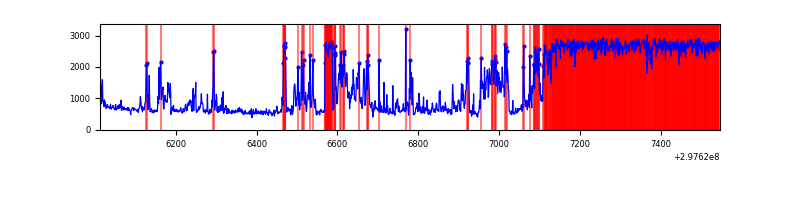 |
Top three noisy pixels from each quadrant. If the there are fewer than three noisy pixels in the level2.evt file, extra rows are filled as -1
| Pixel properties | Quadrant properties | ||||||
|---|---|---|---|---|---|---|---|
| Quadrant | DetID | PixID | Counts | Sigma | Mean | Median | Sigma |
| A | 0 | 226 | 1993 | 40.48 | 212 | 209 | 44.1 |
| A | 11 | 29 | 1964 | 39.82 | 212 | 209 | 44.1 |
| A | 14 | 238 | 1613 | 31.86 | 212 | 209 | 44.1 |
| B | 7 | 220 | 129328 | 3128.87 | 205 | 201 | 41.3 |
| B | 0 | 197 | 43644 | 1052.66 | 205 | 201 | 41.3 |
| B | 0 | 190 | 14918 | 356.61 | 205 | 201 | 41.3 |
| C | 10 | 222 | 222137 | 4844.22 | 193 | 194 | 45.8 |
| C | 3 | 233 | 128046 | 2790.55 | 193 | 194 | 45.8 |
| C | 14 | 238 | 29720 | 644.45 | 193 | 194 | 45.8 |
| D | 7 | 38 | 961518 | 21735.34 | 174 | 169 | 44.2 |
| D | 12 | 218 | 494941 | 11186.4 | 174 | 169 | 44.2 |
| D | 7 | 96 | 17504 | 391.93 | 174 | 169 | 44.2 |
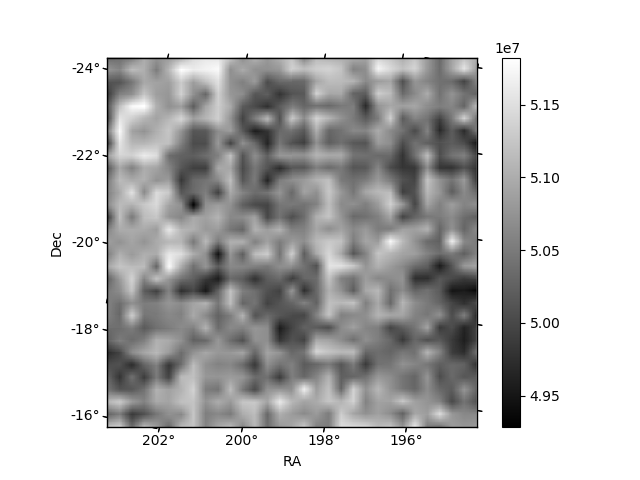
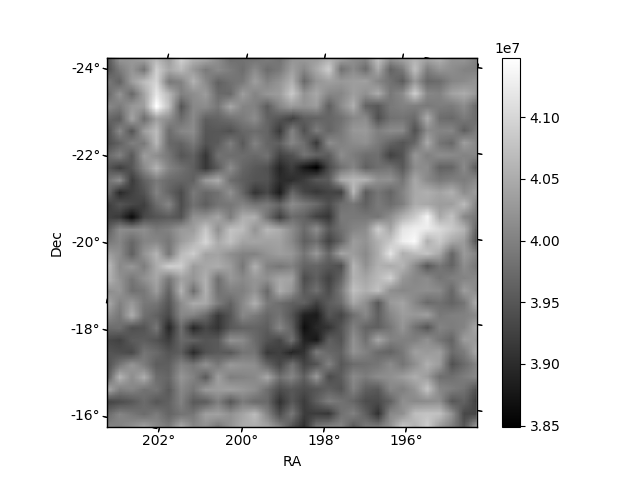
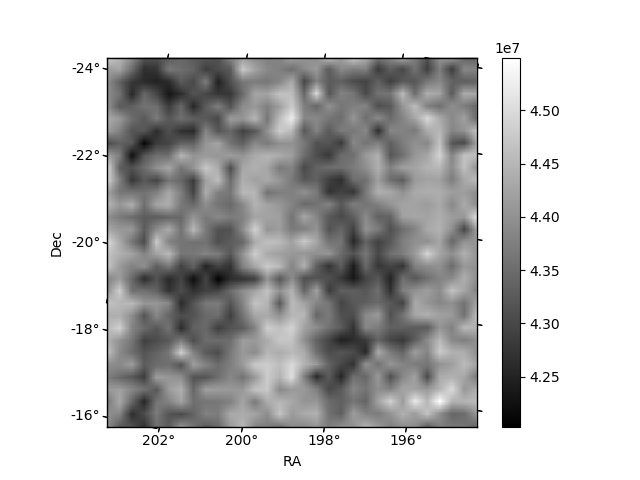
Histogram calculated using DETX and DETY for each event in the final _common_clean file
| Quadrant A | 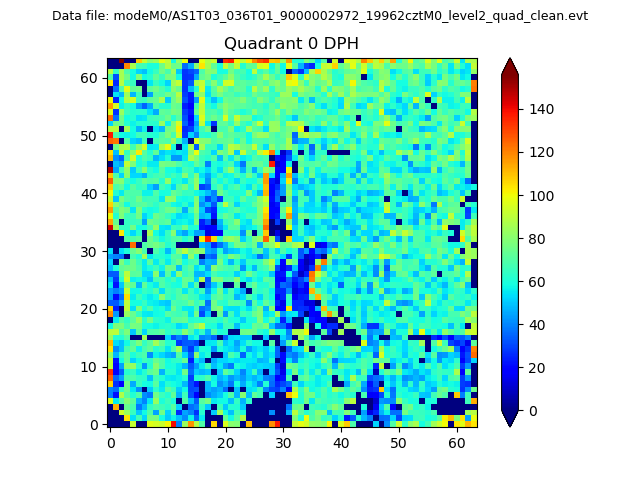 |
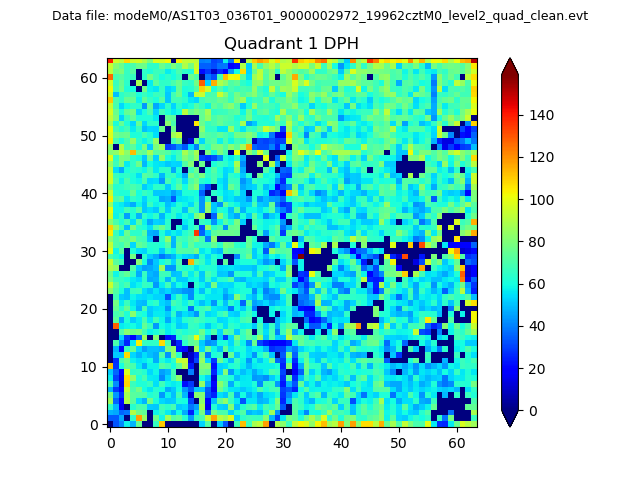 |
Quadrant B |
|---|---|---|---|
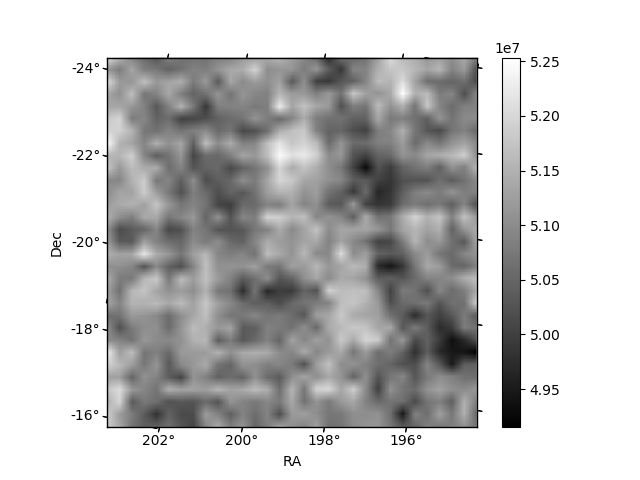
| Quadrant D | 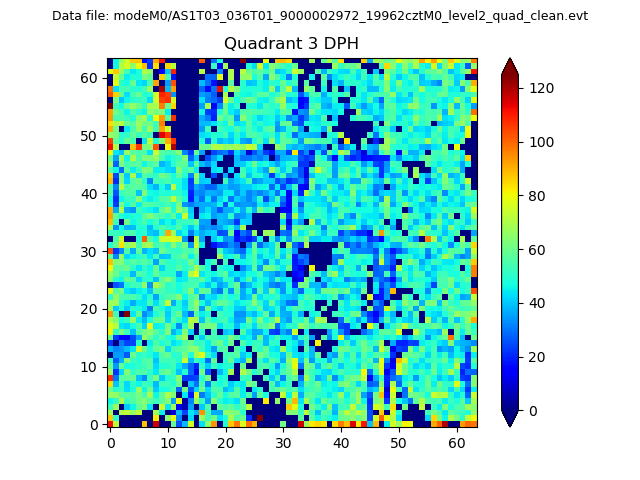 |
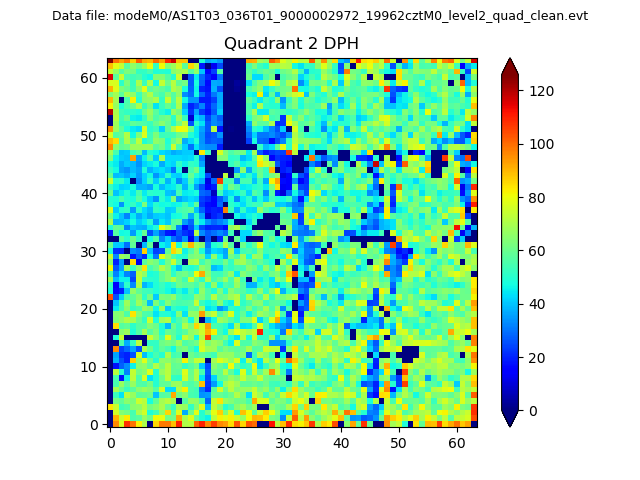 |
Quadrant C |
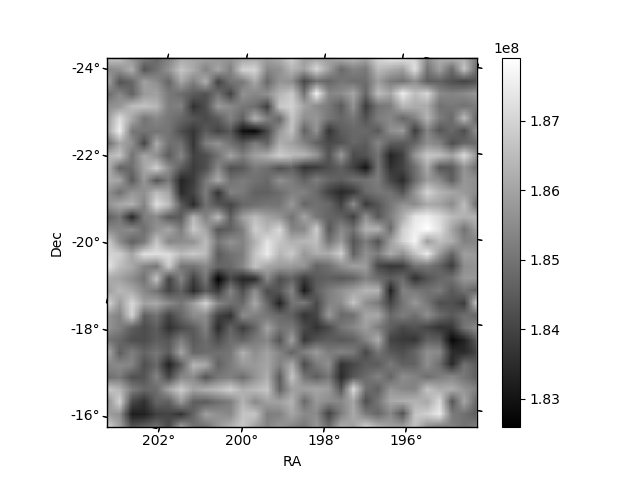
| Plot type | Count rate plots | Images |
|---|---|---|
| Comparison with Poisson distribution Blue bars denote a histogram of data divided into 1 sec bins. Red curve is a Poisson curve with rate = median count rate of data. |
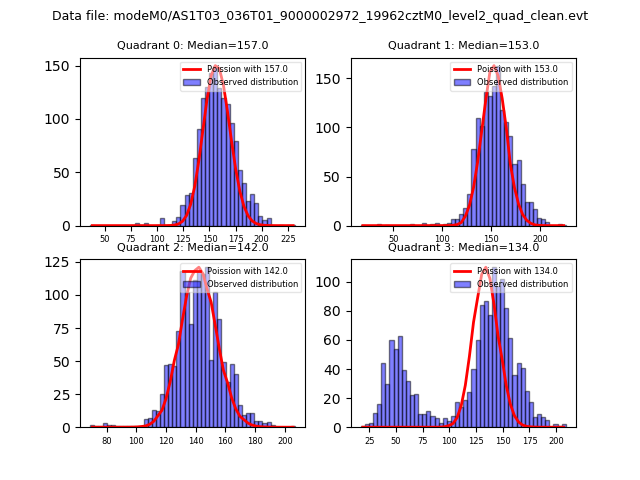 |
 |
| Quadrant-wise count rates Data is divided into 100 sec bins |
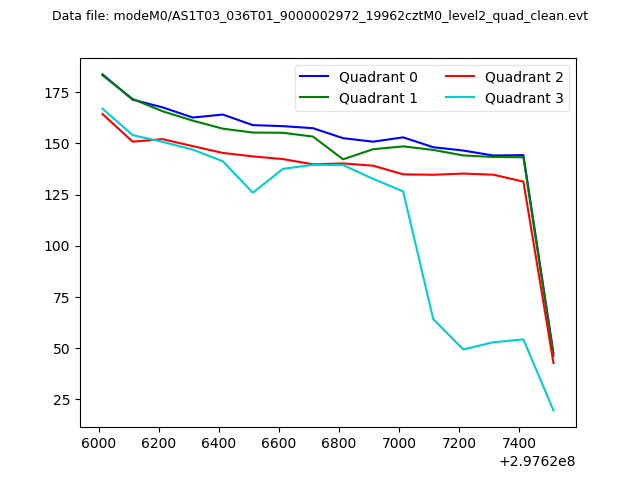 |
|
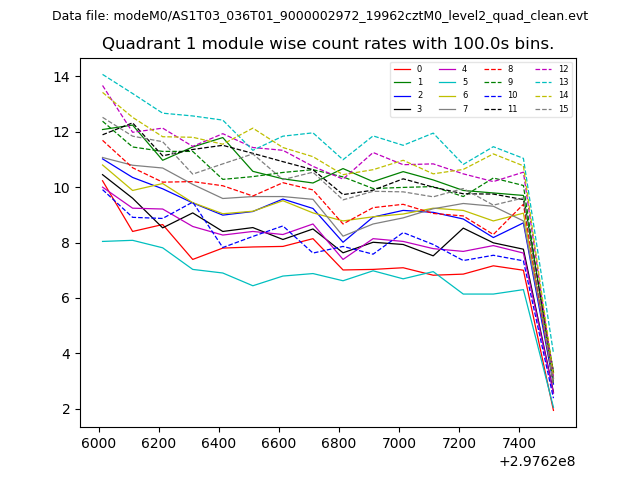
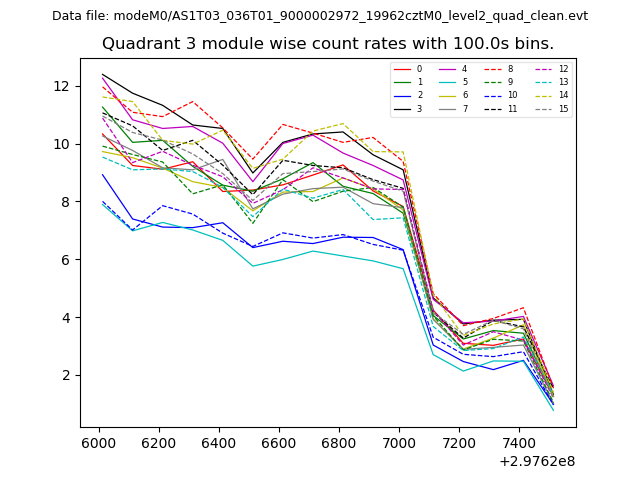
| Module-wise count rates for Quadrant A Data is divided into 100 sec bins |
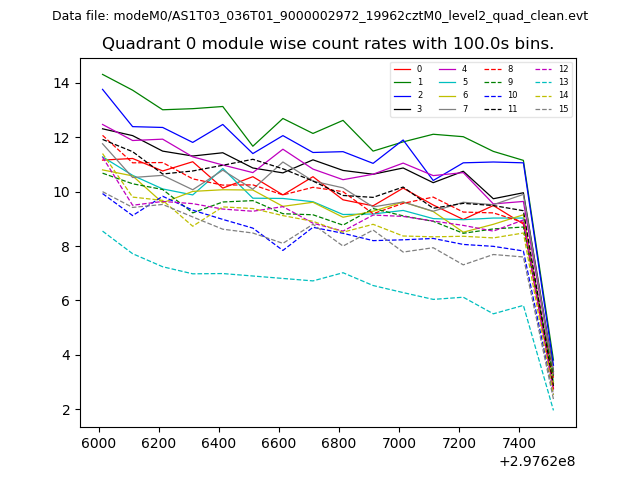 |
 |
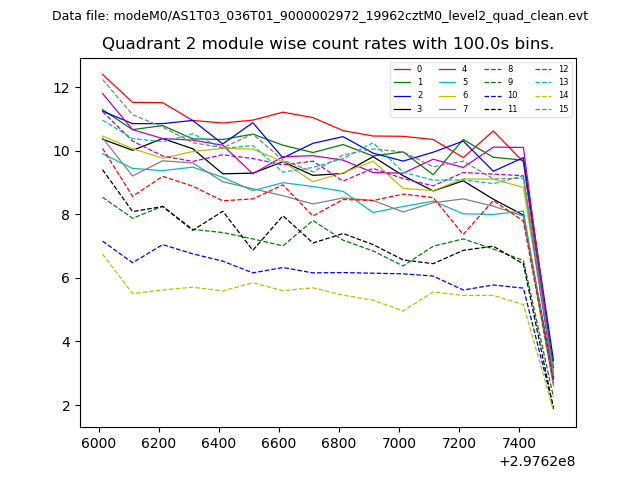
| Module-wise count rates for Quadrant B Data is divided into 100 sec bins |
 |
 |
| Module-wise count rates for Quadrant C Data is divided into 100 sec bins |
 |
 |
| Module-wise count rates for Quadrant D Data is divided into 100 sec bins |
 |
 |
| Parameter | Plot |
|---|---|
| CZT HV Monitor | 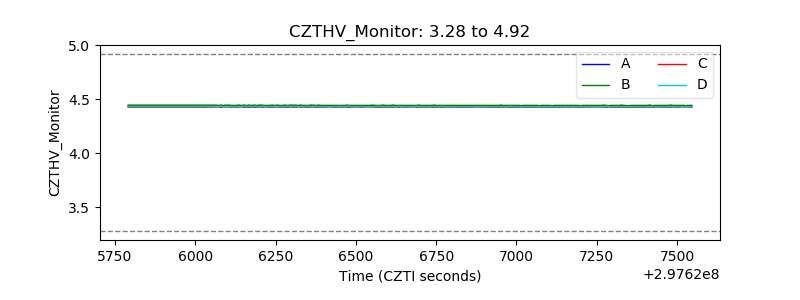 |
| D_VDD | 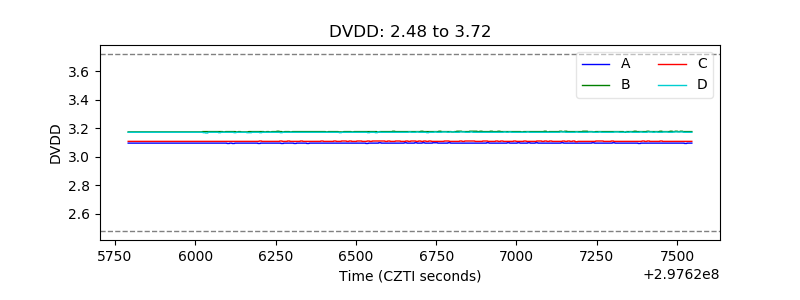 |
| Temperature 1 | 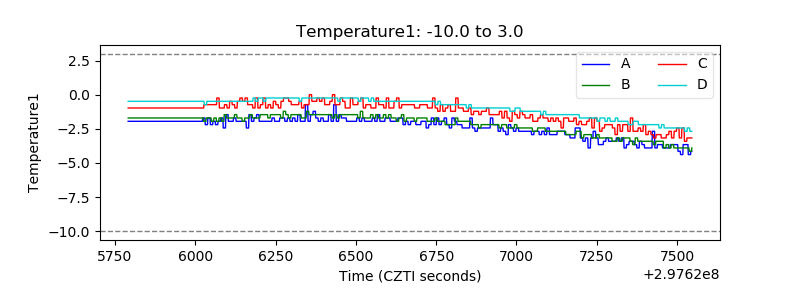 |
| Veto HV Monitor | 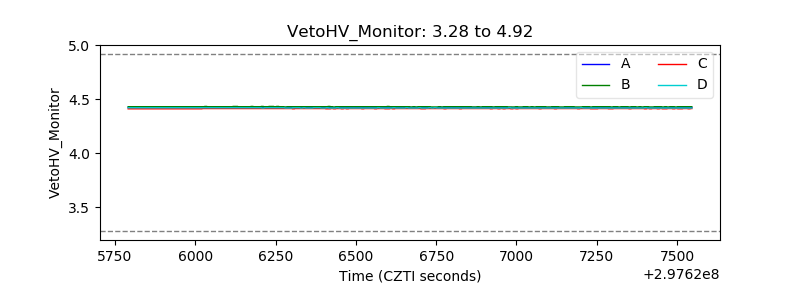 |
| Veto LLD | 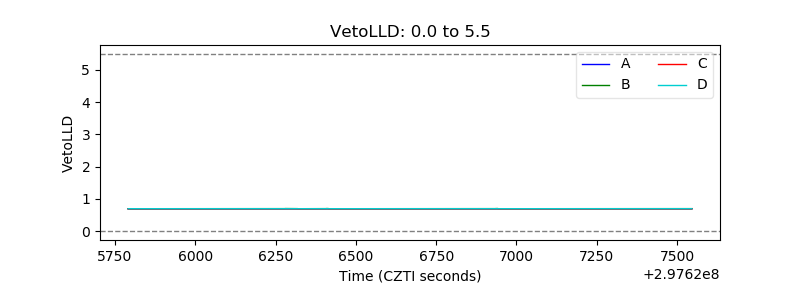 |
| Alpha Counter | 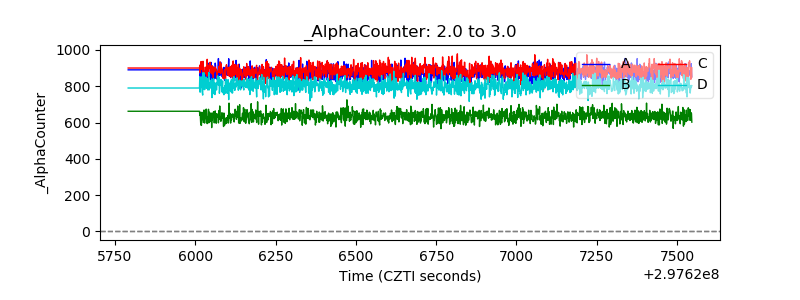 |
| _CPM_Rate | 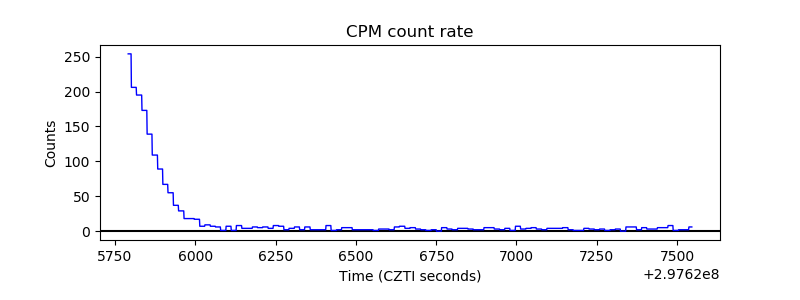 |
| CZT Counter | 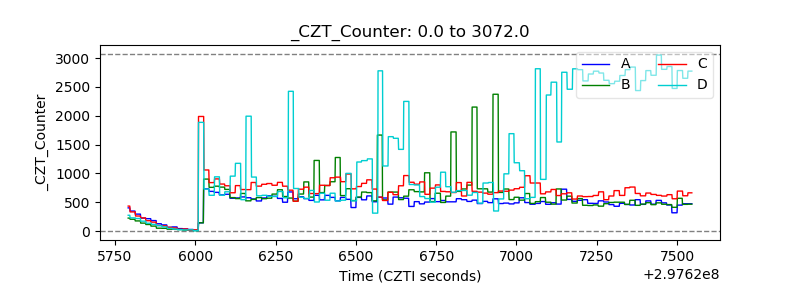 |
| +2.5 Volts monitor | 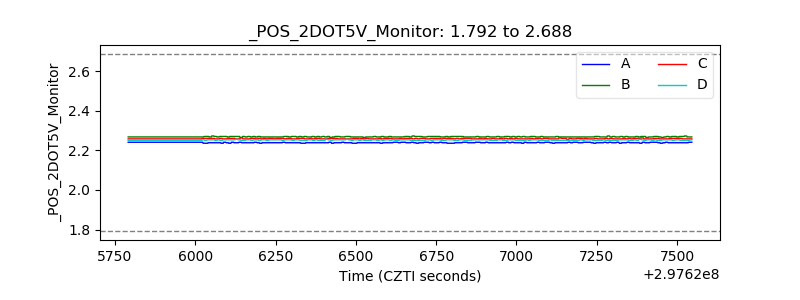 |
| +5 Volts monitor | 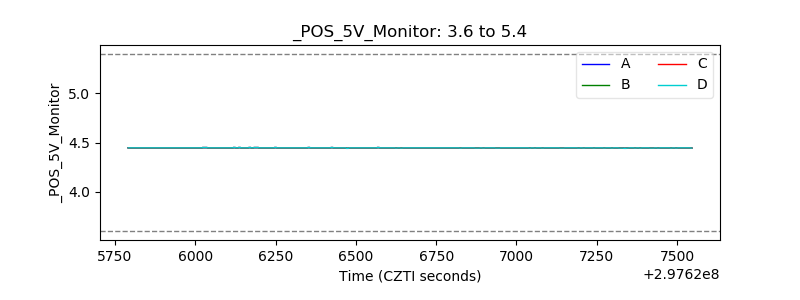 |
| _ROLL_ROT | 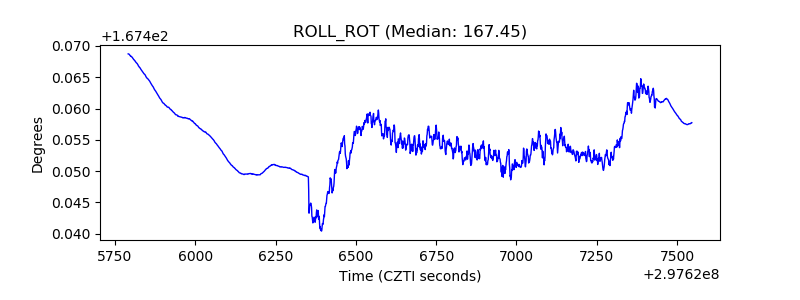 |
| _Roll_DEC | 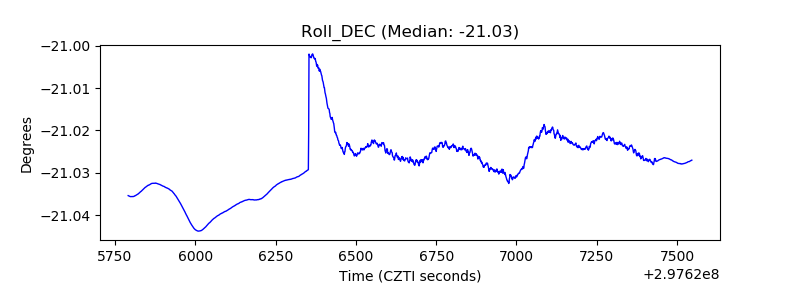 |
| _Roll_RA | 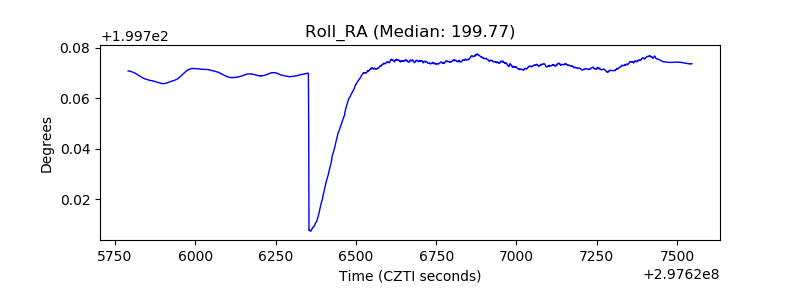 |
| Veto Counter | 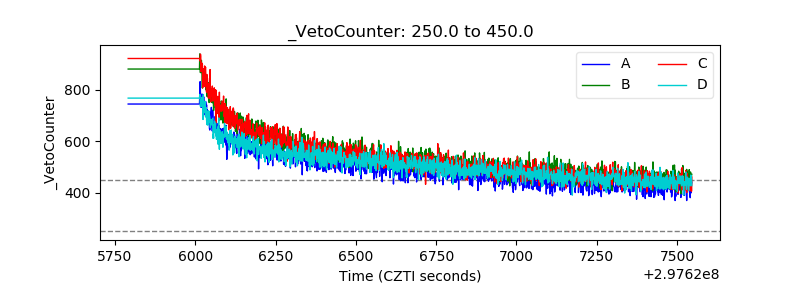 |