| Param | Original file | Final file |
|---|---|---|
| Filename | modeM0/AS1A05_082T09_9000002978cztM0_level2.fits | modeM0/AS1A05_082T09_9000002978cztM0_level2_quad_clean.evt |
| Size (bytes) | 303,765,120 | 271,771,200 |
| Size | 289.7 MB | 259.2 MB |
| Events in quadrant A | 907,004 | 588,400 |
| Events in quadrant B | 2,000,326 | 1,843,747 |
| Events in quadrant C | 2,032,152 | 1,728,669 |
| Events in quadrant D | 1,788,378 | 1,608,549 |
| Mode SS | |||
|---|---|---|---|
| Quadrant | BADHDUFLAG | Total packets | Discarded packets |
| A | 0 | 724 | 0 |
| B | 0 | 724 | 0 |
| C | 0 | 724 | 0 |
| D | 0 | 724 | 0 |
| Mode M0 | |||
|---|---|---|---|
| Quadrant | BADHDUFLAG | Total packets | Discarded packets |
| A | 0 | 218234 | 0 |
| B | 0 | 75022 | 0 |
| C | 0 | 81448 | 0 |
| D | 0 | 80273 | 0 |
| Mode M9 | |||
|---|---|---|---|
| Quadrant | BADHDUFLAG | Total packets | Discarded packets |
| A | 0 | 35 | 0 |
| B | 0 | 35 | 0 |
| C | 0 | 35 | 0 |
| D | 0 | 35 | 0 |
| Quadrant | Total seconds | Saturated seconds | Saturation percentage |
|---|---|---|---|
| A | 35819 | 24693 | 68.938273% |
| B | 35819 | 396 | 1.105559% |
| C | 35819 | 645 | 1.800720% |
| D | 35819 | 456 | 1.273067% |
Noise dominated data is calculated using 1-second bins in cleaned event files. If a bin has >2000 counts, and if more than 50% of those come from <1% of pixels, then it is considered to be noise-dominated and hence unusable.
| Quadrant | # 1 sec bins | Bins with >0 counts | Bins with >2000 counts | High rate bins dominated by noise | Noise dominated (total time) | Noise dominated (detector-on time) | Marked lightcurve |
|---|---|---|---|---|---|---|---|
| A | 39128 | 27394 | 0 | 0 | 0.00% | 0.00% |  |
| B | 39128 | 35812 | 0 | 0 | 0.00% | 0.00% |  |
| C | 39129 | 35814 | 0 | 0 | 0.00% | 0.00% |  |
| D | 39128 | 35811 | 0 | 0 | 0.00% | 0.00% |  |
Top three noisy pixels from each quadrant. If the there are fewer than three noisy pixels in the level2.evt file, extra rows are filled as -1
| Pixel properties | Quadrant properties | ||||||
|---|---|---|---|---|---|---|---|
| Quadrant | DetID | PixID | Counts | Sigma | Mean | Median | Sigma |
| A | 14 | 188 | 881 | 10.98 | 235 | 221 | 60.1 |
| A | 0 | 29 | 879 | 10.95 | 235 | 221 | 60.1 |
| A | 14 | 204 | 734 | 8.53 | 235 | 221 | 60.1 |
| B | 2 | 9 | 1584 | 10.05 | 527 | 499 | 108.0 |
| B | 3 | 17 | 1399 | 8.34 | 527 | 499 | 108.0 |
| B | 2 | 8 | 1325 | 7.65 | 527 | 499 | 108.0 |
| C | 12 | 241 | 1473 | 6.97 | 536 | 500 | 139.5 |
| C | 12 | 250 | 1380 | 6.31 | 536 | 500 | 139.5 |
| C | 2 | 191 | 1360 | 6.16 | 536 | 500 | 139.5 |
| D | 3 | 14 | 1294 | 6.03 | 511 | 465 | 137.5 |
| D | 6 | 231 | 1281 | 5.93 | 511 | 465 | 137.5 |
| D | 10 | 189 | 1273 | 5.88 | 511 | 465 | 137.5 |
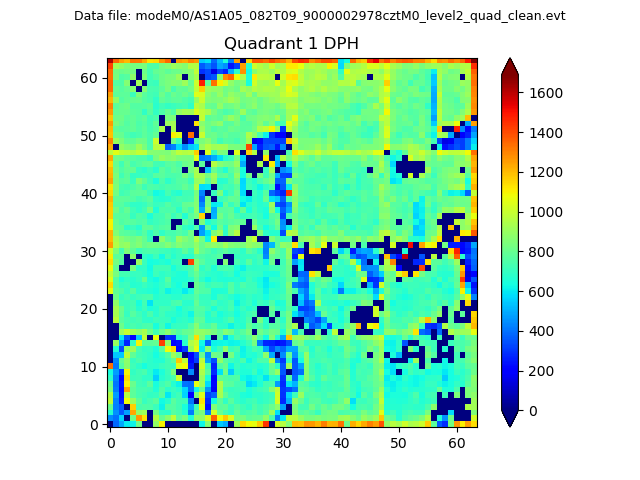
Histogram calculated using DETX and DETY for each event in the final _common_clean file
| Quadrant A |  |
 |
Quadrant B |
|---|---|---|---|
| Quadrant D |  |
 |
Quadrant C |
| Plot type | Count rate plots | Images |
|---|---|---|
| Comparison with Poisson distribution Blue bars denote a histogram of data divided into 1 sec bins. Red curve is a Poisson curve with rate = median count rate of data. |
 |
 |
| Quadrant-wise count rates Data is divided into 100 sec bins |
 |
|
| Module-wise count rates for Quadrant A Data is divided into 100 sec bins |
 |
 |
| Module-wise count rates for Quadrant B Data is divided into 100 sec bins |
 |
 |
| Module-wise count rates for Quadrant C Data is divided into 100 sec bins |
 |
 |
| Module-wise count rates for Quadrant D Data is divided into 100 sec bins |
 |
 |
| Parameter | Plot |
|---|---|
| CZT HV Monitor |  |
| D_VDD |  |
| Temperature 1 |  |
| Veto HV Monitor |  |
| Veto LLD |  |
| Alpha Counter |  |
| _CPM_Rate |  |
| CZT Counter |  |
| +2.5 Volts monitor |  |
| +5 Volts monitor |  |
| _ROLL_ROT |  |
| _Roll_DEC |  |
| _Roll_RA |  |
| Veto Counter |  |