| Param | Original file | Final file |
|---|---|---|
| Filename | modeM0/AS1A05_082T09_9000002978_19977cztM0_level2.evt | modeM0/AS1A05_082T09_9000002978_19977cztM0_level2_quad_clean.evt |
| Size (bytes) | 343,195,200 | 38,871,360 |
| Size | 327.3 MB | 37.1 MB |
| Events in quadrant A | 5,039,240 | 146,983 |
| Events in quadrant B | 1,593,486 | 285,039 |
| Events in quadrant C | 1,970,512 | 264,548 |
| Events in quadrant D | 1,586,872 | 266,977 |
| Mode SS | |||
|---|---|---|---|
| Quadrant | BADHDUFLAG | Total packets | Discarded packets |
| A | 0 | 60 | 0 |
| B | 0 | 60 | 0 |
| C | 0 | 60 | 0 |
| D | 0 | 60 | 0 |
| Mode M0 | |||
|---|---|---|---|
| Quadrant | BADHDUFLAG | Total packets | Discarded packets |
| A | 0 | 17023 | 4 |
| B | 0 | 6504 | 1 |
| C | 0 | 7764 | 1 |
| D | 0 | 6605 | 1 |
| Mode M9 | |||
|---|---|---|---|
| Quadrant | BADHDUFLAG | Total packets | Discarded packets |
| A | 0 | 10 | 0 |
| B | 0 | 10 | 0 |
| C | 0 | 10 | 0 |
| D | 0 | 10 | 0 |
| Quadrant | Total seconds | Saturated seconds | Saturation percentage |
|---|---|---|---|
| A | 2984 | 1709 | 57.272118% |
| B | 2984 | 48 | 1.608579% |
| C | 2984 | 126 | 4.222520% |
| D | 2984 | 31 | 1.038874% |
Noise dominated data is calculated using 1-second bins in cleaned event files. If a bin has >2000 counts, and if more than 50% of those come from <1% of pixels, then it is considered to be noise-dominated and hence unusable.
| Quadrant | # 1 sec bins | Bins with >0 counts | Bins with >2000 counts | High rate bins dominated by noise | Noise dominated (total time) | Noise dominated (detector-on time) | Marked lightcurve |
|---|---|---|---|---|---|---|---|
| A | 3963 | 2983 | 1339 | 1339 | 33.79% | 44.89% | 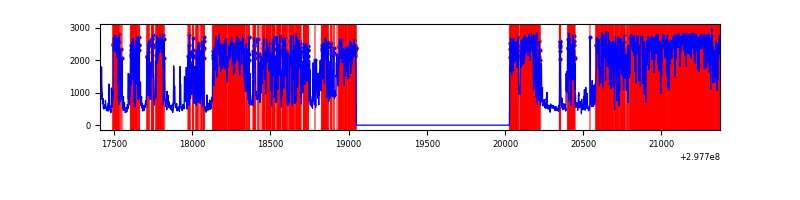 |
| B | 3964 | 2984 | 0 | 0 | 0.00% | 0.00% | 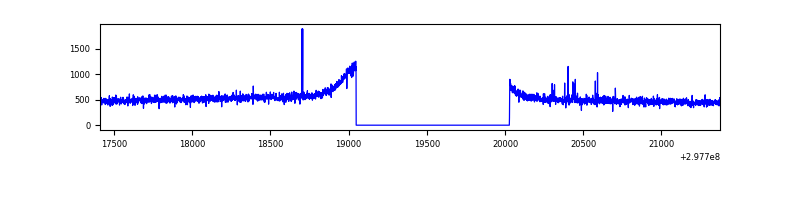 |
| C | 3964 | 2984 | 1 | 1 | 0.03% | 0.03% | 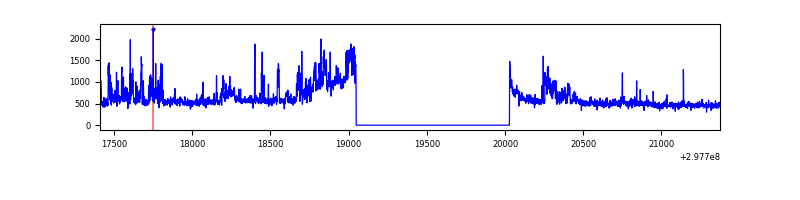 |
| D | 3964 | 2984 | 7 | 7 | 0.18% | 0.23% | 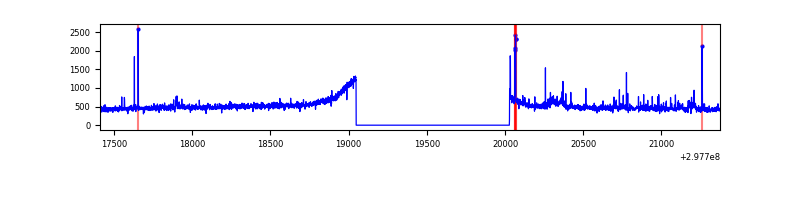 |
Top three noisy pixels from each quadrant. If the there are fewer than three noisy pixels in the level2.evt file, extra rows are filled as -1
| Pixel properties | Quadrant properties | ||||||
|---|---|---|---|---|---|---|---|
| Quadrant | DetID | PixID | Counts | Sigma | Mean | Median | Sigma |
| A | 14 | 238 | 4024833 | 75194.92 | 258 | 253 | 53.5 |
| A | 14 | 254 | 12205 | 223.31 | 258 | 253 | 53.5 |
| A | 11 | 29 | 7979 | 144.35 | 258 | 253 | 53.5 |
| B | 12 | 111 | 9321 | 112.43 | 403 | 393 | 79.4 |
| B | 11 | 111 | 8163 | 97.84 | 403 | 393 | 79.4 |
| B | 14 | 111 | 7230 | 86.09 | 403 | 393 | 79.4 |
| C | 9 | 221 | 296544 | 3246.38 | 383 | 385 | 91.2 |
| C | 3 | 233 | 117744 | 1286.45 | 383 | 385 | 91.2 |
| C | 14 | 238 | 59156 | 644.23 | 383 | 385 | 91.2 |
| D | 1 | 52 | 42293 | 420.65 | 401 | 390 | 99.6 |
| D | 12 | 218 | 30702 | 304.3 | 401 | 390 | 99.6 |
| D | 2 | 234 | 10697 | 103.47 | 401 | 390 | 99.6 |
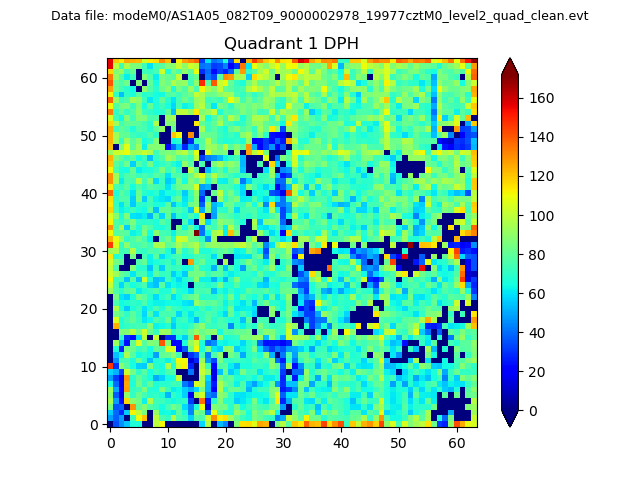
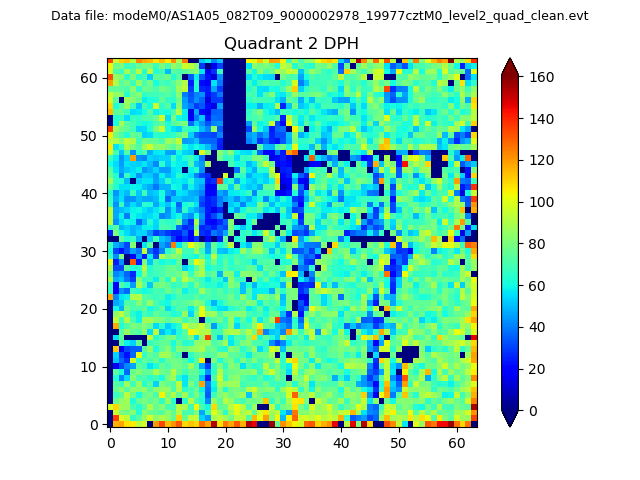
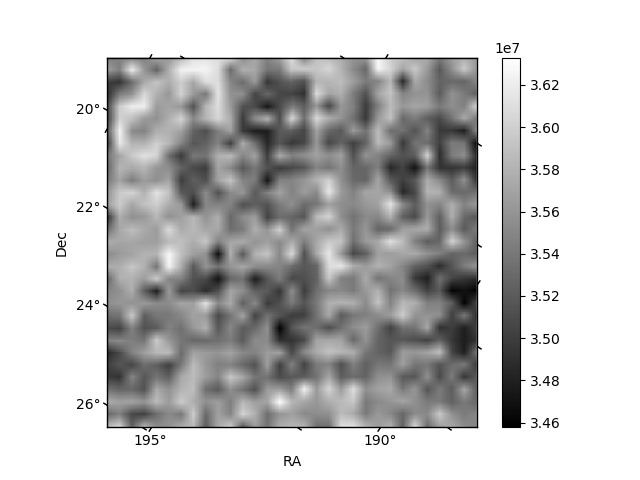
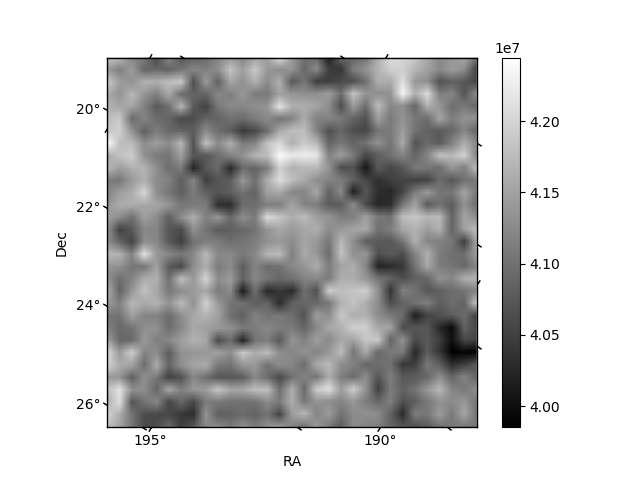
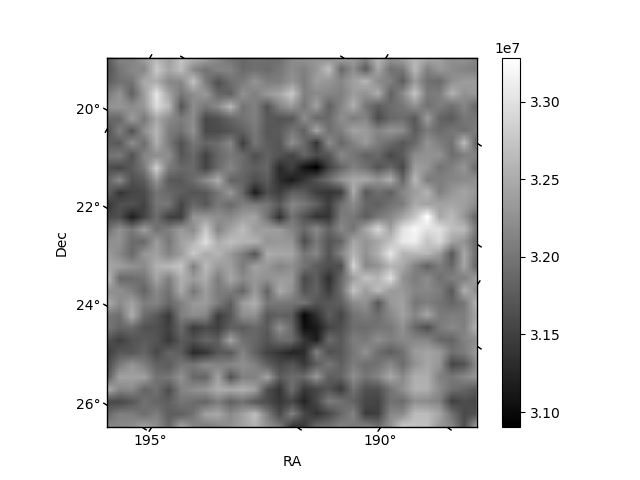
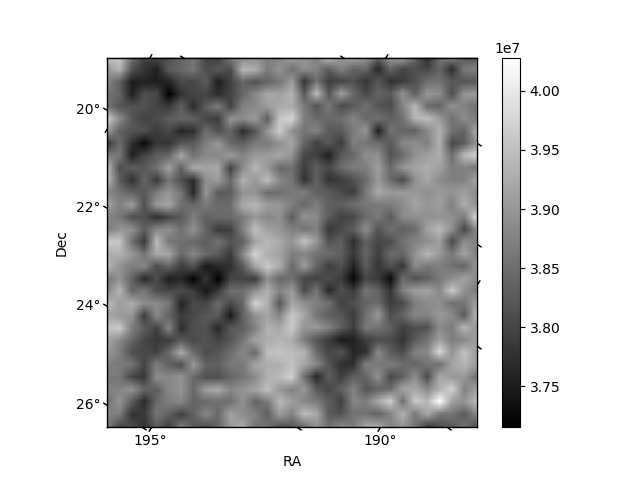
Histogram calculated using DETX and DETY for each event in the final _common_clean file
| Quadrant A |  |
 |
Quadrant B |
|---|---|---|---|
| Quadrant D |  |
 |
Quadrant C |
| Plot type | Count rate plots | Images |
|---|---|---|
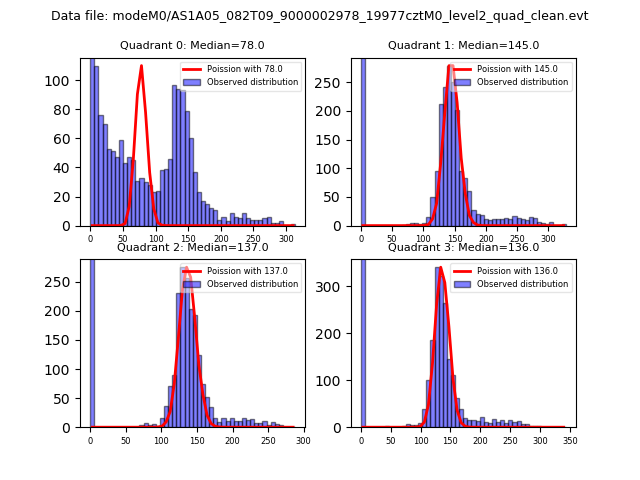
| Comparison with Poisson distribution Blue bars denote a histogram of data divided into 1 sec bins. Red curve is a Poisson curve with rate = median count rate of data. |
 |
 |
| Quadrant-wise count rates Data is divided into 100 sec bins |
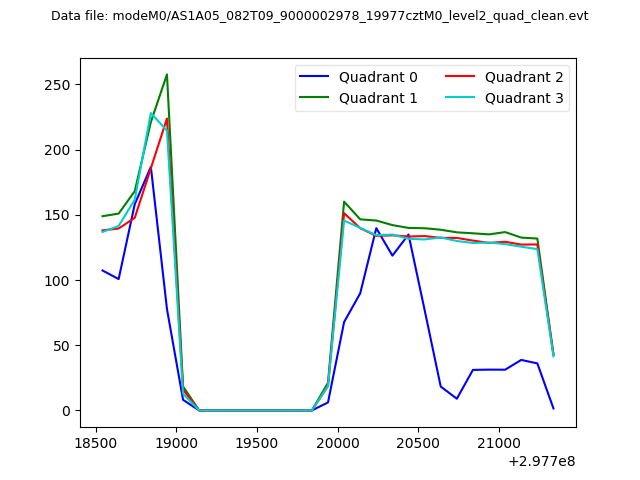 |
|
| Module-wise count rates for Quadrant A Data is divided into 100 sec bins |
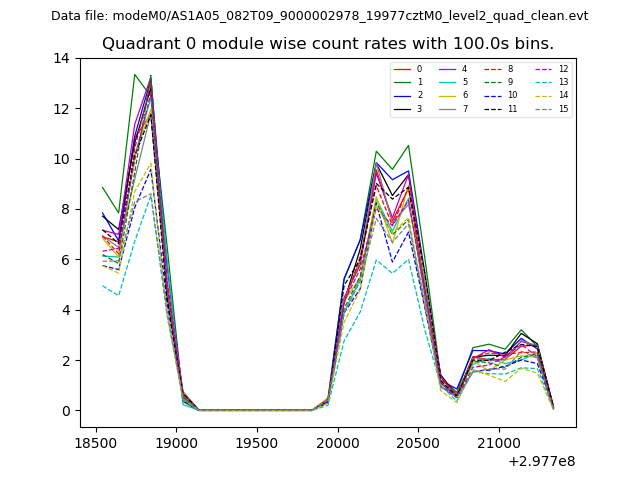 |
 |
| Module-wise count rates for Quadrant B Data is divided into 100 sec bins |
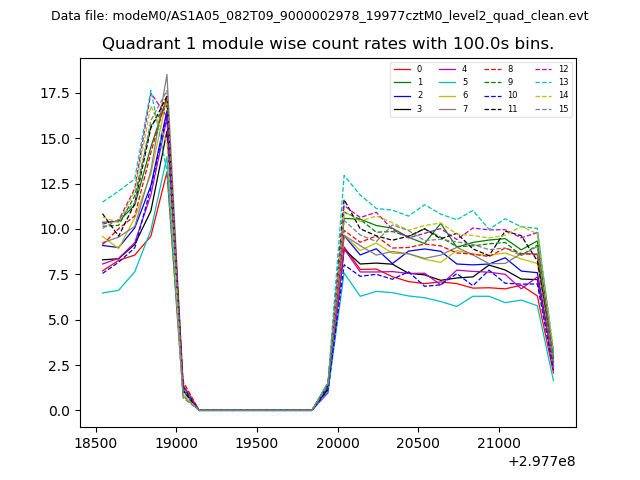 |
 |
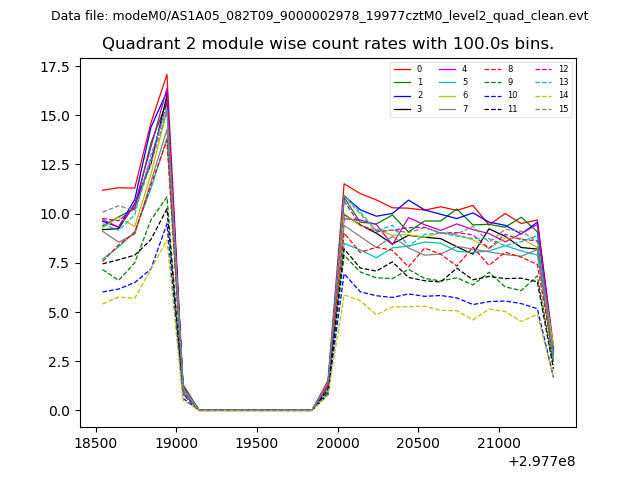
| Module-wise count rates for Quadrant C Data is divided into 100 sec bins |
 |
 |
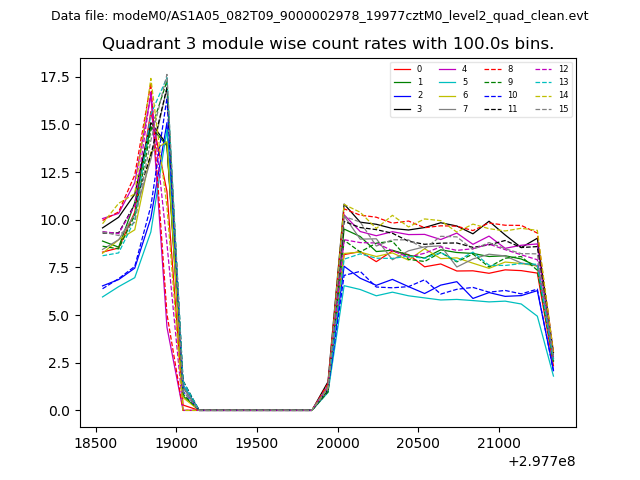
| Module-wise count rates for Quadrant D Data is divided into 100 sec bins |
 |
 |
| Parameter | Plot |
|---|---|
| CZT HV Monitor | 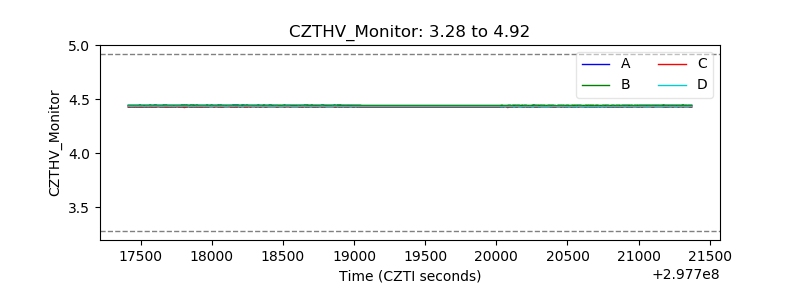 |
| D_VDD | 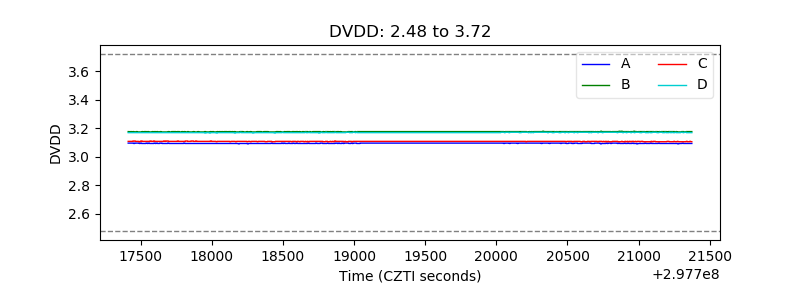 |
| Temperature 1 | 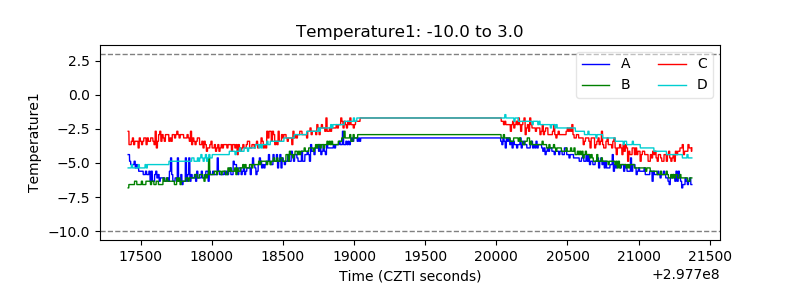 |
| Veto HV Monitor | 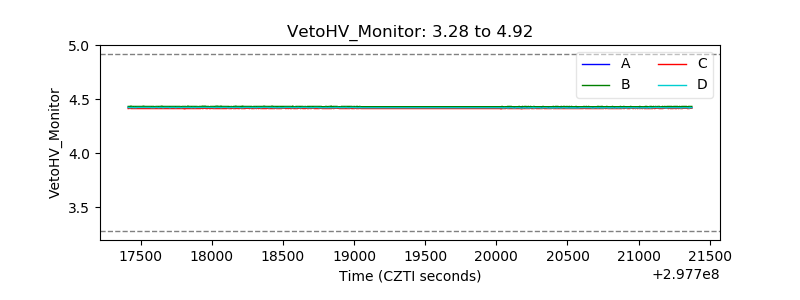 |
| Veto LLD | 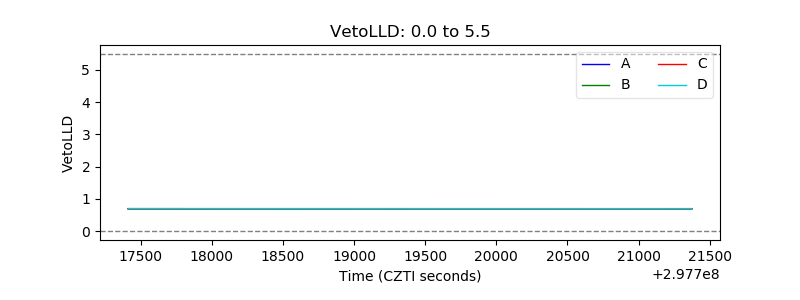 |
| Alpha Counter | 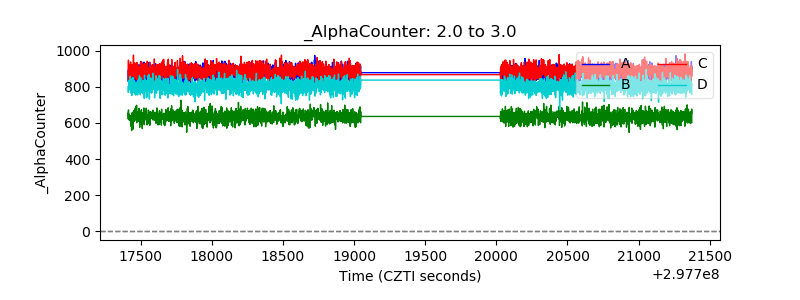 |
| _CPM_Rate | 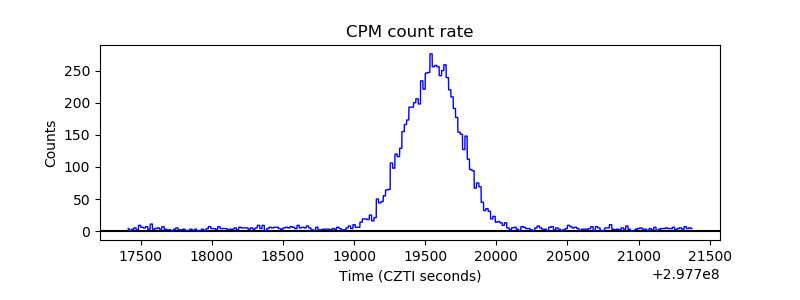 |
| CZT Counter | 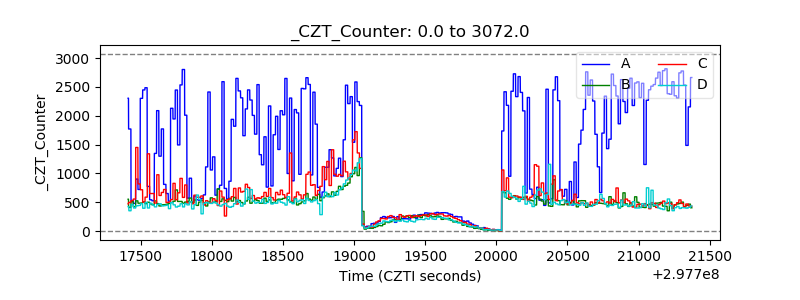 |
| +2.5 Volts monitor |  |
| +5 Volts monitor |  |
| _ROLL_ROT | 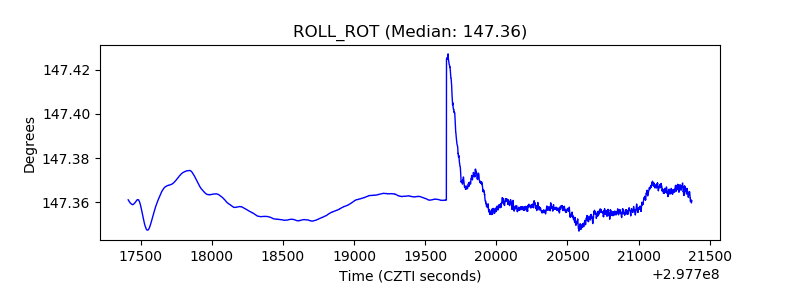 |
| _Roll_DEC | 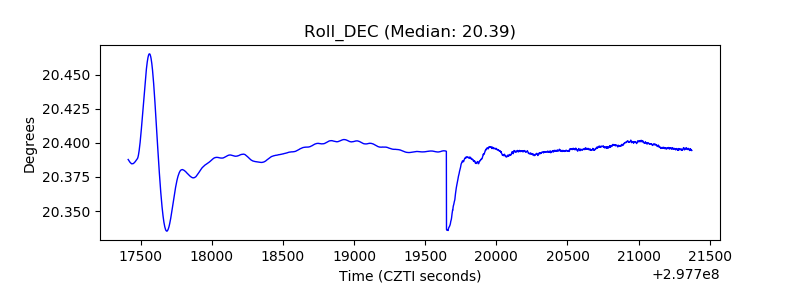 |
| _Roll_RA | 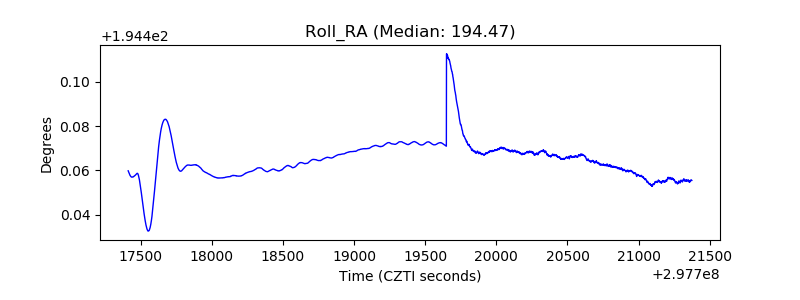 |
| Veto Counter | 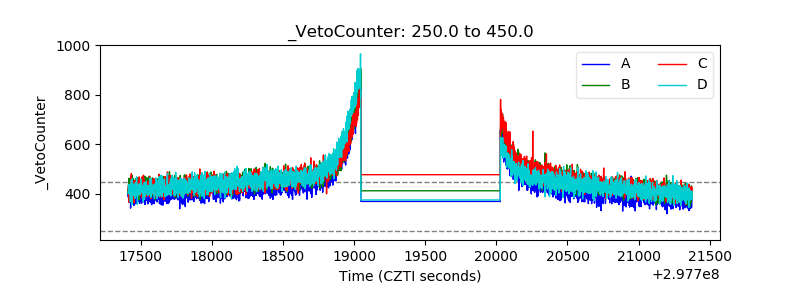 |