| Param | Original file | Final file |
|---|---|---|
| Filename | modeM0/AS1A05_082T09_9000002978_19978cztM0_level2.evt | modeM0/AS1A05_082T09_9000002978_19978cztM0_level2_quad_clean.evt |
| Size (bytes) | 844,948,800 | 89,533,440 |
| Size | 805.8 MB | 85.4 MB |
| Events in quadrant A | 14,045,126 | 164,917 |
| Events in quadrant B | 3,558,932 | 710,592 |
| Events in quadrant C | 3,785,651 | 664,788 |
| Events in quadrant D | 3,721,197 | 677,885 |
| Mode SS | |||
|---|---|---|---|
| Quadrant | BADHDUFLAG | Total packets | Discarded packets |
| A | 0 | 142 | 0 |
| B | 0 | 142 | 0 |
| C | 0 | 142 | 0 |
| D | 0 | 142 | 0 |
| Mode M0 | |||
|---|---|---|---|
| Quadrant | BADHDUFLAG | Total packets | Discarded packets |
| A | 0 | 46571 | 2 |
| B | 0 | 15260 | 2 |
| C | 0 | 15838 | 2 |
| D | 0 | 16075 | 2 |
| Mode M9 | |||
|---|---|---|---|
| Quadrant | BADHDUFLAG | Total packets | Discarded packets |
| A | 0 | 11 | 0 |
| B | 0 | 12 | 0 |
| C | 0 | 12 | 0 |
| D | 0 | 12 | 0 |
| Quadrant | Total seconds | Saturated seconds | Saturation percentage |
|---|---|---|---|
| A | 7055 | 6344 | 89.922041% |
| B | 7055 | 69 | 0.978030% |
| C | 7055 | 104 | 1.474132% |
| D | 7055 | 53 | 0.751240% |
Noise dominated data is calculated using 1-second bins in cleaned event files. If a bin has >2000 counts, and if more than 50% of those come from <1% of pixels, then it is considered to be noise-dominated and hence unusable.
| Quadrant | # 1 sec bins | Bins with >0 counts | Bins with >2000 counts | High rate bins dominated by noise | Noise dominated (total time) | Noise dominated (detector-on time) | Marked lightcurve |
|---|---|---|---|---|---|---|---|
| A | 7609 | 7054 | 3950 | 3950 | 51.91% | 56.00% | 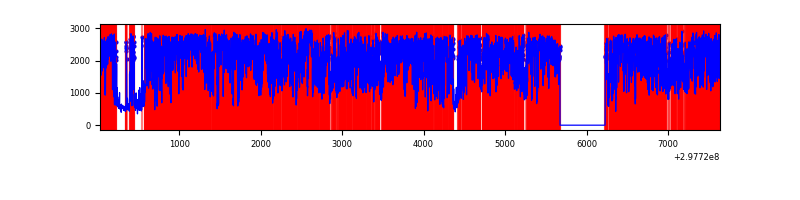 |
| B | 7610 | 7055 | 13 | 13 | 0.17% | 0.18% | 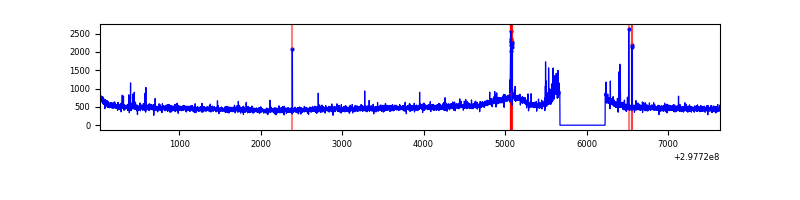 |
| C | 7610 | 7056 | 7 | 7 | 0.09% | 0.10% | 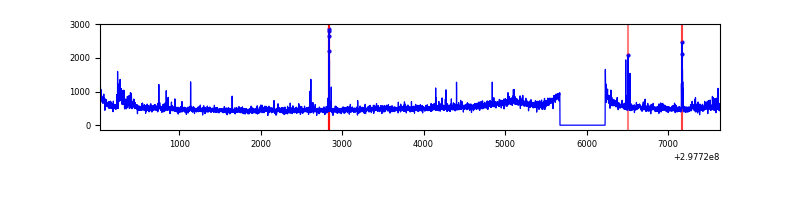 |
| D | 7610 | 7056 | 22 | 22 | 0.29% | 0.31% | 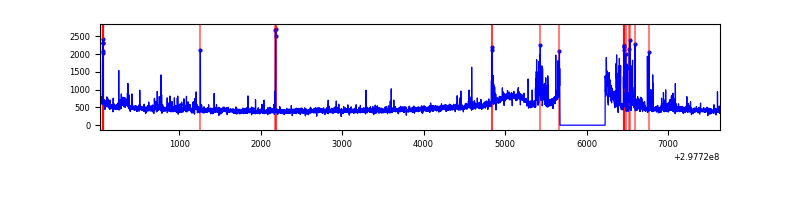 |
Top three noisy pixels from each quadrant. If the there are fewer than three noisy pixels in the level2.evt file, extra rows are filled as -1
| Pixel properties | Quadrant properties | ||||||
|---|---|---|---|---|---|---|---|
| Quadrant | DetID | PixID | Counts | Sigma | Mean | Median | Sigma |
| A | 14 | 238 | 12609871 | 266968.55 | 226 | 222 | 47.2 |
| A | 14 | 254 | 516476 | 10930.01 | 226 | 222 | 47.2 |
| A | 14 | 237 | 35981 | 757.08 | 226 | 222 | 47.2 |
| B | 3 | 64 | 32837 | 188.96 | 884 | 863 | 169.2 |
| B | 7 | 220 | 30226 | 173.53 | 884 | 863 | 169.2 |
| B | 12 | 111 | 19953 | 112.82 | 884 | 863 | 169.2 |
| C | 3 | 233 | 222938 | 1105.27 | 845 | 850 | 200.9 |
| C | 14 | 238 | 132775 | 656.56 | 845 | 850 | 200.9 |
| C | 9 | 221 | 112386 | 555.08 | 845 | 850 | 200.9 |
| D | 1 | 52 | 340986 | 1583.78 | 874 | 852 | 214.8 |
| D | 12 | 218 | 40922 | 186.58 | 874 | 852 | 214.8 |
| D | 2 | 234 | 28310 | 127.85 | 874 | 852 | 214.8 |
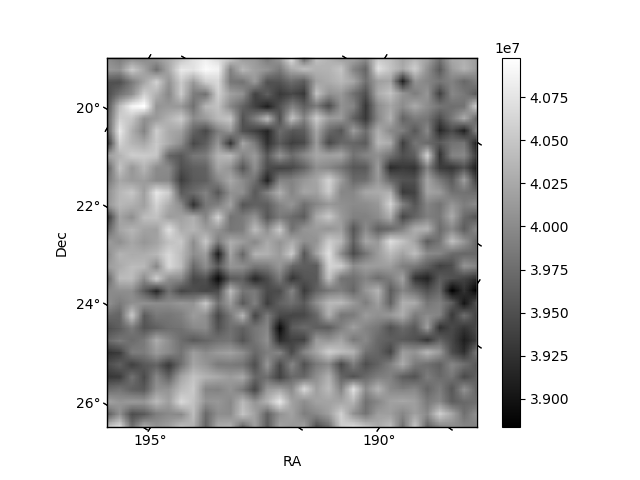
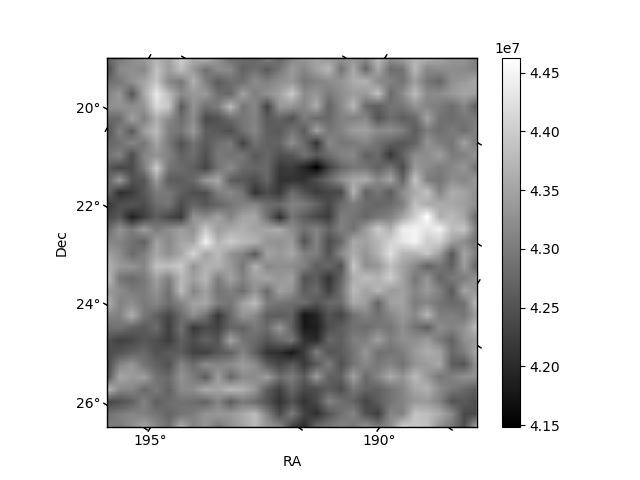
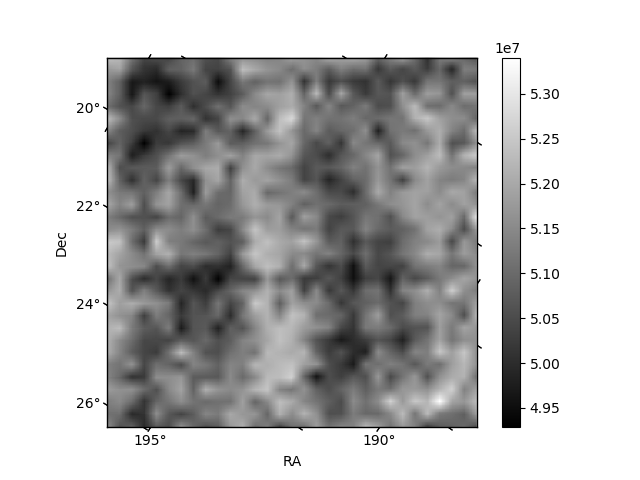
Histogram calculated using DETX and DETY for each event in the final _common_clean file
| Quadrant A | 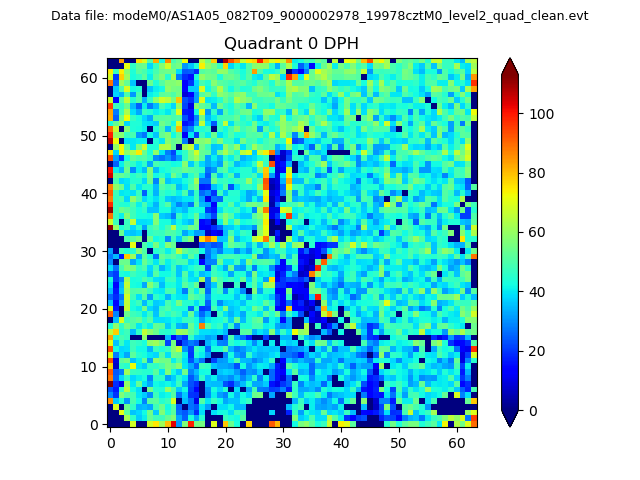 |
 |
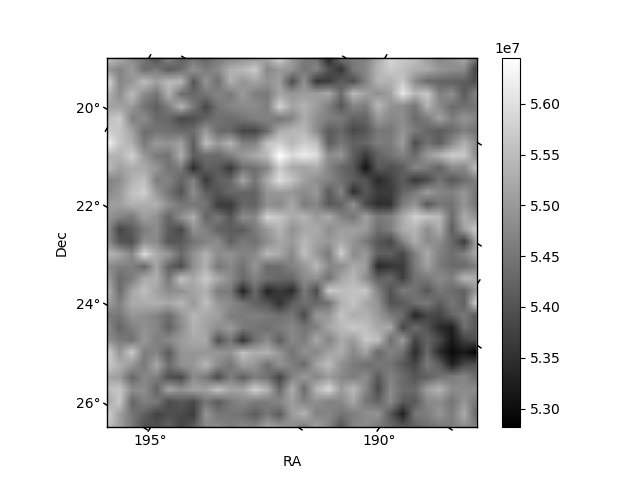
Quadrant B |
|---|---|---|---|
| Quadrant D | 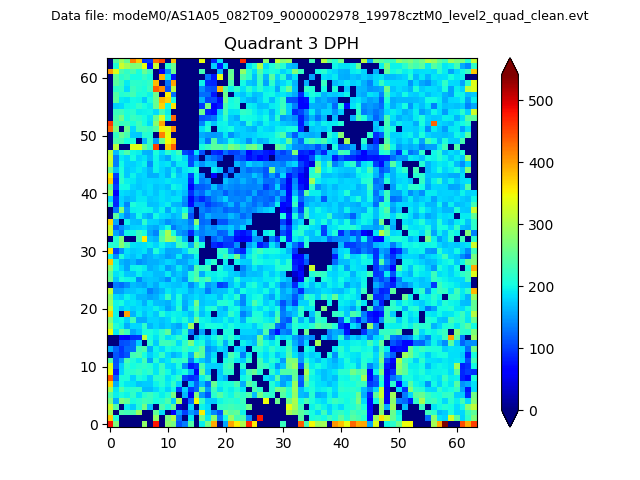 |
 |
Quadrant C |
| Plot type | Count rate plots | Images |
|---|---|---|
| Comparison with Poisson distribution Blue bars denote a histogram of data divided into 1 sec bins. Red curve is a Poisson curve with rate = median count rate of data. |
 |
 |
| Quadrant-wise count rates Data is divided into 100 sec bins |
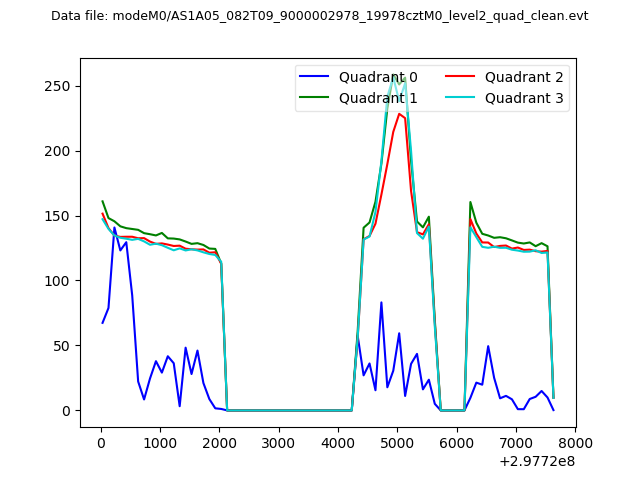 |
|
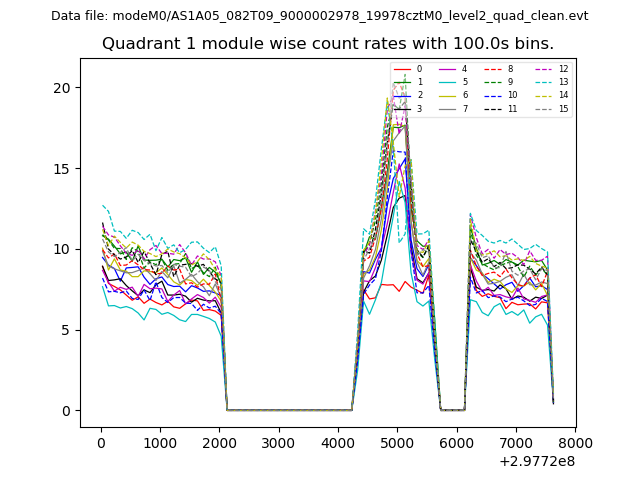
| Module-wise count rates for Quadrant A Data is divided into 100 sec bins |
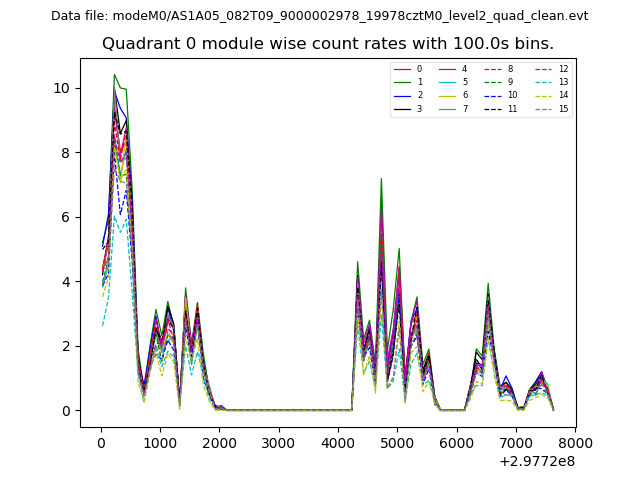 |
 |
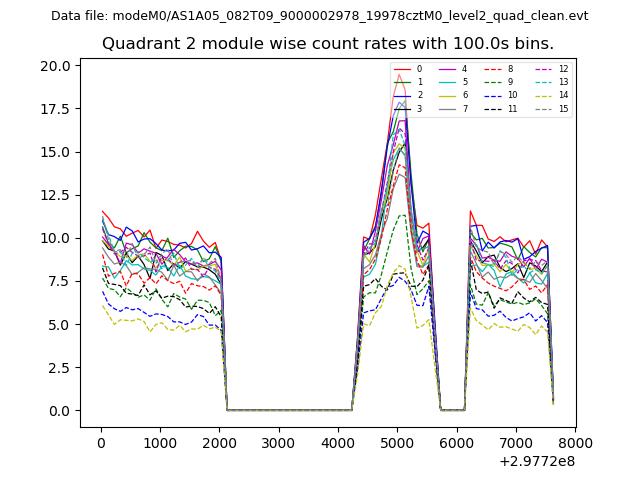
| Module-wise count rates for Quadrant B Data is divided into 100 sec bins |
 |
 |
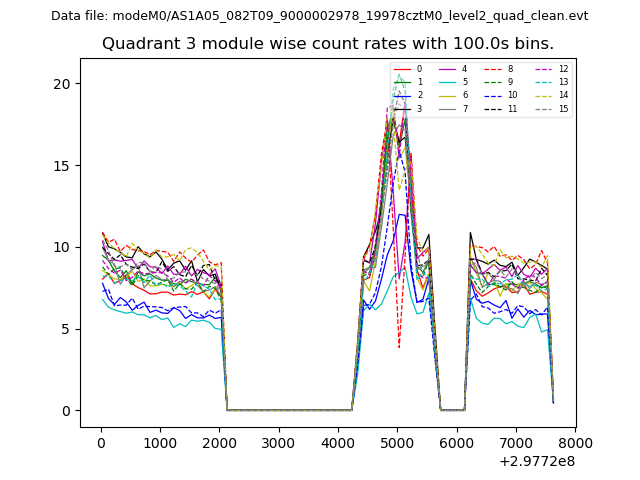
| Module-wise count rates for Quadrant C Data is divided into 100 sec bins |
 |
 |
| Module-wise count rates for Quadrant D Data is divided into 100 sec bins |
 |
 |
| Parameter | Plot |
|---|---|
| CZT HV Monitor | 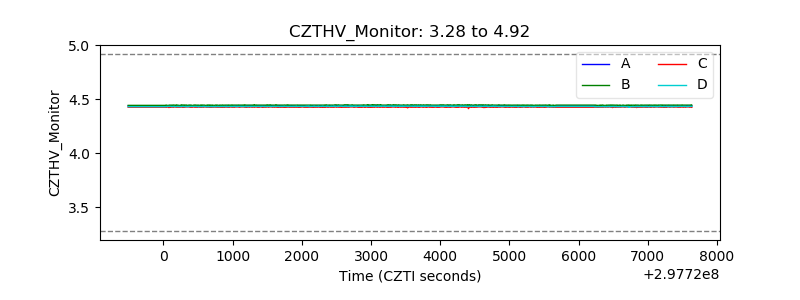 |
| D_VDD | 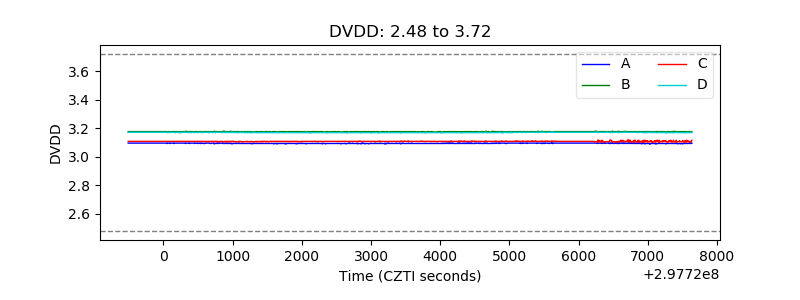 |
| Temperature 1 | 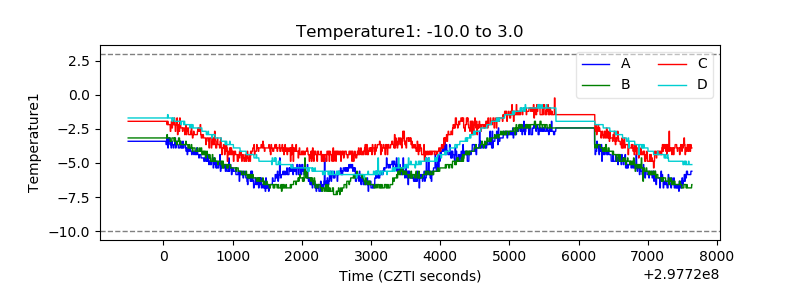 |
| Veto HV Monitor | 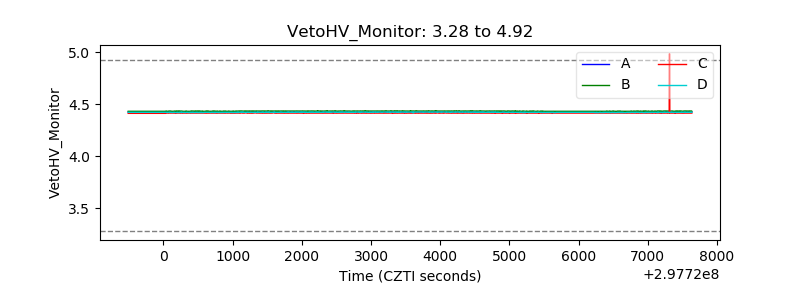 |
| Veto LLD | 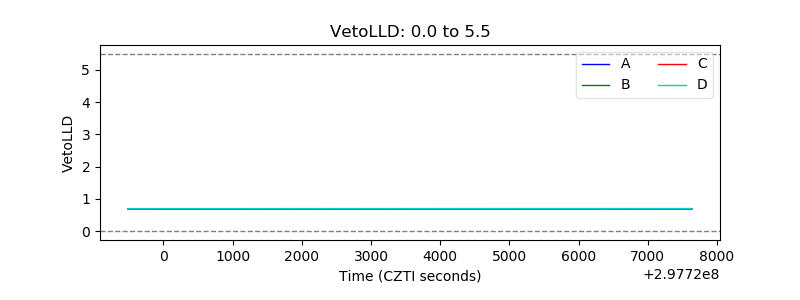 |
| Alpha Counter | 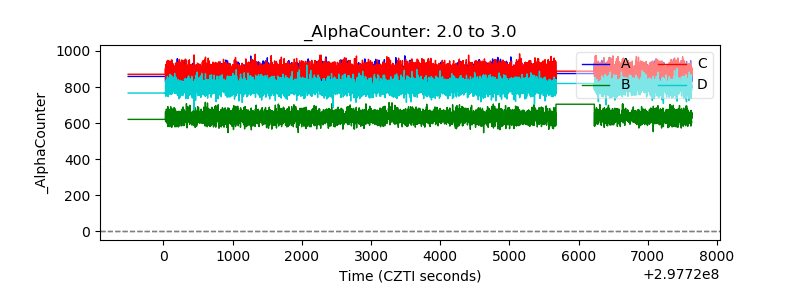 |
| _CPM_Rate | 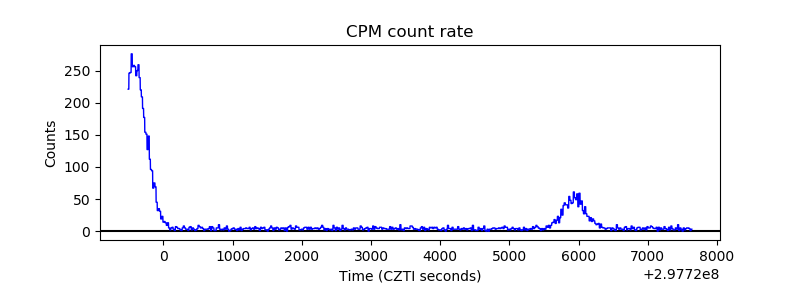 |
| CZT Counter |  |
| +2.5 Volts monitor |  |
| +5 Volts monitor |  |
| _ROLL_ROT | 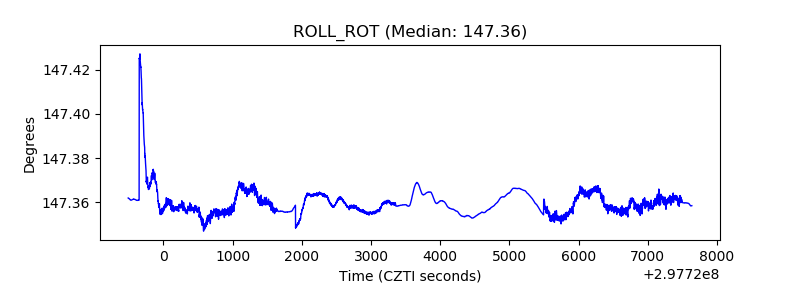 |
| _Roll_DEC | 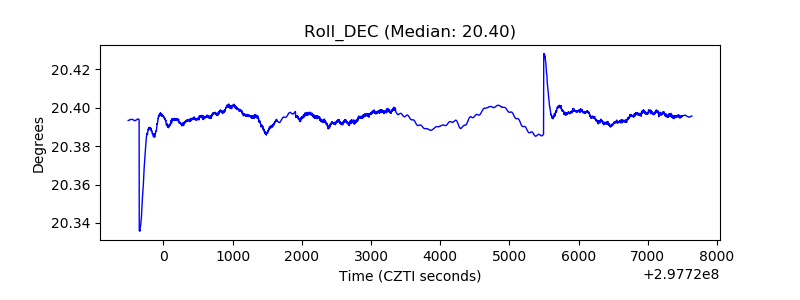 |
| _Roll_RA | 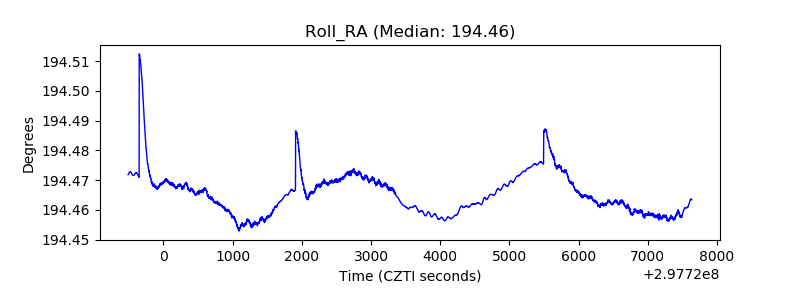 |
| Veto Counter | 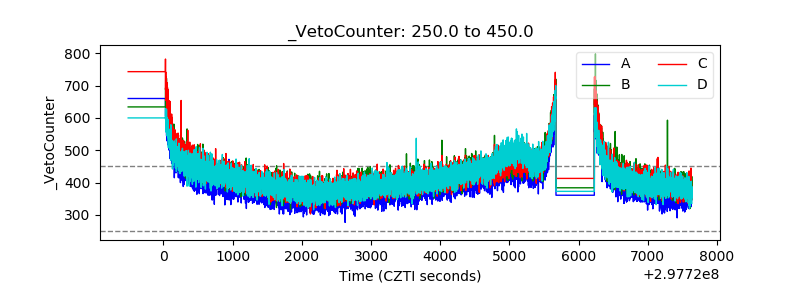 |