| Param | Original file | Final file |
|---|---|---|
| Filename | modeM0/AS1A05_082T09_9000002978_19980cztM0_level2.evt | modeM0/AS1A05_082T09_9000002978_19980cztM0_level2_quad_clean.evt |
| Size (bytes) | 882,276,480 | 77,140,800 |
| Size | 841.4 MB | 73.6 MB |
| Events in quadrant A | 14,943,336 | 142,230 |
| Events in quadrant B | 3,485,641 | 579,196 |
| Events in quadrant C | 3,939,692 | 554,455 |
| Events in quadrant D | 3,853,345 | 546,527 |
| Mode SS | |||
|---|---|---|---|
| Quadrant | BADHDUFLAG | Total packets | Discarded packets |
| A | 0 | 148 | 0 |
| B | 0 | 148 | 0 |
| C | 0 | 148 | 0 |
| D | 0 | 148 | 0 |
| Mode M0 | |||
|---|---|---|---|
| Quadrant | BADHDUFLAG | Total packets | Discarded packets |
| A | 0 | 49386 | 1 |
| B | 0 | 15053 | 1 |
| C | 0 | 16269 | 1 |
| D | 0 | 16618 | 1 |
| Mode M9 | |||
|---|---|---|---|
| Quadrant | BADHDUFLAG | Total packets | Discarded packets |
| A | 0 | 4 | 0 |
| B | 0 | 4 | 0 |
| C | 0 | 4 | 0 |
| D | 0 | 4 | 0 |
| Quadrant | Total seconds | Saturated seconds | Saturation percentage |
|---|---|---|---|
| A | 7352 | 5841 | 79.447769% |
| B | 7352 | 83 | 1.128945% |
| C | 7352 | 113 | 1.536997% |
| D | 7352 | 112 | 1.523395% |
Noise dominated data is calculated using 1-second bins in cleaned event files. If a bin has >2000 counts, and if more than 50% of those come from <1% of pixels, then it is considered to be noise-dominated and hence unusable.
| Quadrant | # 1 sec bins | Bins with >0 counts | Bins with >2000 counts | High rate bins dominated by noise | Noise dominated (total time) | Noise dominated (detector-on time) | Marked lightcurve |
|---|---|---|---|---|---|---|---|
| A | 7666 | 7351 | 4803 | 4803 | 62.65% | 65.34% | 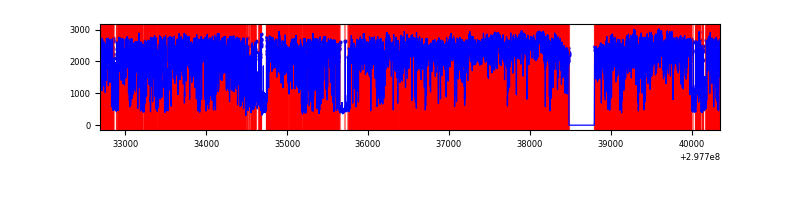 |
| B | 7667 | 7352 | 0 | 0 | 0.00% | 0.00% | 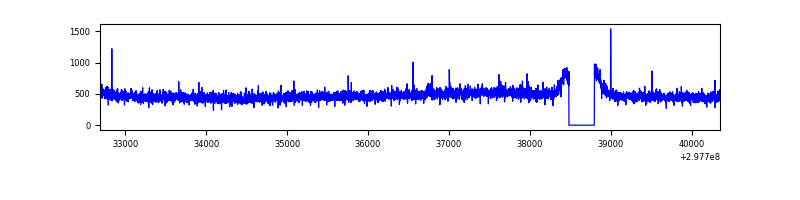 |
| C | 7667 | 7352 | 3 | 3 | 0.04% | 0.04% | 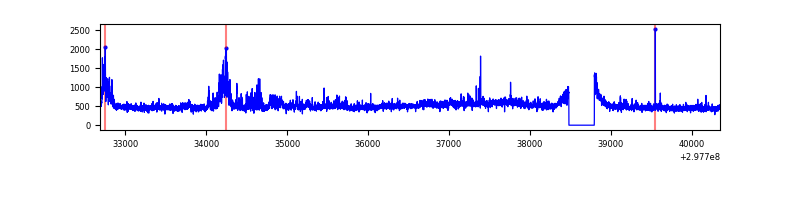 |
| D | 7667 | 7352 | 44 | 44 | 0.57% | 0.60% | 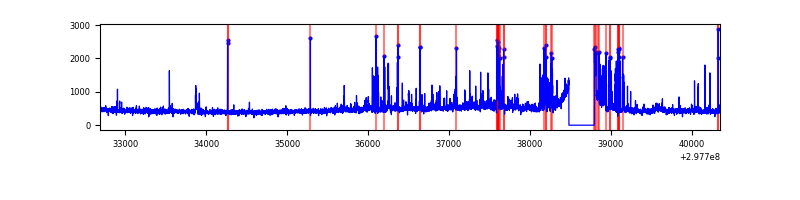 |
Top three noisy pixels from each quadrant. If the there are fewer than three noisy pixels in the level2.evt file, extra rows are filled as -1
| Pixel properties | Quadrant properties | ||||||
|---|---|---|---|---|---|---|---|
| Quadrant | DetID | PixID | Counts | Sigma | Mean | Median | Sigma |
| A | 14 | 238 | 12999849 | 194460.55 | 325 | 318 | 66.8 |
| A | 14 | 254 | 643084 | 9615.16 | 325 | 318 | 66.8 |
| A | 14 | 237 | 45436 | 674.92 | 325 | 318 | 66.8 |
| B | 12 | 111 | 20988 | 118.21 | 879 | 856 | 170.3 |
| B | 11 | 111 | 18358 | 102.77 | 879 | 856 | 170.3 |
| B | 14 | 111 | 16242 | 90.34 | 879 | 856 | 170.3 |
| C | 3 | 233 | 415518 | 2080.59 | 849 | 856 | 199.3 |
| C | 14 | 238 | 132236 | 659.21 | 849 | 856 | 199.3 |
| C | 9 | 221 | 73977 | 366.89 | 849 | 856 | 199.3 |
| D | 1 | 52 | 467242 | 2230.0 | 856 | 831 | 209.2 |
| D | 12 | 218 | 113043 | 536.51 | 856 | 831 | 209.2 |
| D | 2 | 234 | 29783 | 138.42 | 856 | 831 | 209.2 |
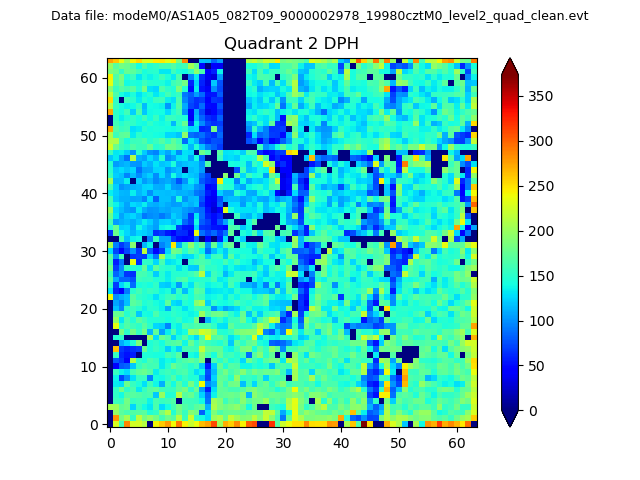
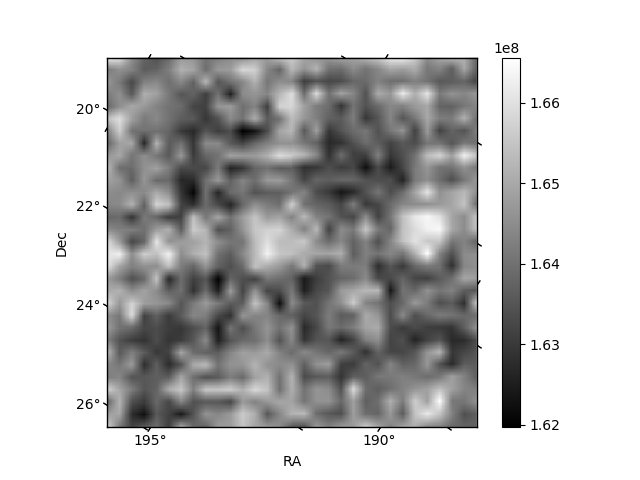
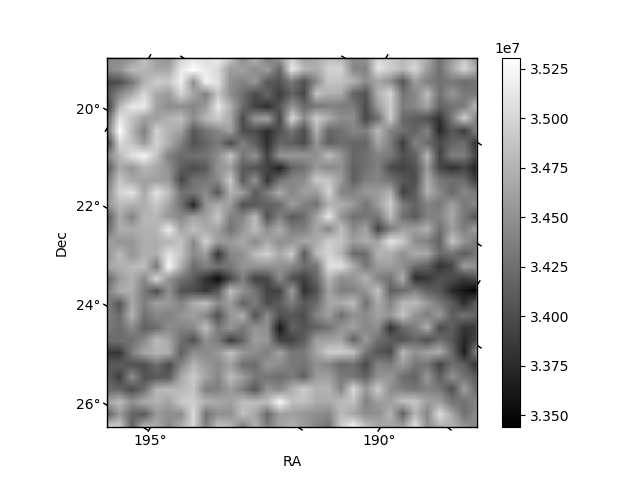
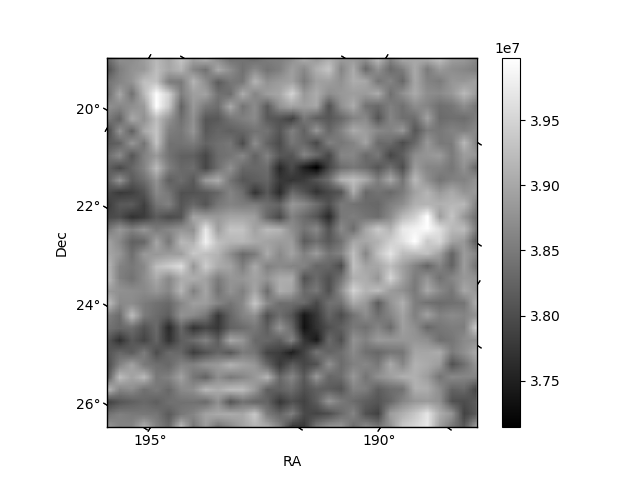
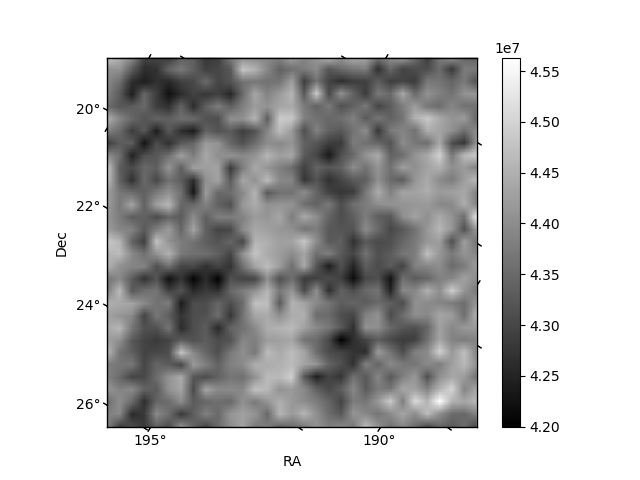
Histogram calculated using DETX and DETY for each event in the final _common_clean file
| Quadrant A | 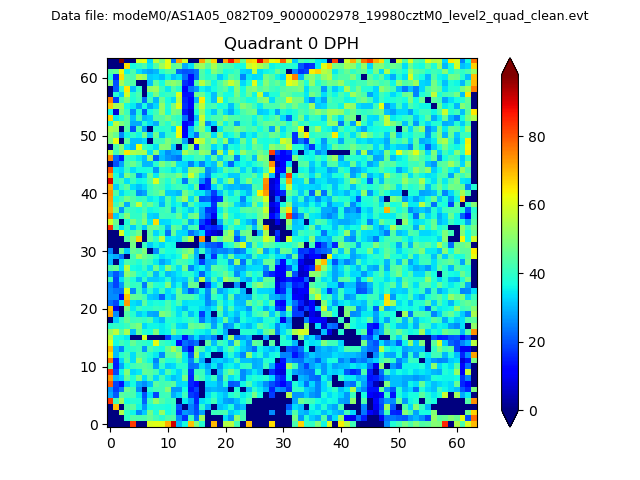 |
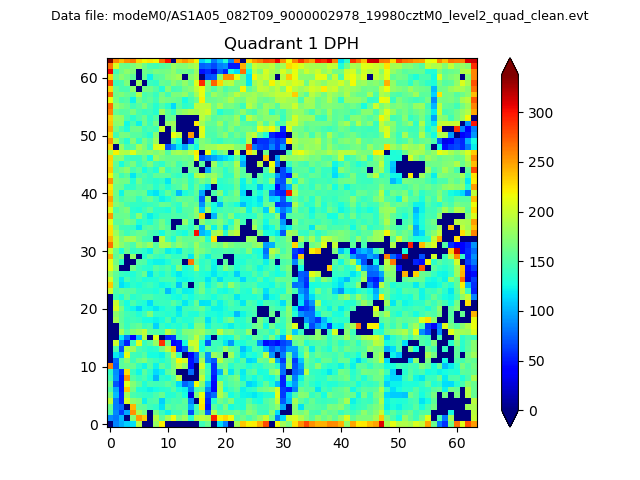 |
Quadrant B |
|---|---|---|---|
| Quadrant D | 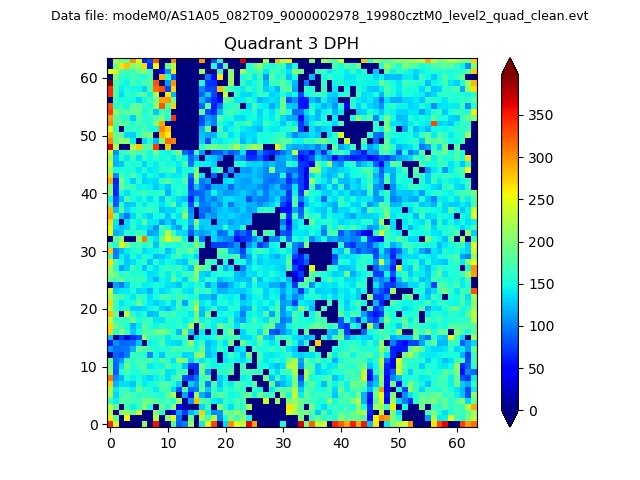 |
 |
Quadrant C |
| Plot type | Count rate plots | Images |
|---|---|---|
| Comparison with Poisson distribution Blue bars denote a histogram of data divided into 1 sec bins. Red curve is a Poisson curve with rate = median count rate of data. |
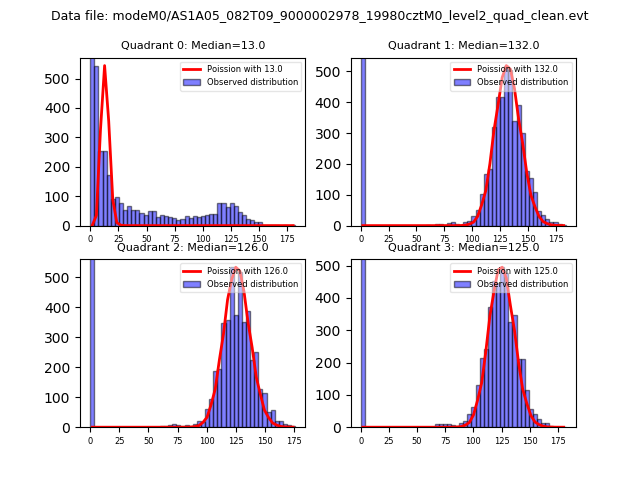 |
 |
| Quadrant-wise count rates Data is divided into 100 sec bins |
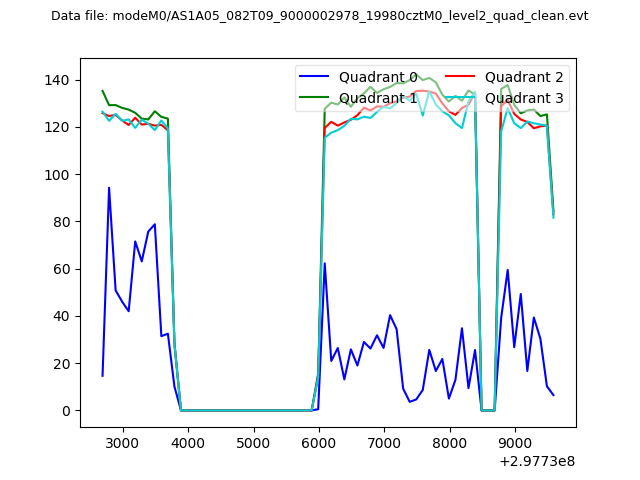 |
|
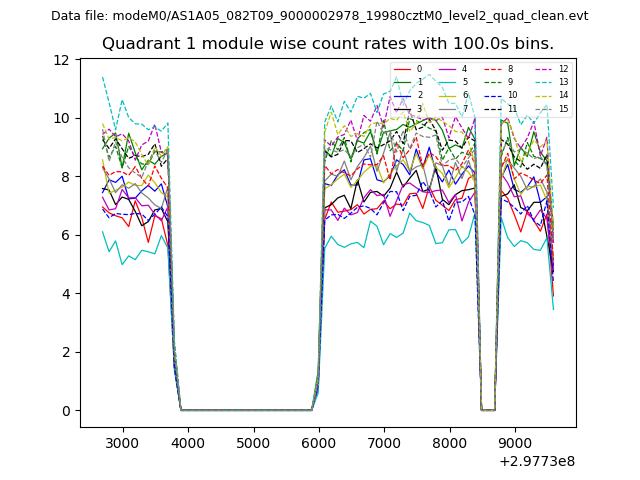
| Module-wise count rates for Quadrant A Data is divided into 100 sec bins |
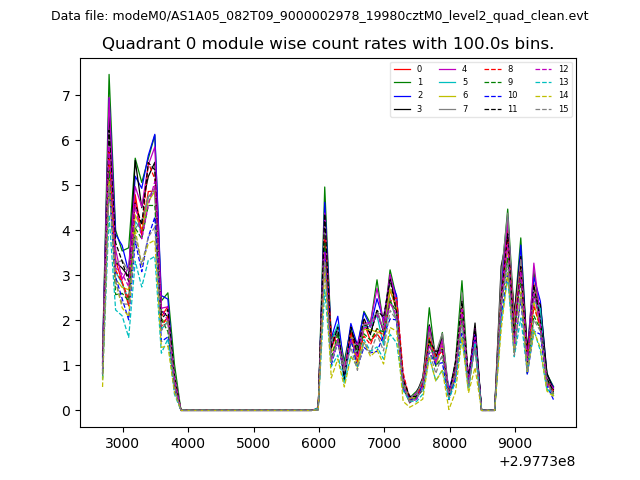 |
 |
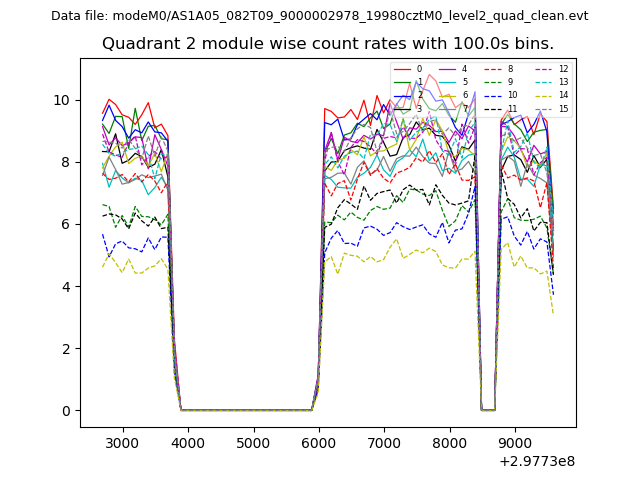
| Module-wise count rates for Quadrant B Data is divided into 100 sec bins |
 |
 |
| Module-wise count rates for Quadrant C Data is divided into 100 sec bins |
 |
 |
| Module-wise count rates for Quadrant D Data is divided into 100 sec bins |
 |
 |
| Parameter | Plot |
|---|---|
| CZT HV Monitor | 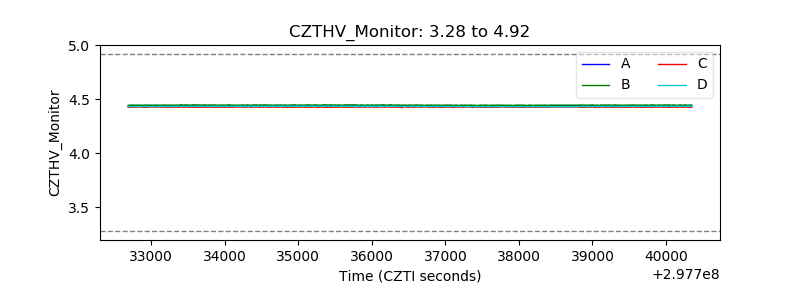 |
| D_VDD | 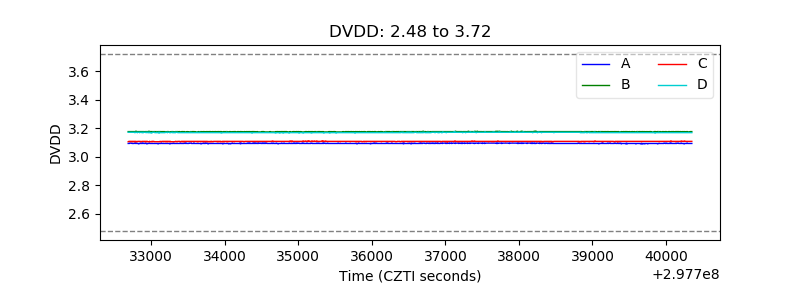 |
| Temperature 1 | 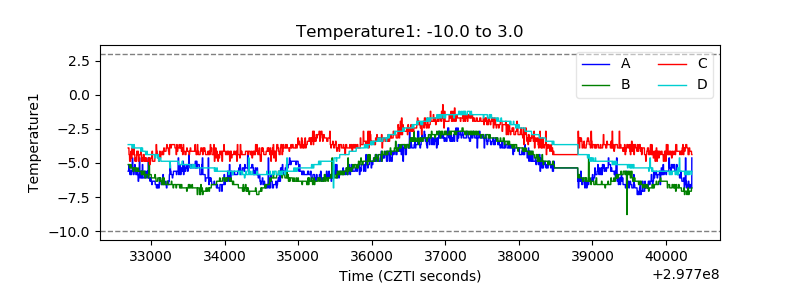 |
| Veto HV Monitor | 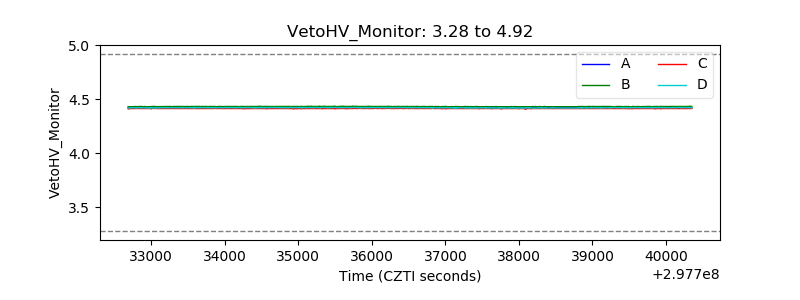 |
| Veto LLD | 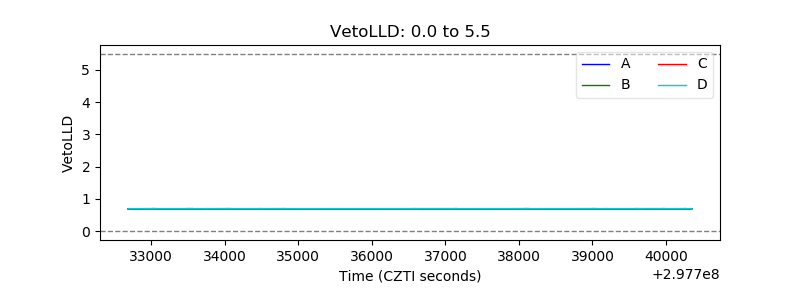 |
| Alpha Counter | 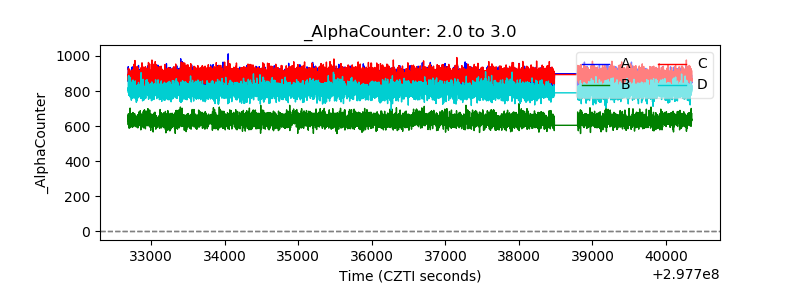 |
| _CPM_Rate | 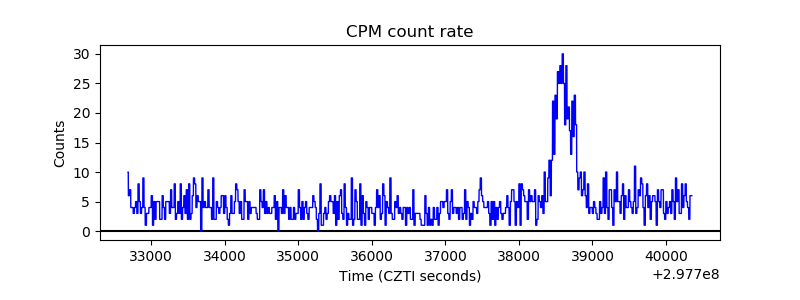 |
| CZT Counter | 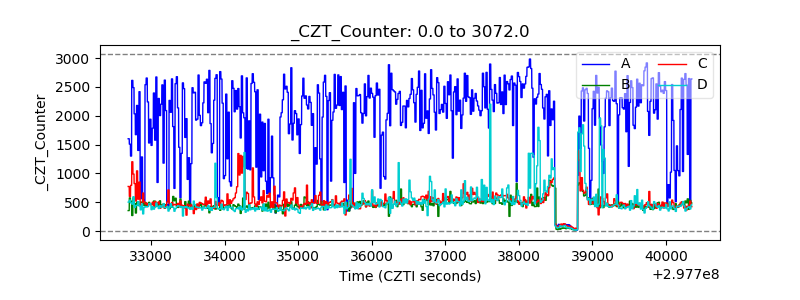 |
| +2.5 Volts monitor |  |
| +5 Volts monitor | 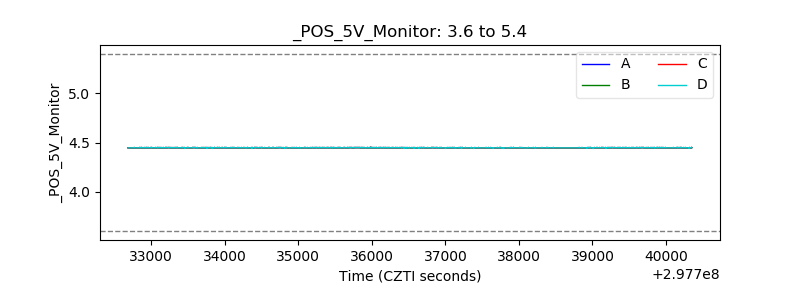 |
| _ROLL_ROT | 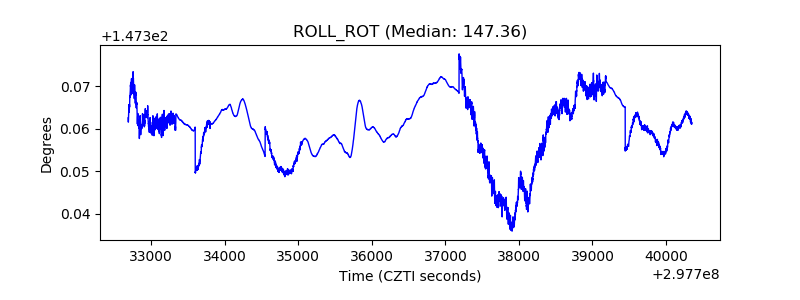 |
| _Roll_DEC | 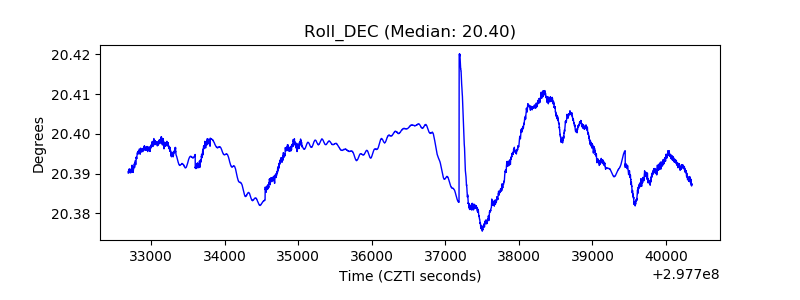 |
| _Roll_RA | 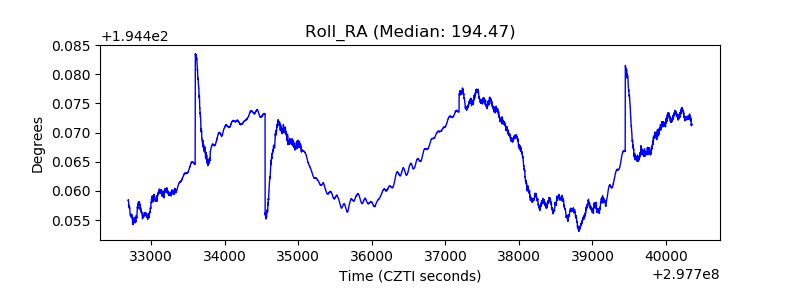 |
| Veto Counter | 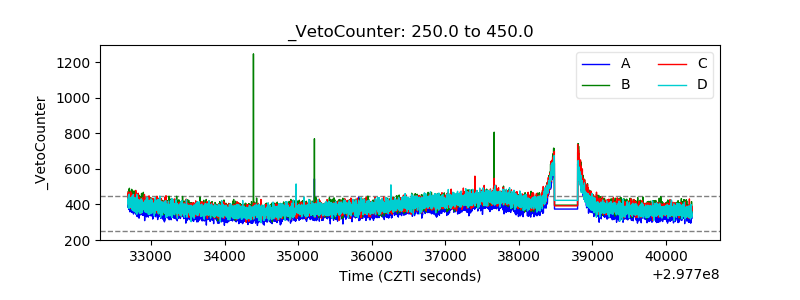 |