| Param | Original file | Final file |
|---|---|---|
| Filename | modeM0/AS1A05_082T09_9000002978_19983cztM0_level2.evt | modeM0/AS1A05_082T09_9000002978_19983cztM0_level2_quad_clean.evt |
| Size (bytes) | 1,866,277,440 | 194,181,120 |
| Size | 1.7 GB | 185.2 MB |
| Events in quadrant A | 28,912,877 | 729,194 |
| Events in quadrant B | 8,328,072 | 1,370,883 |
| Events in quadrant C | 8,733,532 | 1,307,141 |
| Events in quadrant D | 9,386,727 | 1,285,655 |
| Mode SS | |||
|---|---|---|---|
| Quadrant | BADHDUFLAG | Total packets | Discarded packets |
| A | 0 | 348 | 0 |
| B | 0 | 348 | 0 |
| C | 0 | 348 | 0 |
| D | 0 | 348 | 0 |
| Mode M0 | |||
|---|---|---|---|
| Quadrant | BADHDUFLAG | Total packets | Discarded packets |
| A | 0 | 97415 | 3 |
| B | 0 | 35551 | 3 |
| C | 0 | 36521 | 3 |
| D | 0 | 39529 | 3 |
| Mode M9 | |||
|---|---|---|---|
| Quadrant | BADHDUFLAG | Total packets | Discarded packets |
| A | 0 | 15 | 0 |
| B | 0 | 15 | 0 |
| C | 0 | 15 | 0 |
| D | 0 | 15 | 0 |
| Quadrant | Total seconds | Saturated seconds | Saturation percentage |
|---|---|---|---|
| A | 17191 | 9769 | 56.826246% |
| B | 17192 | 239 | 1.390181% |
| C | 17192 | 294 | 1.710098% |
| D | 17192 | 336 | 1.954397% |
Noise dominated data is calculated using 1-second bins in cleaned event files. If a bin has >2000 counts, and if more than 50% of those come from <1% of pixels, then it is considered to be noise-dominated and hence unusable.
| Quadrant | # 1 sec bins | Bins with >0 counts | Bins with >2000 counts | High rate bins dominated by noise | Noise dominated (total time) | Noise dominated (detector-on time) | Marked lightcurve |
|---|---|---|---|---|---|---|---|
| A | 18625 | 17190 | 8609 | 8609 | 46.22% | 50.08% | 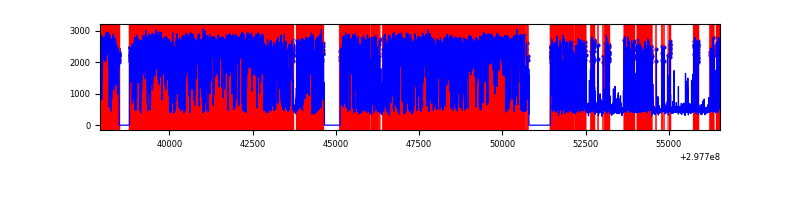 |
| B | 18627 | 17192 | 12 | 12 | 0.06% | 0.07% | 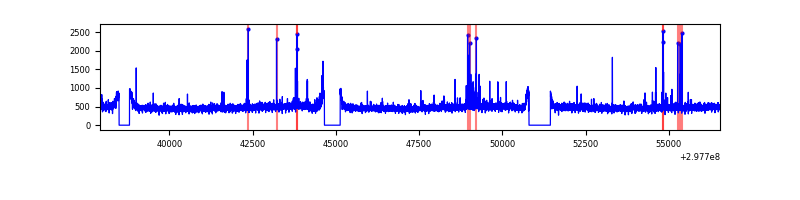 |
| C | 18627 | 17192 | 24 | 24 | 0.13% | 0.14% | 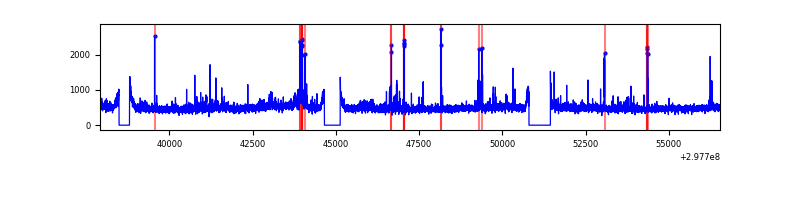 |
| D | 18627 | 17192 | 195 | 195 | 1.05% | 1.13% | 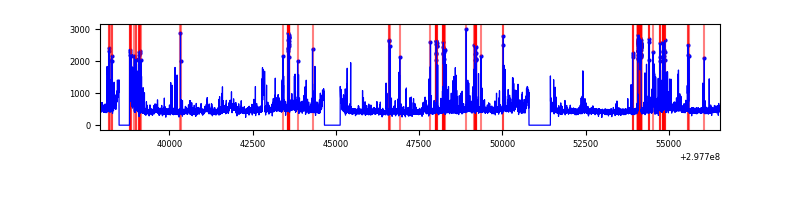 |
Top three noisy pixels from each quadrant. If the there are fewer than three noisy pixels in the level2.evt file, extra rows are filled as -1
| Pixel properties | Quadrant properties | ||||||
|---|---|---|---|---|---|---|---|
| Quadrant | DetID | PixID | Counts | Sigma | Mean | Median | Sigma |
| A | 14 | 238 | 23627549 | 93711.43 | 1254 | 1228 | 252.1 |
| A | 14 | 254 | 392555 | 1552.16 | 1254 | 1228 | 252.1 |
| A | 10 | 253 | 38144 | 146.42 | 1254 | 1228 | 252.1 |
| B | 7 | 220 | 50556 | 122.53 | 2070 | 2013 | 396.2 |
| B | 12 | 111 | 49682 | 120.32 | 2070 | 2013 | 396.2 |
| B | 11 | 111 | 43591 | 104.95 | 2070 | 2013 | 396.2 |
| C | 3 | 233 | 355182 | 754.96 | 1994 | 2009 | 467.8 |
| C | 14 | 238 | 309323 | 656.93 | 1994 | 2009 | 467.8 |
| C | 9 | 221 | 233231 | 494.27 | 1994 | 2009 | 467.8 |
| D | 1 | 52 | 1402048 | 2845.22 | 2020 | 1959 | 492.1 |
| D | 12 | 218 | 192517 | 387.25 | 2020 | 1959 | 492.1 |
| D | 2 | 234 | 71170 | 140.65 | 2020 | 1959 | 492.1 |
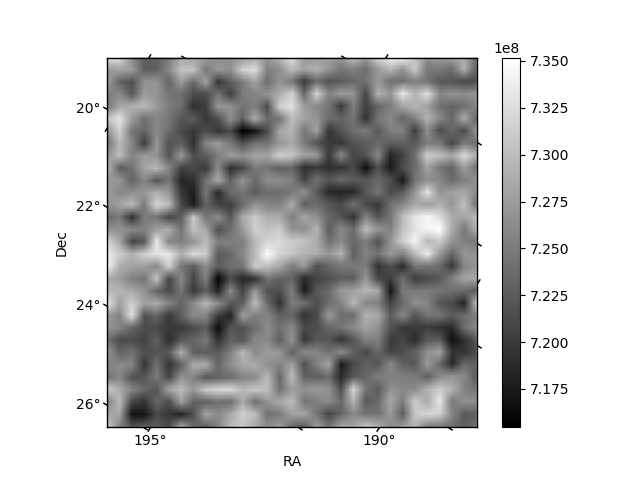
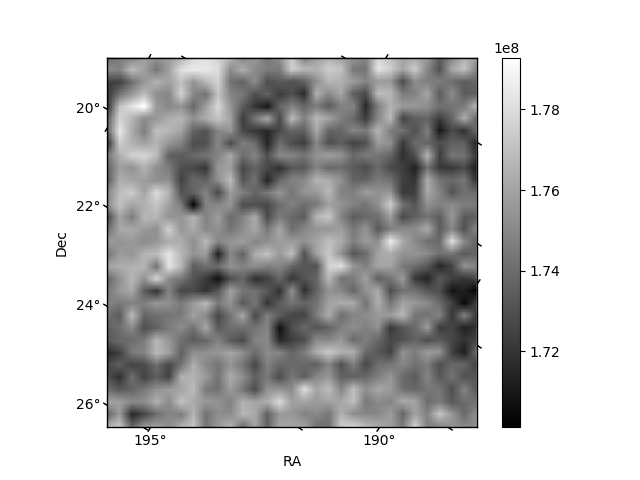
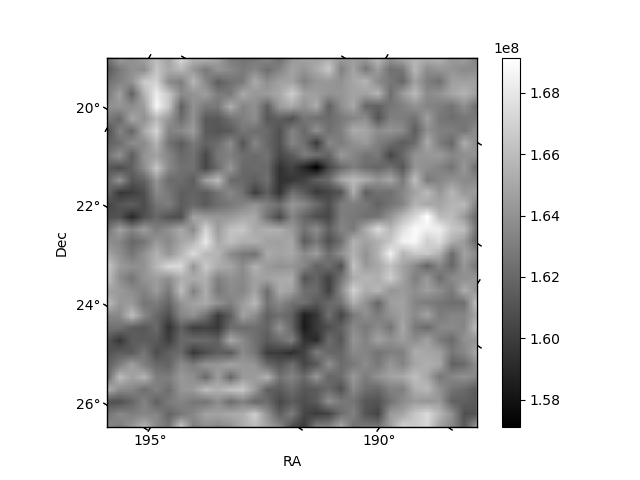
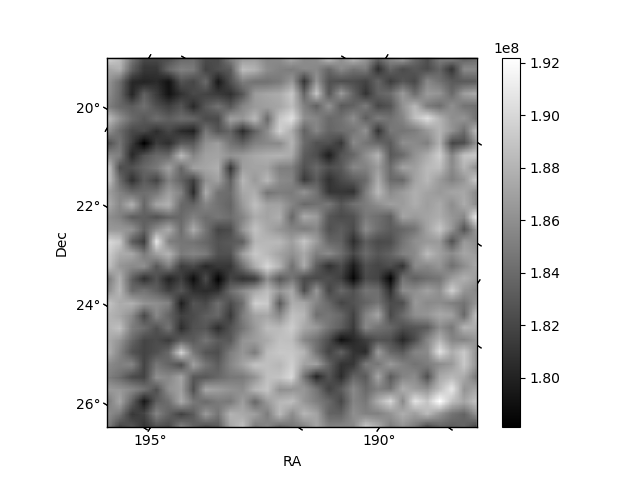
Histogram calculated using DETX and DETY for each event in the final _common_clean file
| Quadrant A | 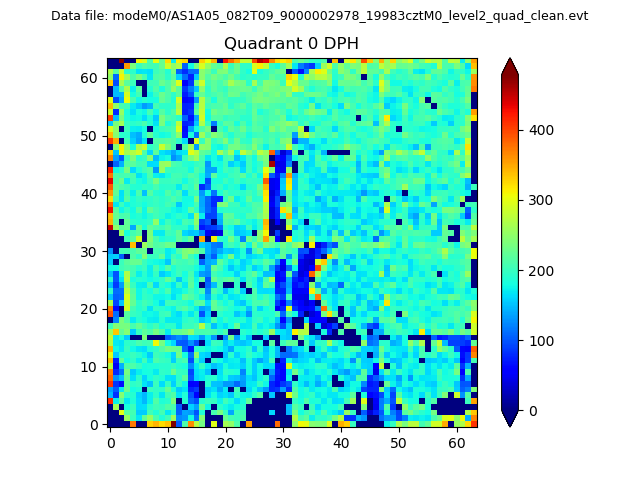 |
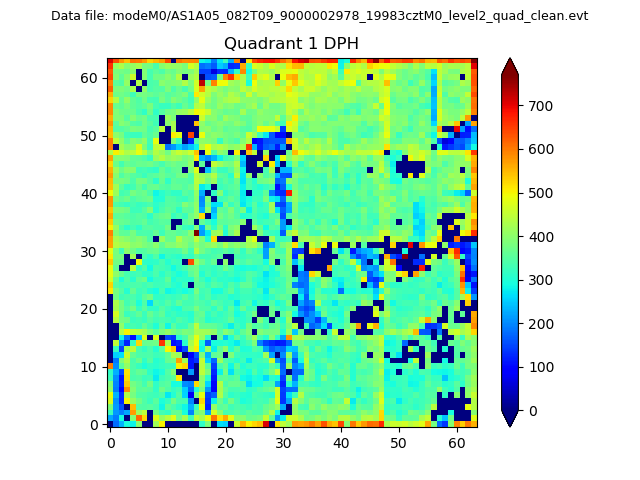 |
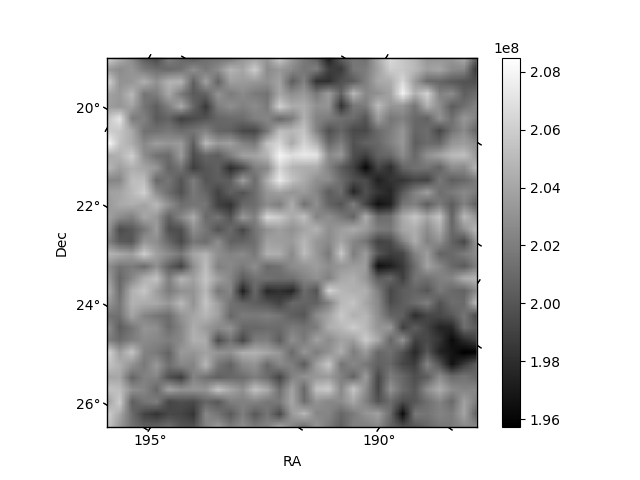
Quadrant B |
|---|---|---|---|
| Quadrant D | 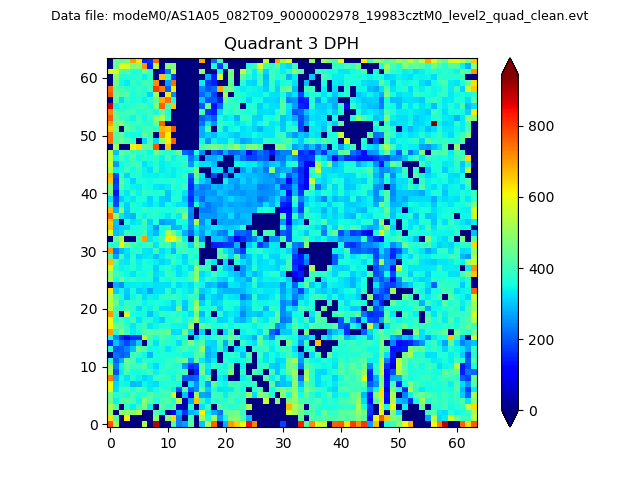 |
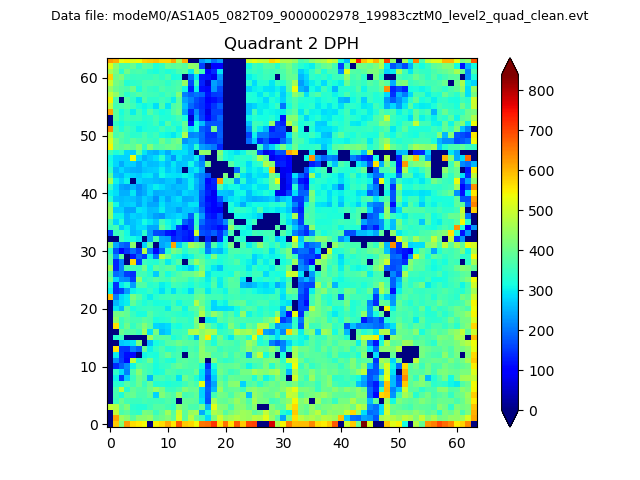 |
Quadrant C |
| Plot type | Count rate plots | Images |
|---|---|---|
| Comparison with Poisson distribution Blue bars denote a histogram of data divided into 1 sec bins. Red curve is a Poisson curve with rate = median count rate of data. |
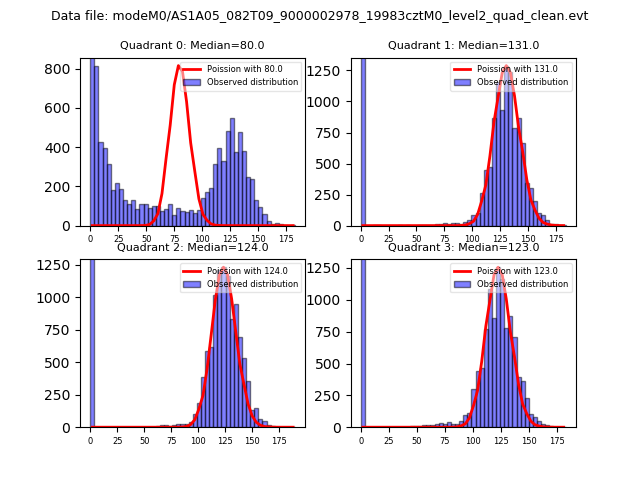 |
 |
| Quadrant-wise count rates Data is divided into 100 sec bins |
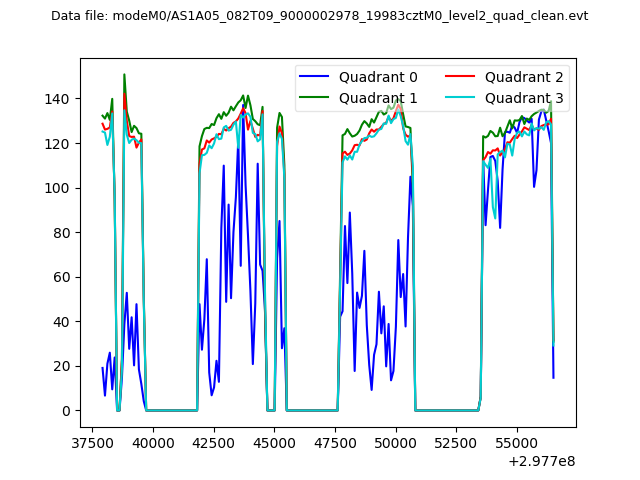 |
|
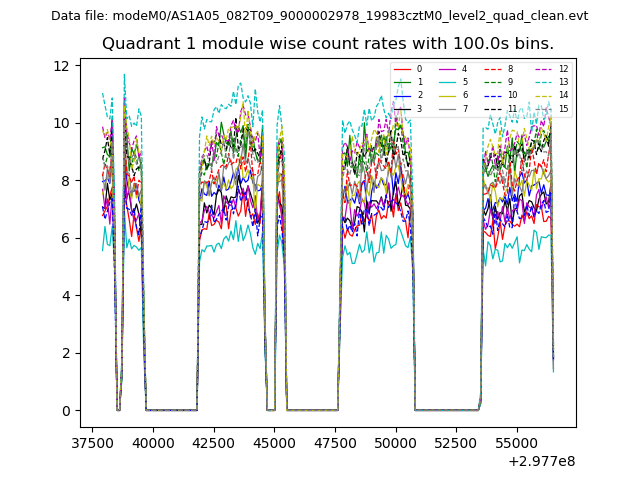
| Module-wise count rates for Quadrant A Data is divided into 100 sec bins |
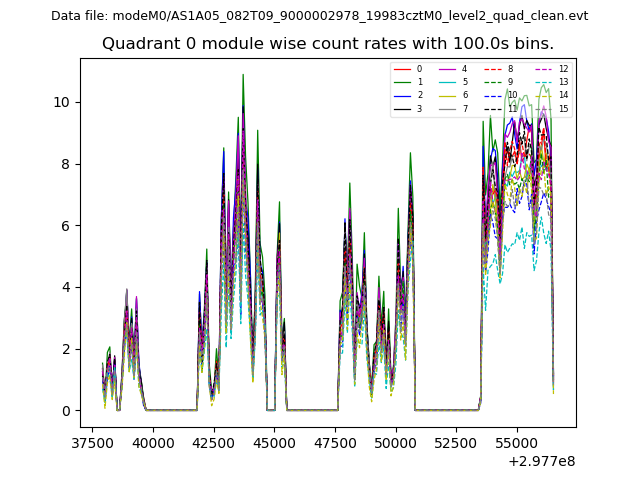 |
 |
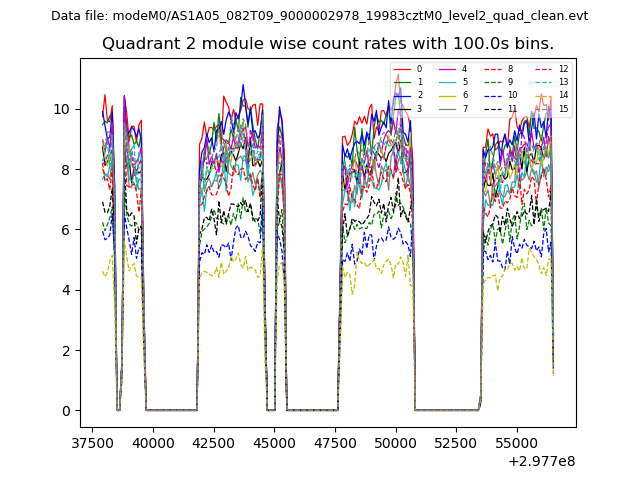
| Module-wise count rates for Quadrant B Data is divided into 100 sec bins |
 |
 |
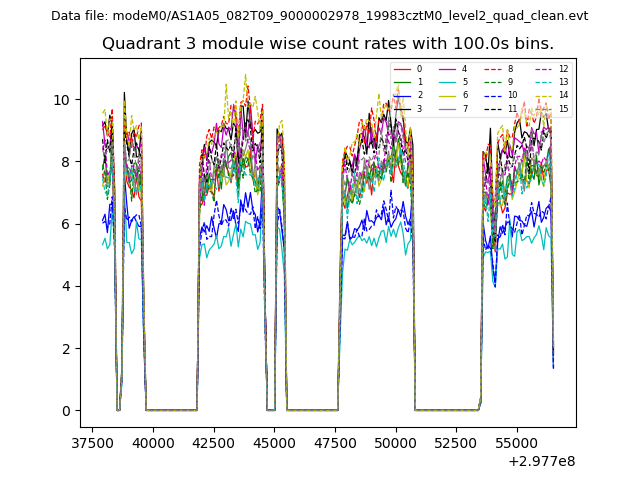
| Module-wise count rates for Quadrant C Data is divided into 100 sec bins |
 |
 |
| Module-wise count rates for Quadrant D Data is divided into 100 sec bins |
 |
 |
| Parameter | Plot |
|---|---|
| CZT HV Monitor | 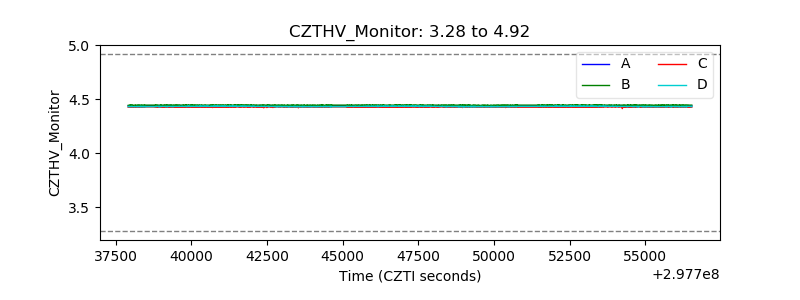 |
| D_VDD | 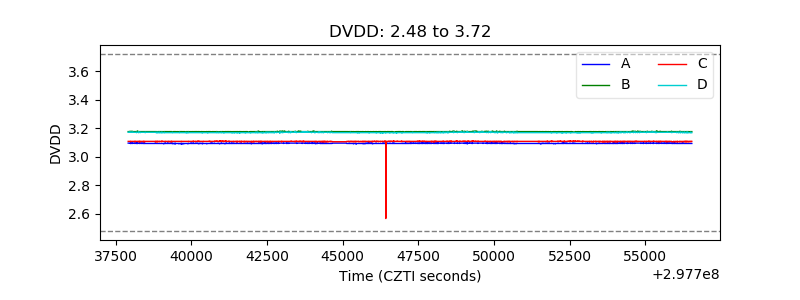 |
| Temperature 1 |  |
| Veto HV Monitor | 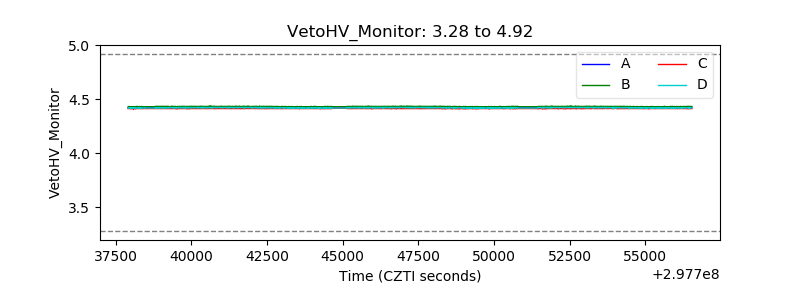 |
| Veto LLD | 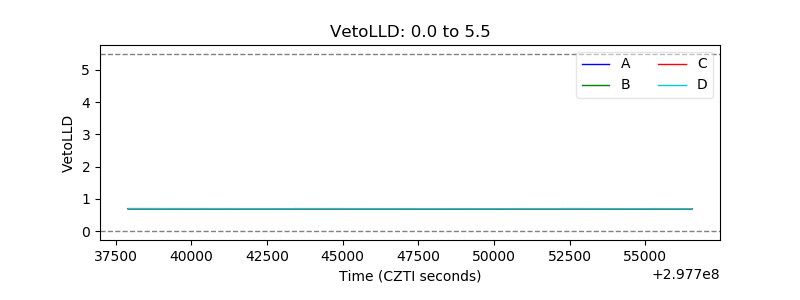 |
| Alpha Counter | 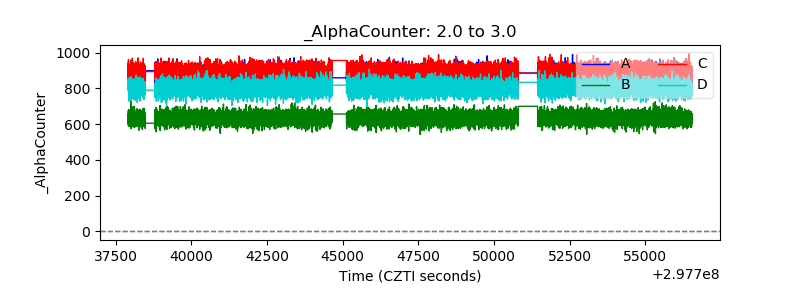 |
| _CPM_Rate | 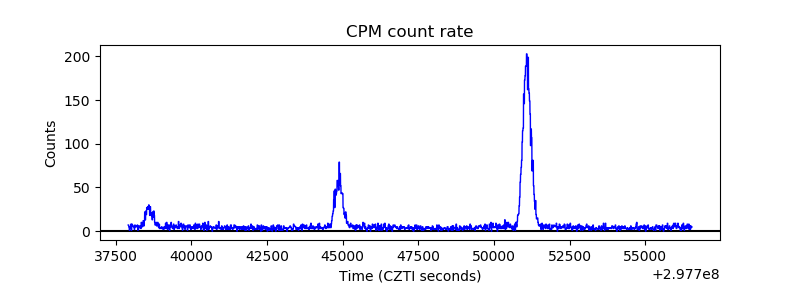 |
| CZT Counter | 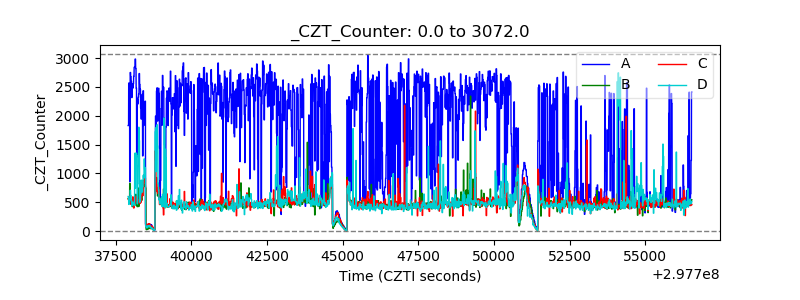 |
| +2.5 Volts monitor |  |
| +5 Volts monitor | 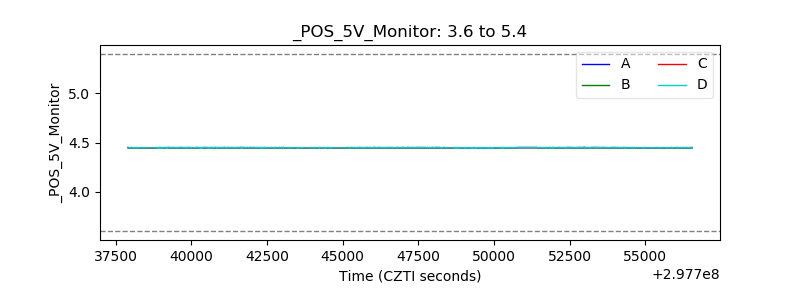 |
| _ROLL_ROT | 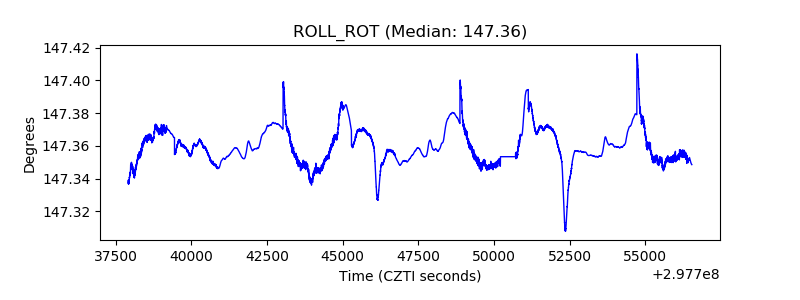 |
| _Roll_DEC |  |
| _Roll_RA | 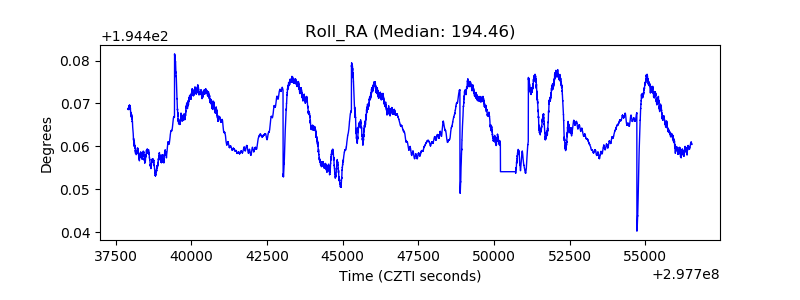 |
| Veto Counter |  |