| Param | Original file | Final file |
|---|---|---|
| Filename | modeM0/AS1C04_005T01_9000002976cztM0_level2.fits | modeM0/AS1C04_005T01_9000002976cztM0_level2_quad_clean.evt |
| Size (bytes) | 395,493,120 | 273,168,000 |
| Size | 377.2 MB | 260.5 MB |
| Events in quadrant A | 1,191,934 | 582,516 |
| Events in quadrant B | 2,695,328 | 1,702,372 |
| Events in quadrant C | 2,741,188 | 1,584,921 |
| Events in quadrant D | 2,383,324 | 1,450,538 |
| Mode M0 | |||
|---|---|---|---|
| Quadrant | BADHDUFLAG | Total packets | Discarded packets |
| A | 0 | 288274 | 0 |
| B | 0 | 93942 | 0 |
| C | 0 | 99103 | 0 |
| D | 0 | 115837 | 0 |
| Mode SS | |||
|---|---|---|---|
| Quadrant | BADHDUFLAG | Total packets | Discarded packets |
| A | 0 | 874 | 0 |
| B | 0 | 874 | 0 |
| C | 0 | 874 | 0 |
| D | 0 | 874 | 0 |
| Mode M9 | |||
|---|---|---|---|
| Quadrant | BADHDUFLAG | Total packets | Discarded packets |
| A | 0 | 92 | 0 |
| B | 0 | 92 | 0 |
| C | 0 | 92 | 0 |
| D | 0 | 92 | 0 |
| Quadrant | Total seconds | Saturated seconds | Saturation percentage |
|---|---|---|---|
| A | 42965 | 32354 | 75.303154% |
| B | 42965 | 565 | 1.315024% |
| C | 42965 | 952 | 2.215757% |
| D | 42965 | 2800 | 6.516932% |
Noise dominated data is calculated using 1-second bins in cleaned event files. If a bin has >2000 counts, and if more than 50% of those come from <1% of pixels, then it is considered to be noise-dominated and hence unusable.
| Quadrant | # 1 sec bins | Bins with >0 counts | Bins with >2000 counts | High rate bins dominated by noise | Noise dominated (total time) | Noise dominated (detector-on time) | Marked lightcurve |
|---|---|---|---|---|---|---|---|
| A | 52079 | 35553 | 0 | 0 | 0.00% | 0.00% |  |
| B | 52079 | 42955 | 0 | 0 | 0.00% | 0.00% |  |
| C | 52080 | 42955 | 0 | 0 | 0.00% | 0.00% |  |
| D | 52080 | 42955 | 0 | 0 | 0.00% | 0.00% |  |
Top three noisy pixels from each quadrant. If the there are fewer than three noisy pixels in the level2.evt file, extra rows are filled as -1
| Pixel properties | Quadrant properties | ||||||
|---|---|---|---|---|---|---|---|
| Quadrant | DetID | PixID | Counts | Sigma | Mean | Median | Sigma |
| A | 14 | 188 | 1189 | 11.66 | 310 | 291 | 77.0 |
| A | 0 | 29 | 1118 | 10.73 | 310 | 291 | 77.0 |
| A | 7 | 110 | 963 | 8.72 | 310 | 291 | 77.0 |
| B | 2 | 9 | 2045 | 9.69 | 712 | 682 | 140.7 |
| B | 2 | 8 | 1763 | 7.69 | 712 | 682 | 140.7 |
| B | 5 | 255 | 1760 | 7.66 | 712 | 682 | 140.7 |
| C | 1 | 80 | 2013 | 7.22 | 723 | 679 | 184.7 |
| C | 1 | 81 | 1987 | 7.08 | 723 | 679 | 184.7 |
| C | 3 | 126 | 1874 | 6.47 | 723 | 679 | 184.7 |
| D | 3 | 14 | 1670 | 5.84 | 682 | 624 | 179.1 |
| D | 6 | 231 | 1653 | 5.74 | 682 | 624 | 179.1 |
| D | 7 | 3 | 1650 | 5.72 | 682 | 624 | 179.1 |
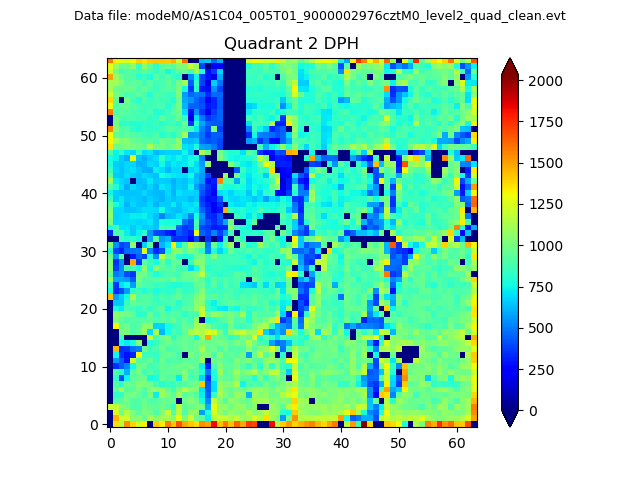
Histogram calculated using DETX and DETY for each event in the final _common_clean file
| Quadrant A |  |
 |
Quadrant B |
|---|---|---|---|
| Quadrant D |  |
 |
Quadrant C |
| Plot type | Count rate plots | Images |
|---|---|---|
| Comparison with Poisson distribution Blue bars denote a histogram of data divided into 1 sec bins. Red curve is a Poisson curve with rate = median count rate of data. |
 |
 |
| Quadrant-wise count rates Data is divided into 100 sec bins |
 |
|
| Module-wise count rates for Quadrant A Data is divided into 100 sec bins |
 |
 |
| Module-wise count rates for Quadrant B Data is divided into 100 sec bins |
 |
 |
| Module-wise count rates for Quadrant C Data is divided into 100 sec bins |
 |
 |
| Module-wise count rates for Quadrant D Data is divided into 100 sec bins |
 |
 |
| Parameter | Plot |
|---|---|
| CZT HV Monitor |  |
| D_VDD |  |
| Temperature 1 |  |
| Veto HV Monitor |  |
| Veto LLD |  |
| Alpha Counter |  |
| _CPM_Rate | 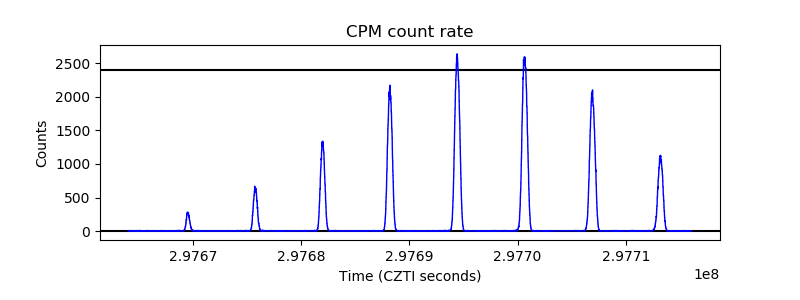 |
| CZT Counter |  |
| +2.5 Volts monitor | 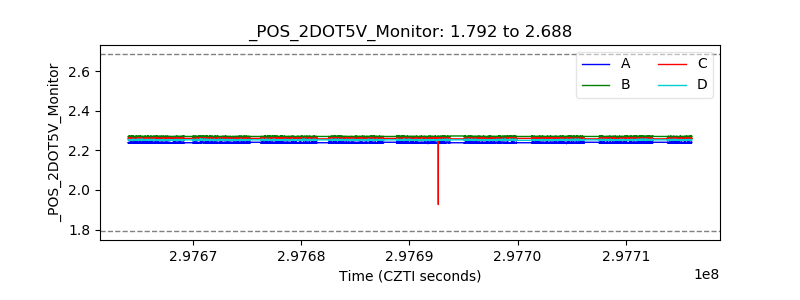 |
| +5 Volts monitor |  |
| _ROLL_ROT |  |
| _Roll_DEC |  |
| _Roll_RA |  |
| Veto Counter |  |