| Param | Original file | Final file |
|---|---|---|
| Filename | modeM0/AS1C04_005T01_9000002976_19972cztM0_level2.evt | modeM0/AS1C04_005T01_9000002976_19972cztM0_level2_quad_clean.evt |
| Size (bytes) | 1,384,364,160 | 113,719,680 |
| Size | 1.3 GB | 108.5 MB |
| Events in quadrant A | 21,796,965 | 399,274 |
| Events in quadrant B | 5,637,146 | 795,871 |
| Events in quadrant C | 5,704,174 | 746,091 |
| Events in quadrant D | 8,052,618 | 745,900 |
| Mode M0 | |||
|---|---|---|---|
| Quadrant | BADHDUFLAG | Total packets | Discarded packets |
| A | 0 | 72343 | 2 |
| B | 0 | 23247 | 2 |
| C | 0 | 23522 | 3 |
| D | 0 | 31061 | 2 |
| Mode SS | |||
|---|---|---|---|
| Quadrant | BADHDUFLAG | Total packets | Discarded packets |
| A | 0 | 220 | 0 |
| B | 0 | 220 | 0 |
| C | 0 | 220 | 0 |
| D | 0 | 220 | 0 |
| Mode M9 | |||
|---|---|---|---|
| Quadrant | BADHDUFLAG | Total packets | Discarded packets |
| A | 0 | 23 | 0 |
| B | 0 | 23 | 0 |
| C | 0 | 23 | 0 |
| D | 0 | 23 | 0 |
| Quadrant | Total seconds | Saturated seconds | Saturation percentage |
|---|---|---|---|
| A | 10908 | 7683 | 70.434543% |
| B | 10909 | 116 | 1.063342% |
| C | 10908 | 198 | 1.815182% |
| D | 10908 | 745 | 6.829850% |
Noise dominated data is calculated using 1-second bins in cleaned event files. If a bin has >2000 counts, and if more than 50% of those come from <1% of pixels, then it is considered to be noise-dominated and hence unusable.
| Quadrant | # 1 sec bins | Bins with >0 counts | Bins with >2000 counts | High rate bins dominated by noise | Noise dominated (total time) | Noise dominated (detector-on time) | Marked lightcurve |
|---|---|---|---|---|---|---|---|
| A | 13107 | 10907 | 6579 | 6579 | 50.19% | 60.32% | 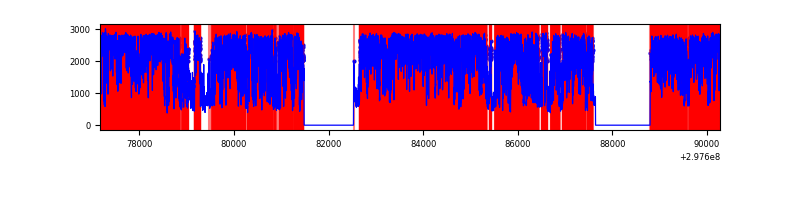 |
| B | 13109 | 10909 | 11 | 11 | 0.08% | 0.10% | 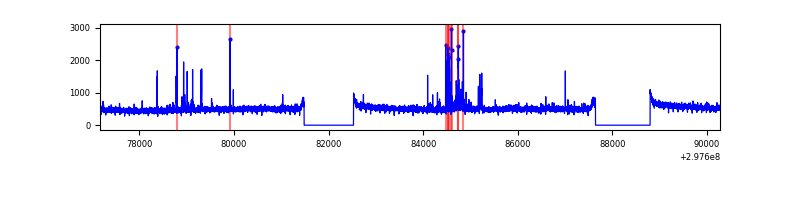 |
| C | 13108 | 10908 | 10 | 10 | 0.08% | 0.09% | 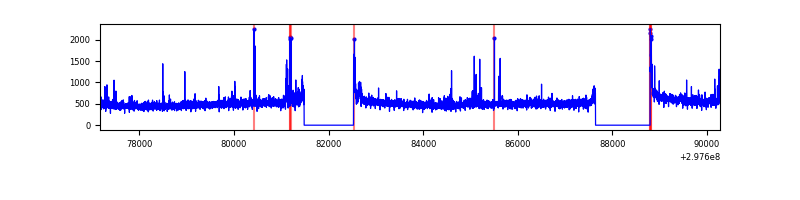 |
| D | 13108 | 10908 | 669 | 669 | 5.10% | 6.13% | 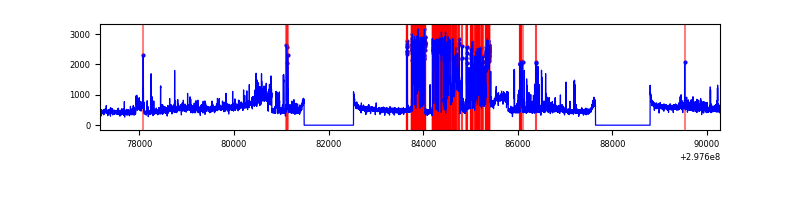 |
Top three noisy pixels from each quadrant. If the there are fewer than three noisy pixels in the level2.evt file, extra rows are filled as -1
| Pixel properties | Quadrant properties | ||||||
|---|---|---|---|---|---|---|---|
| Quadrant | DetID | PixID | Counts | Sigma | Mean | Median | Sigma |
| A | 14 | 238 | 18721754 | 119533.89 | 784 | 768 | 156.6 |
| A | 14 | 254 | 38473 | 240.74 | 784 | 768 | 156.6 |
| A | 10 | 253 | 7416 | 42.44 | 784 | 768 | 156.6 |
| B | 7 | 220 | 136544 | 518.48 | 1383 | 1352 | 260.7 |
| B | 4 | 171 | 35420 | 130.66 | 1383 | 1352 | 260.7 |
| B | 12 | 111 | 31462 | 115.48 | 1383 | 1352 | 260.7 |
| C | 14 | 238 | 210073 | 678.19 | 1323 | 1336 | 307.8 |
| C | 3 | 233 | 191277 | 617.12 | 1323 | 1336 | 307.8 |
| C | 9 | 221 | 131413 | 422.62 | 1323 | 1336 | 307.8 |
| D | 7 | 238 | 2518050 | 7840.94 | 1333 | 1295 | 321.0 |
| D | 1 | 52 | 462391 | 1436.54 | 1333 | 1295 | 321.0 |
| D | 2 | 234 | 40760 | 122.95 | 1333 | 1295 | 321.0 |
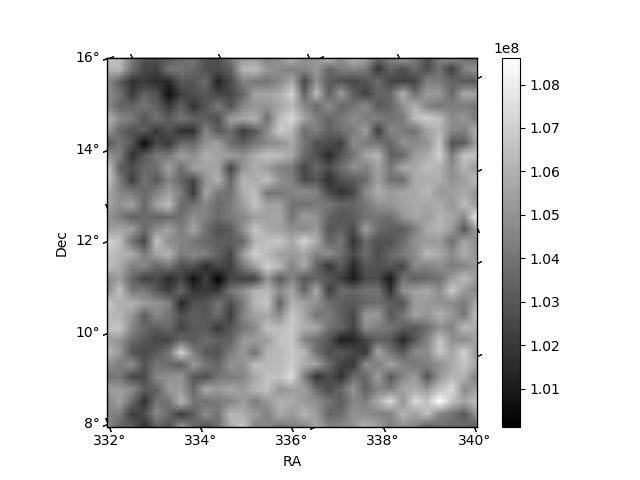
Histogram calculated using DETX and DETY for each event in the final _common_clean file
| Quadrant A | 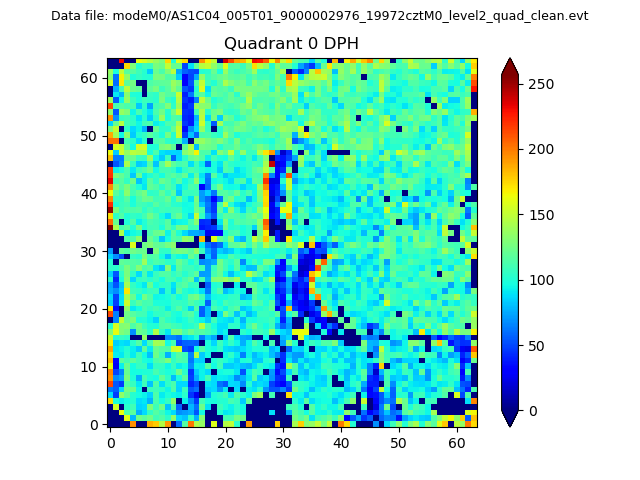 |
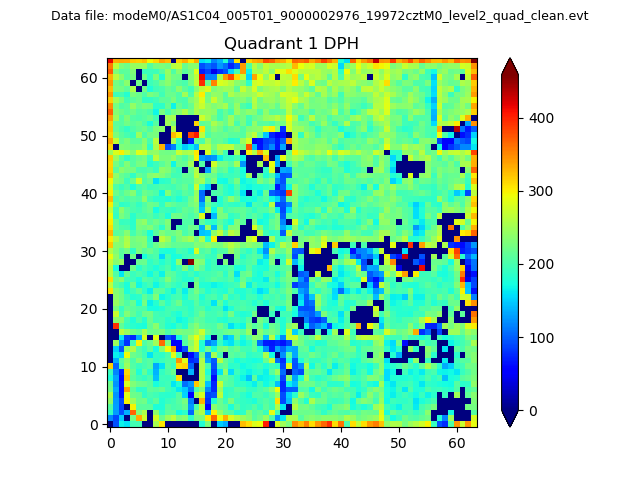 |
Quadrant B |
|---|---|---|---|
| Quadrant D | 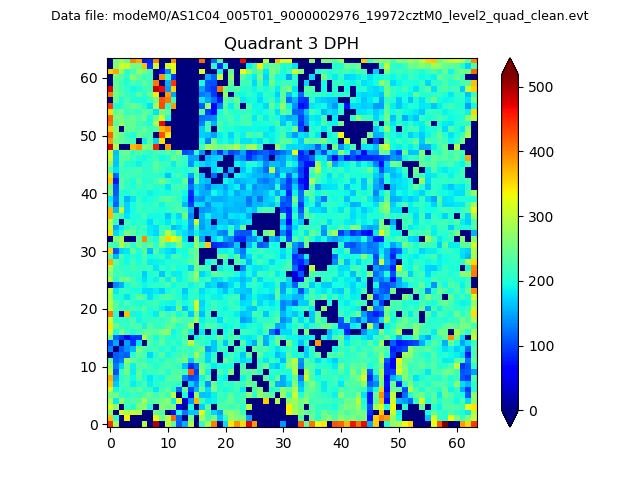 |
 |
Quadrant C |
| Plot type | Count rate plots | Images |
|---|---|---|
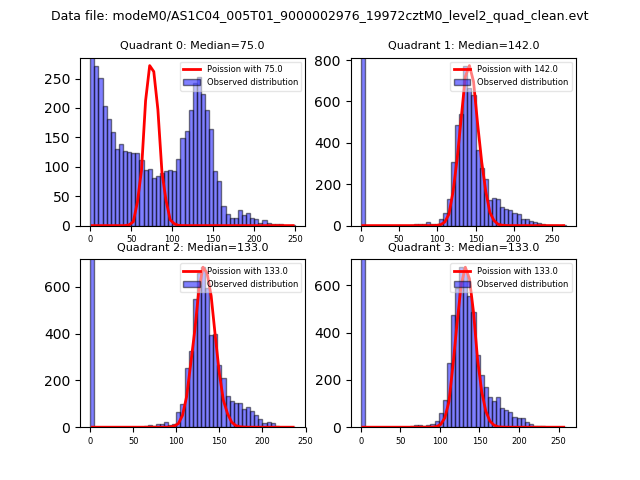
| Comparison with Poisson distribution Blue bars denote a histogram of data divided into 1 sec bins. Red curve is a Poisson curve with rate = median count rate of data. |
 |
 |
| Quadrant-wise count rates Data is divided into 100 sec bins |
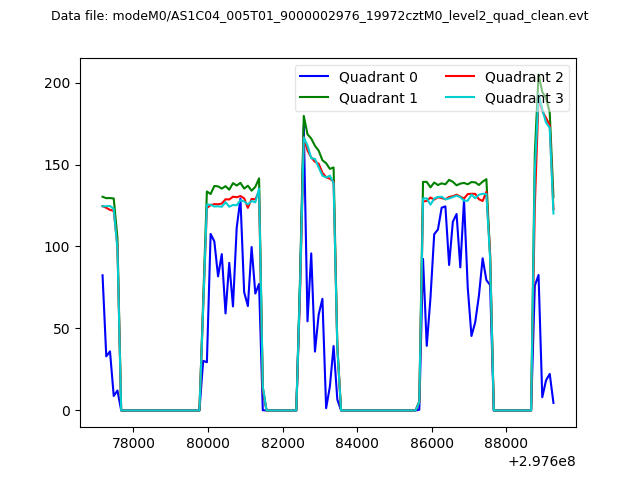 |
|
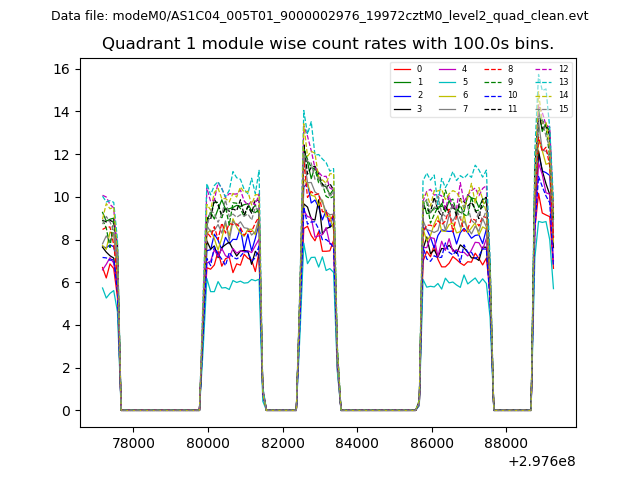
| Module-wise count rates for Quadrant A Data is divided into 100 sec bins |
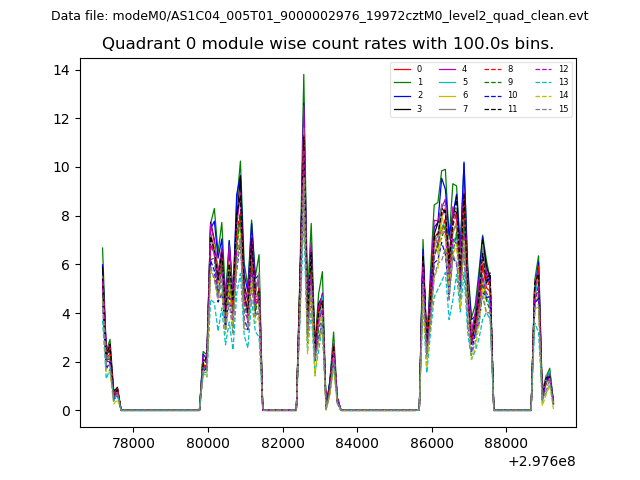 |
 |
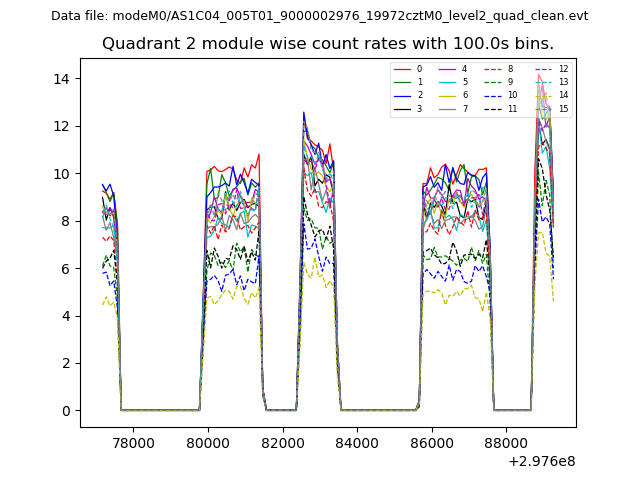
| Module-wise count rates for Quadrant B Data is divided into 100 sec bins |
 |
 |
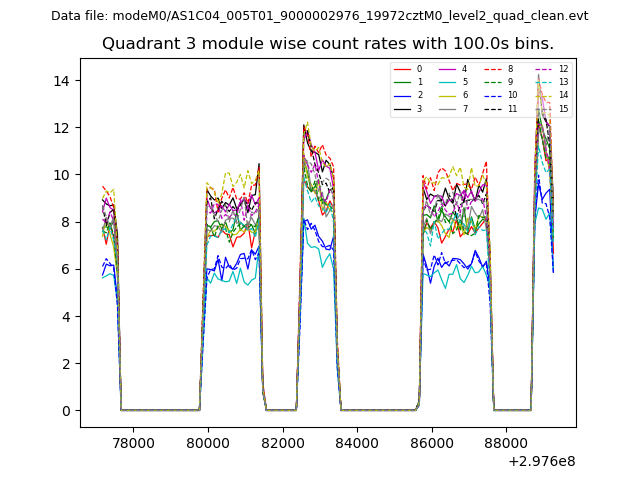
| Module-wise count rates for Quadrant C Data is divided into 100 sec bins |
 |
 |
| Module-wise count rates for Quadrant D Data is divided into 100 sec bins |
 |
 |
| Parameter | Plot |
|---|---|
| CZT HV Monitor | 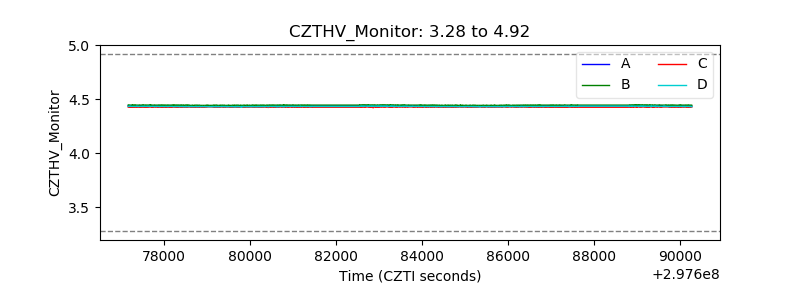 |
| D_VDD | 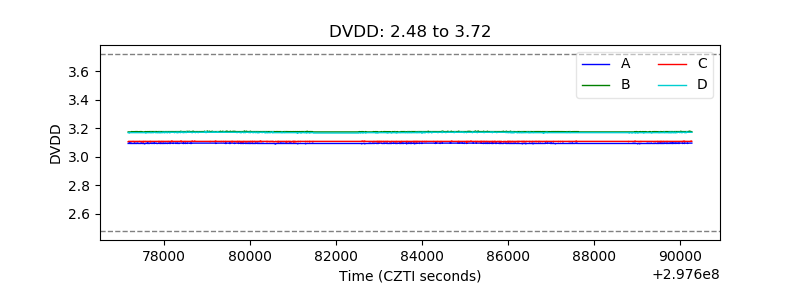 |
| Temperature 1 | 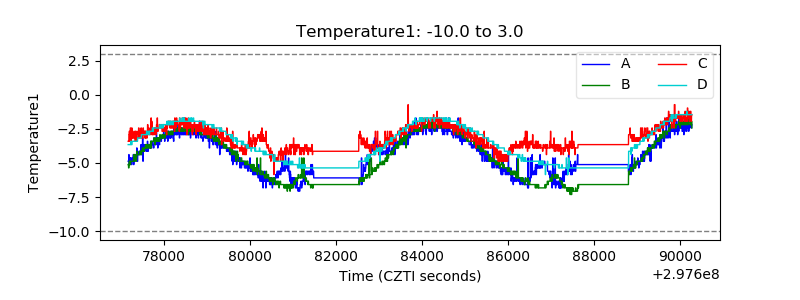 |
| Veto HV Monitor |  |
| Veto LLD | 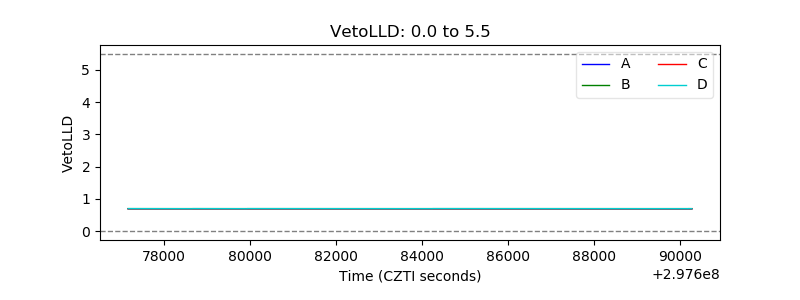 |
| Alpha Counter | 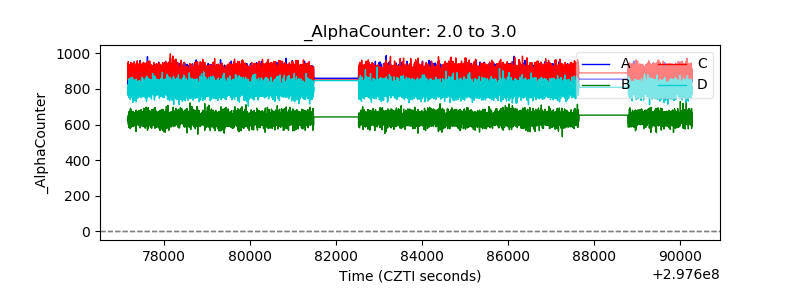 |
| _CPM_Rate | 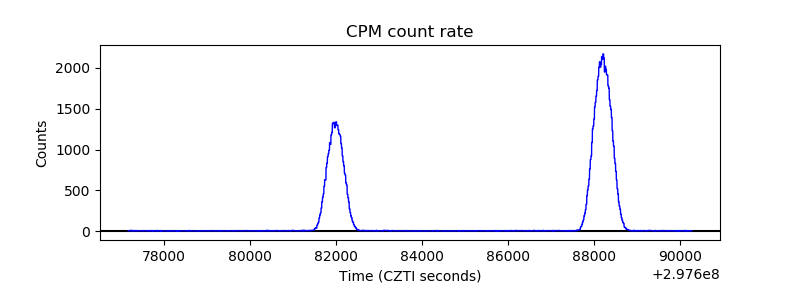 |
| CZT Counter |  |
| +2.5 Volts monitor |  |
| +5 Volts monitor |  |
| _ROLL_ROT | 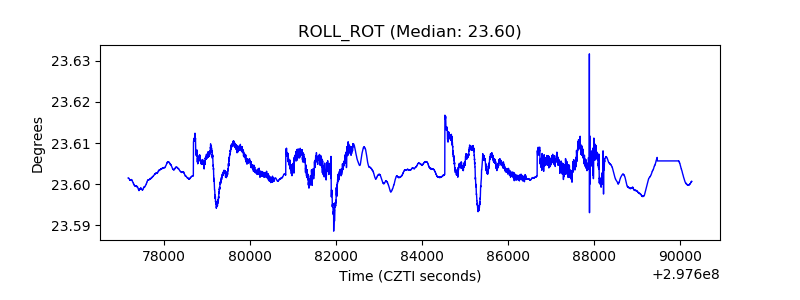 |
| _Roll_DEC | 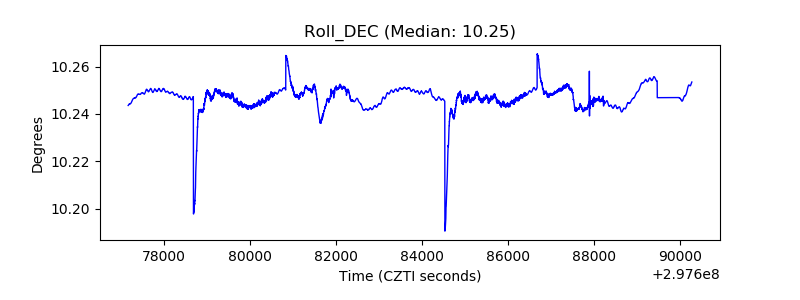 |
| _Roll_RA | 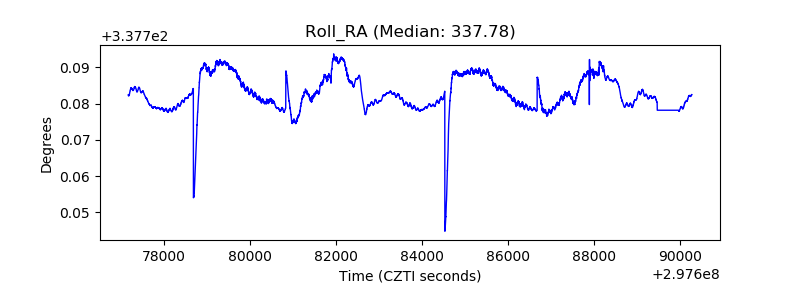 |
| Veto Counter | 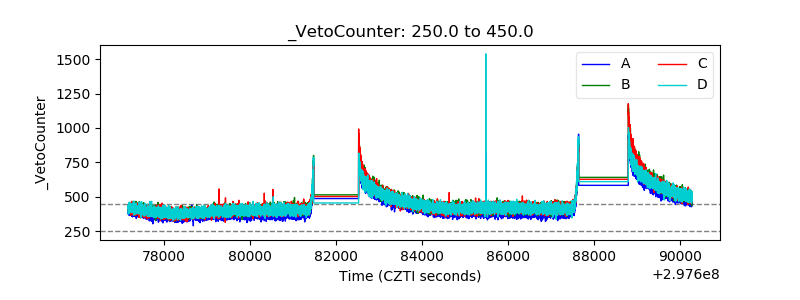 |