| Param | Original file | Final file |
|---|---|---|
| Filename | modeM0/AS1C04_005T01_9000002976_19973cztM0_level2.evt | modeM0/AS1C04_005T01_9000002976_19973cztM0_level2_quad_clean.evt |
| Size (bytes) | 875,488,320 | 63,270,720 |
| Size | 834.9 MB | 60.3 MB |
| Events in quadrant A | 13,697,185 | 171,789 |
| Events in quadrant B | 3,747,249 | 451,697 |
| Events in quadrant C | 4,025,352 | 421,593 |
| Events in quadrant D | 4,607,491 | 418,402 |
| Mode M0 | |||
|---|---|---|---|
| Quadrant | BADHDUFLAG | Total packets | Discarded packets |
| A | 0 | 45162 | 2 |
| B | 0 | 15184 | 2 |
| C | 0 | 16077 | 2 |
| D | 0 | 18050 | 2 |
| Mode SS | |||
|---|---|---|---|
| Quadrant | BADHDUFLAG | Total packets | Discarded packets |
| A | 0 | 130 | 0 |
| B | 0 | 130 | 0 |
| C | 0 | 130 | 0 |
| D | 0 | 130 | 0 |
| Mode M9 | |||
|---|---|---|---|
| Quadrant | BADHDUFLAG | Total packets | Discarded packets |
| A | 0 | 13 | 0 |
| B | 0 | 14 | 0 |
| C | 0 | 14 | 0 |
| D | 0 | 14 | 0 |
| Quadrant | Total seconds | Saturated seconds | Saturation percentage |
|---|---|---|---|
| A | 6469 | 5527 | 85.438244% |
| B | 6469 | 104 | 1.607667% |
| C | 6469 | 225 | 3.478126% |
| D | 6468 | 264 | 4.081633% |
Noise dominated data is calculated using 1-second bins in cleaned event files. If a bin has >2000 counts, and if more than 50% of those come from <1% of pixels, then it is considered to be noise-dominated and hence unusable.
| Quadrant | # 1 sec bins | Bins with >0 counts | Bins with >2000 counts | High rate bins dominated by noise | Noise dominated (total time) | Noise dominated (detector-on time) | Marked lightcurve |
|---|---|---|---|---|---|---|---|
| A | 7728 | 6468 | 4273 | 4273 | 55.29% | 66.06% | 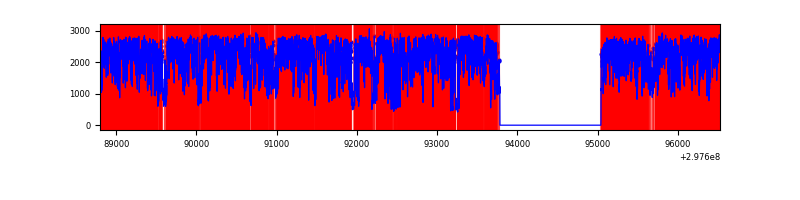 |
| B | 7729 | 6469 | 24 | 24 | 0.31% | 0.37% | 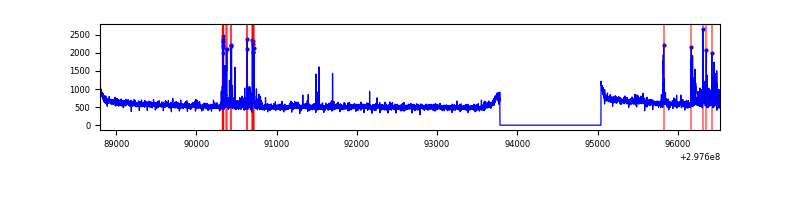 |
| C | 7729 | 6469 | 86 | 86 | 1.11% | 1.33% | 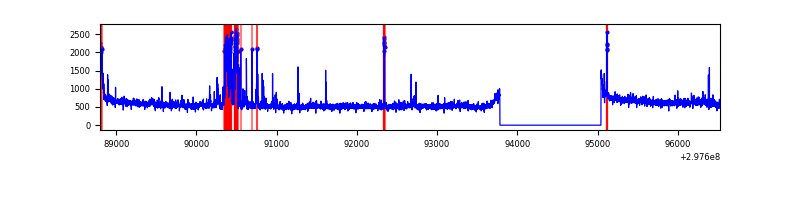 |
| D | 7728 | 6468 | 224 | 224 | 2.90% | 3.46% | 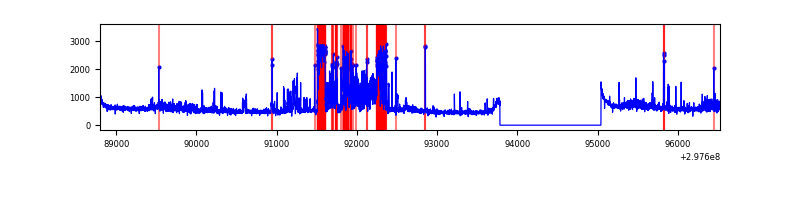 |
Top three noisy pixels from each quadrant. If the there are fewer than three noisy pixels in the level2.evt file, extra rows are filled as -1
| Pixel properties | Quadrant properties | ||||||
|---|---|---|---|---|---|---|---|
| Quadrant | DetID | PixID | Counts | Sigma | Mean | Median | Sigma |
| A | 14 | 238 | 12228785 | 175587.94 | 347 | 340 | 69.6 |
| A | 14 | 254 | 121243 | 1736.04 | 347 | 340 | 69.6 |
| A | 11 | 29 | 4492 | 59.62 | 347 | 340 | 69.6 |
| B | 7 | 220 | 178316 | 1062.81 | 898 | 881 | 166.9 |
| B | 12 | 111 | 19372 | 110.76 | 898 | 881 | 166.9 |
| B | 11 | 111 | 17192 | 97.7 | 898 | 881 | 166.9 |
| C | 3 | 233 | 440428 | 2236.24 | 856 | 866 | 196.6 |
| C | 14 | 238 | 138469 | 700.05 | 856 | 866 | 196.6 |
| C | 9 | 221 | 73537 | 369.71 | 856 | 866 | 196.6 |
| D | 1 | 52 | 780422 | 3641.61 | 881 | 857 | 214.1 |
| D | 7 | 238 | 296501 | 1381.05 | 881 | 857 | 214.1 |
| D | 9 | 1 | 173541 | 806.67 | 881 | 857 | 214.1 |
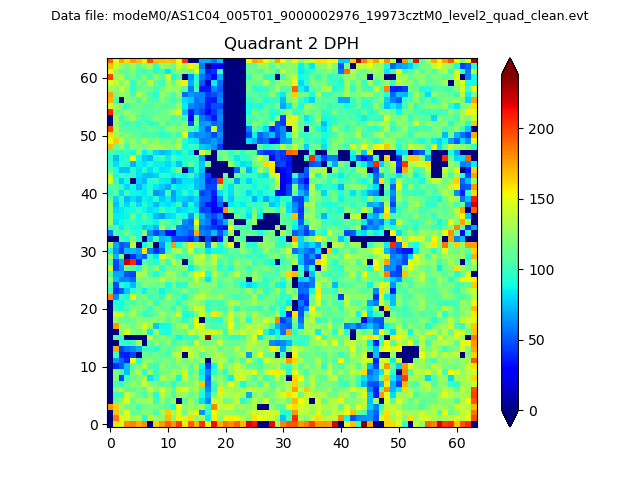
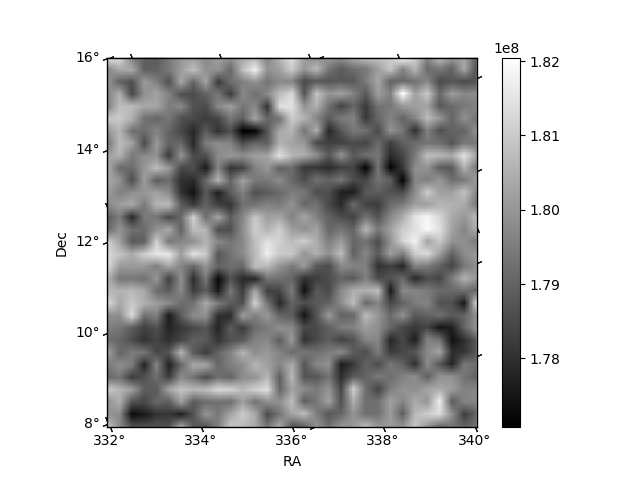
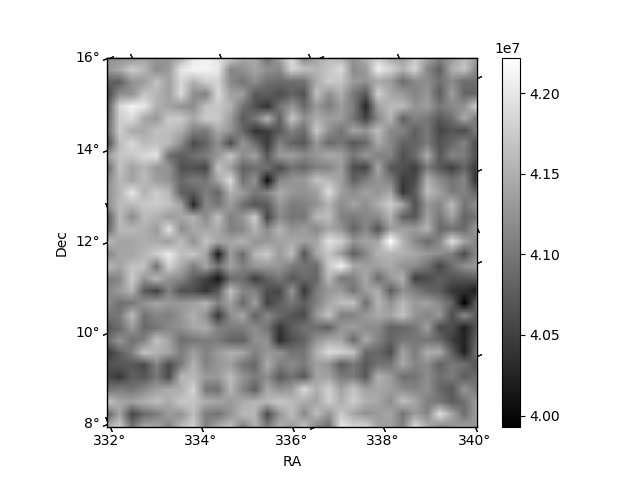
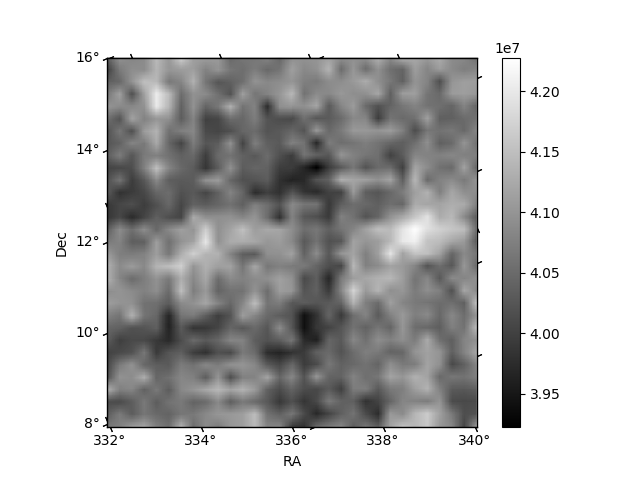
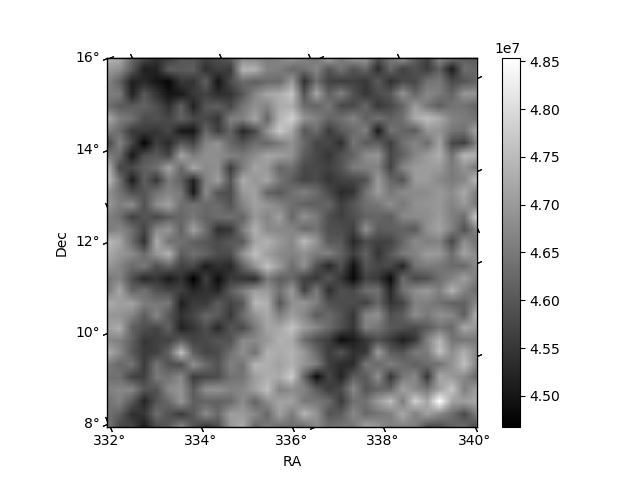
Histogram calculated using DETX and DETY for each event in the final _common_clean file
| Quadrant A | 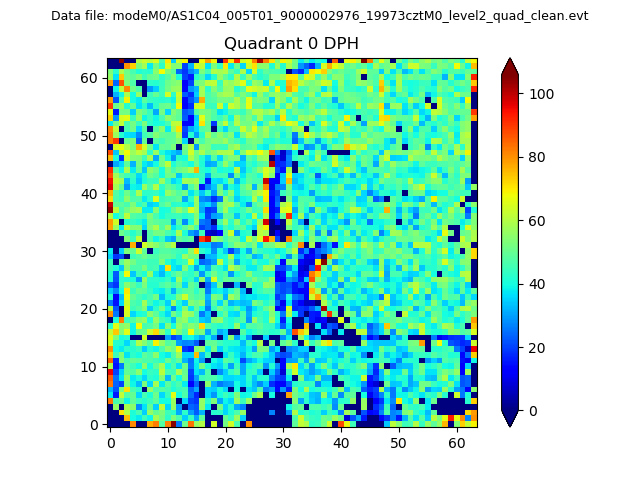 |
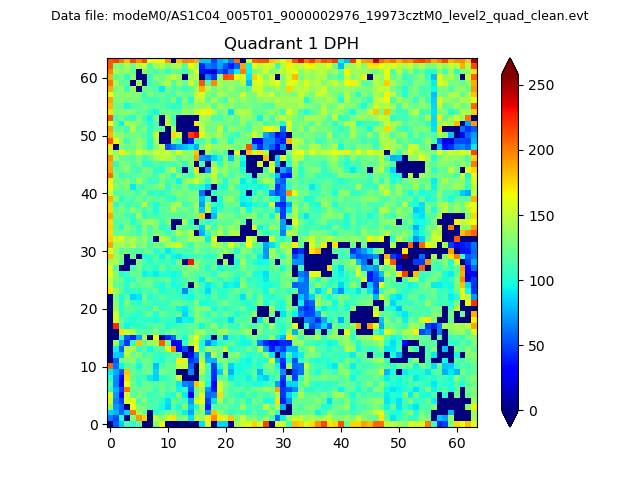 |
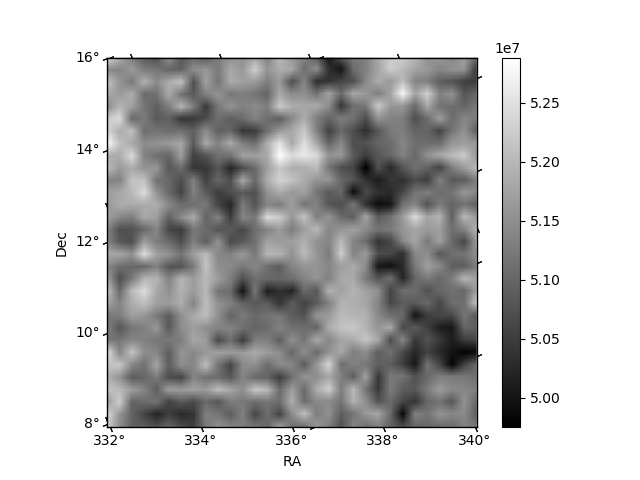
Quadrant B |
|---|---|---|---|
| Quadrant D | 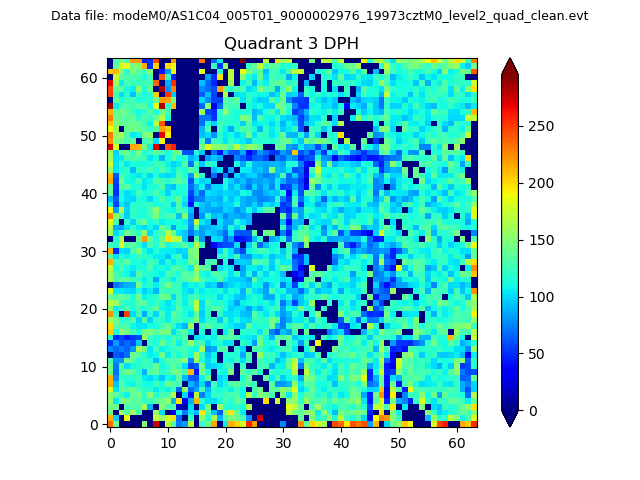 |
 |
Quadrant C |
| Plot type | Count rate plots | Images |
|---|---|---|
| Comparison with Poisson distribution Blue bars denote a histogram of data divided into 1 sec bins. Red curve is a Poisson curve with rate = median count rate of data. |
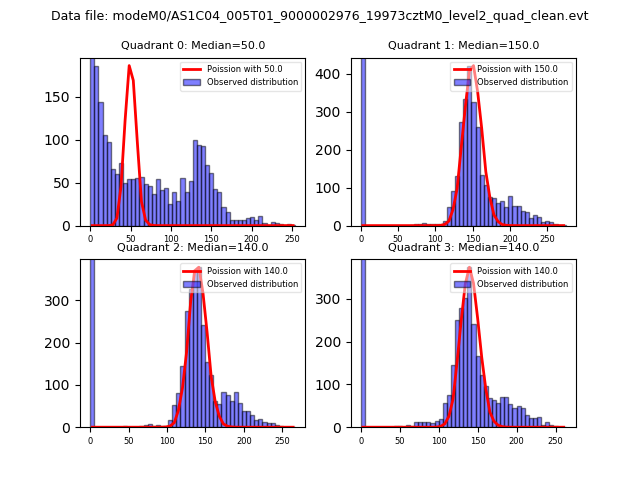 |
 |
| Quadrant-wise count rates Data is divided into 100 sec bins |
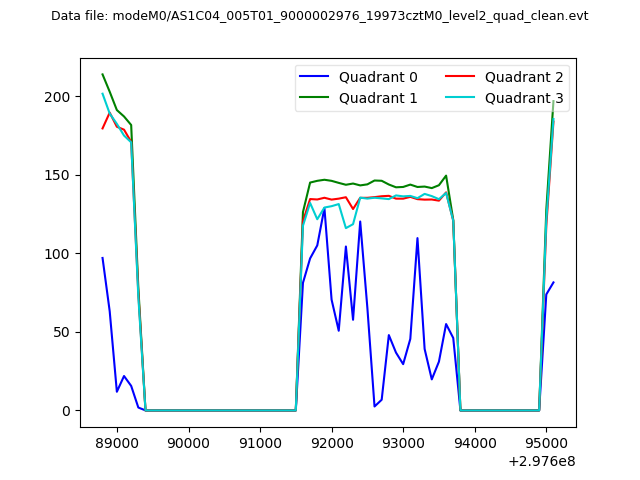 |
|
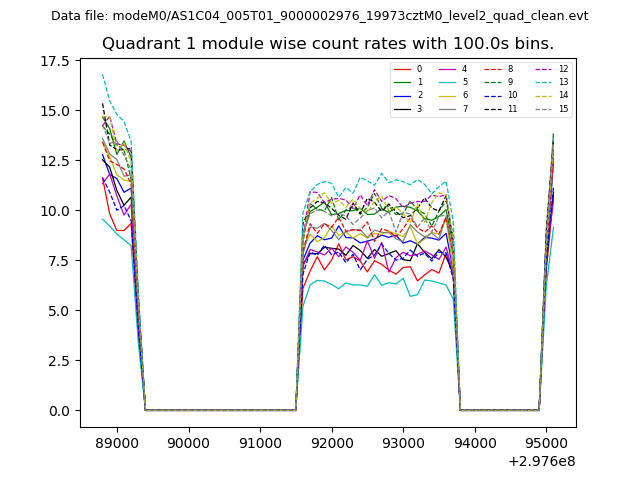
| Module-wise count rates for Quadrant A Data is divided into 100 sec bins |
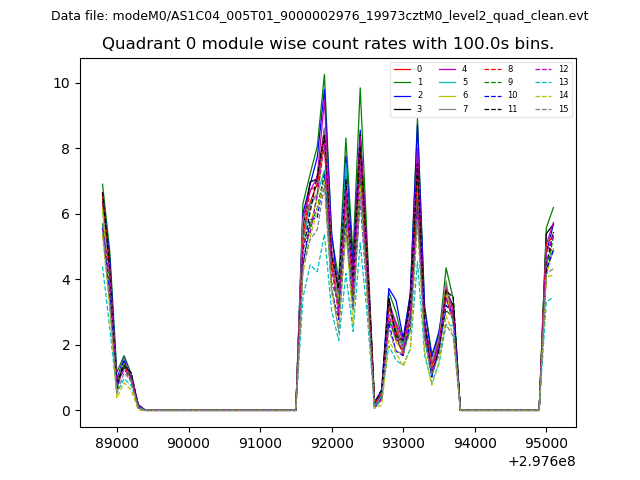 |
 |
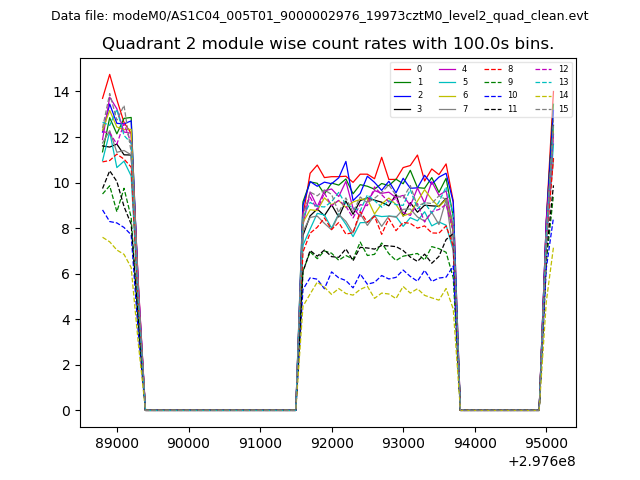
| Module-wise count rates for Quadrant B Data is divided into 100 sec bins |
 |
 |
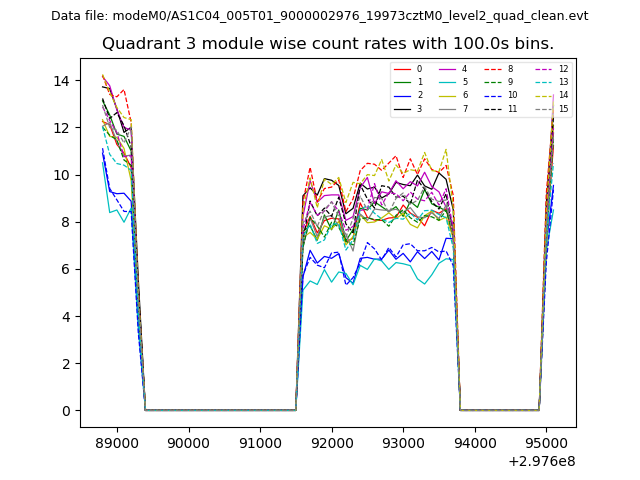
| Module-wise count rates for Quadrant C Data is divided into 100 sec bins |
 |
 |
| Module-wise count rates for Quadrant D Data is divided into 100 sec bins |
 |
 |
| Parameter | Plot |
|---|---|
| CZT HV Monitor | 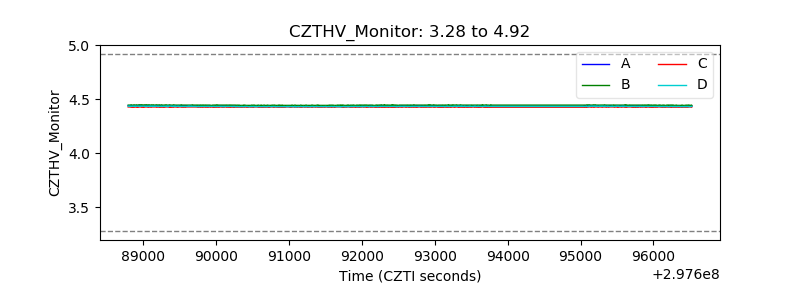 |
| D_VDD | 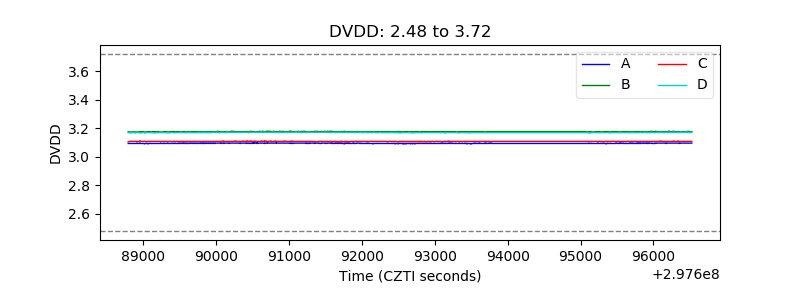 |
| Temperature 1 | 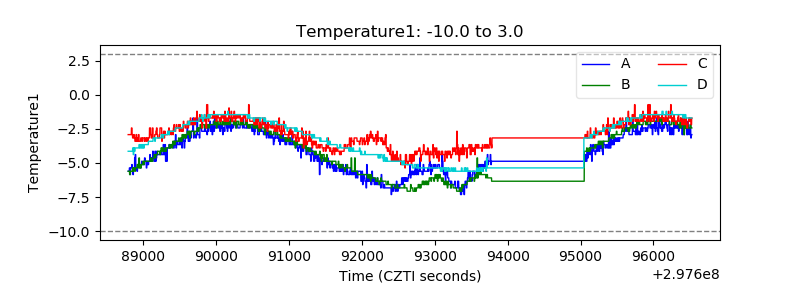 |
| Veto HV Monitor |  |
| Veto LLD | 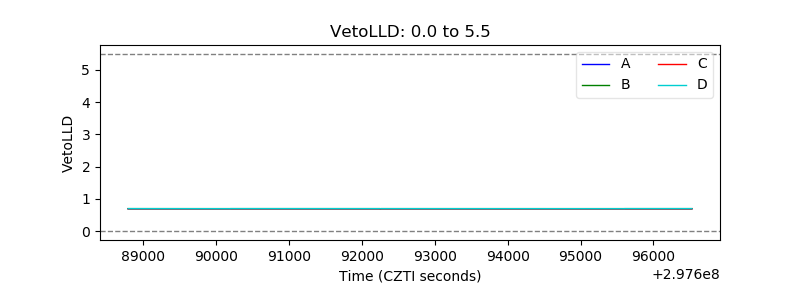 |
| Alpha Counter | 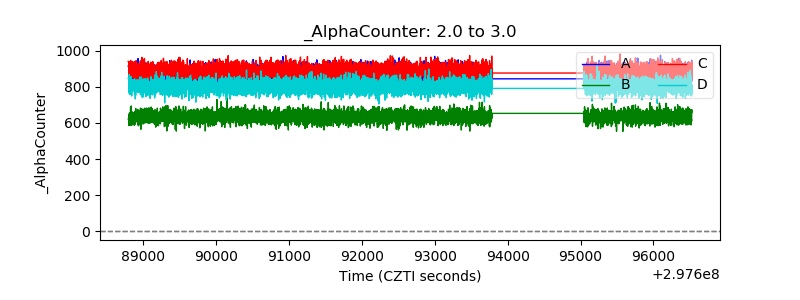 |
| _CPM_Rate | 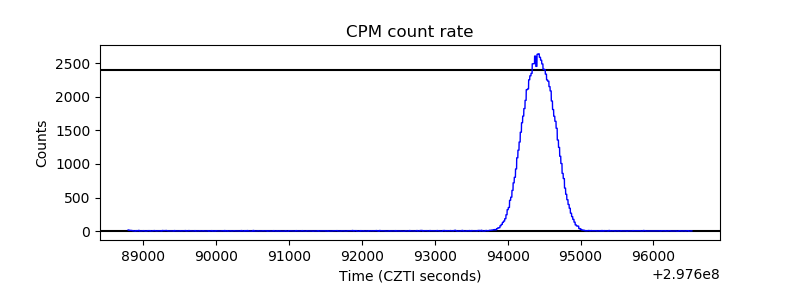 |
| CZT Counter | 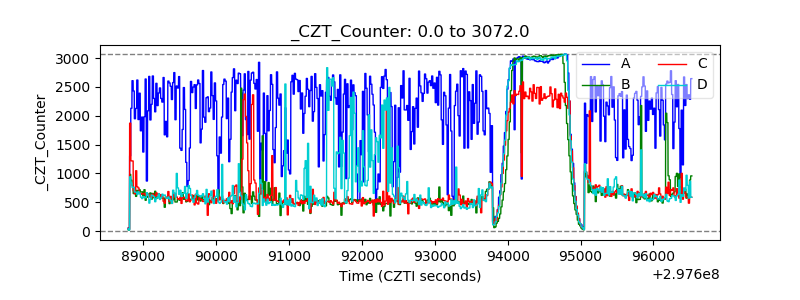 |
| +2.5 Volts monitor |  |
| +5 Volts monitor |  |
| _ROLL_ROT | 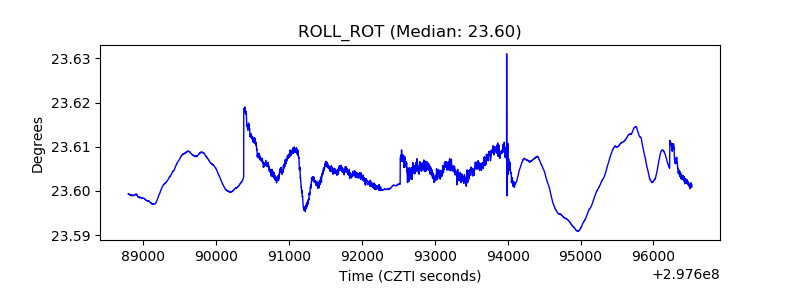 |
| _Roll_DEC | 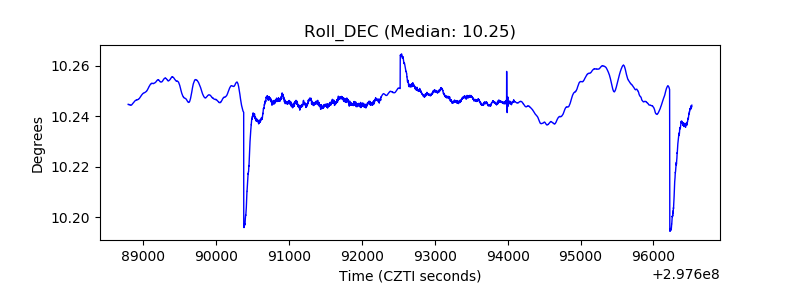 |
| _Roll_RA | 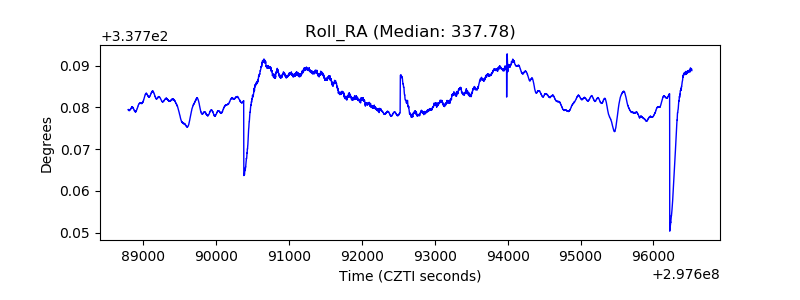 |
| Veto Counter | 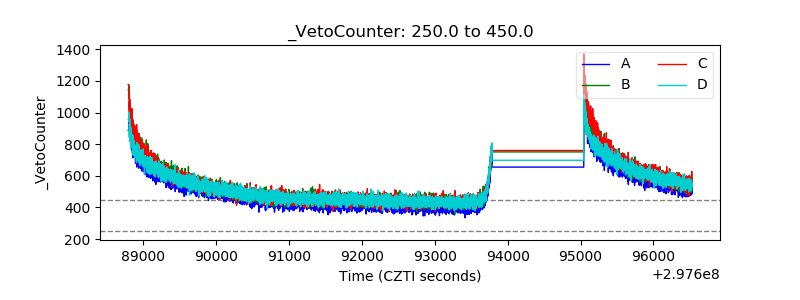 |