| Param | Original file | Final file |
|---|---|---|
| Filename | modeM0/AS1C04_005T01_9000002976_19974cztM0_level2.evt | modeM0/AS1C04_005T01_9000002976_19974cztM0_level2_quad_clean.evt |
| Size (bytes) | 839,514,240 | 58,561,920 |
| Size | 800.6 MB | 55.8 MB |
| Events in quadrant A | 13,432,787 | 165,338 |
| Events in quadrant B | 3,857,301 | 402,568 |
| Events in quadrant C | 3,876,142 | 380,881 |
| Events in quadrant D | 3,832,446 | 383,708 |
| Mode M0 | |||
|---|---|---|---|
| Quadrant | BADHDUFLAG | Total packets | Discarded packets |
| A | 0 | 44269 | 7 |
| B | 0 | 15666 | 2 |
| C | 0 | 15760 | 2 |
| D | 0 | 15526 | 2 |
| Mode SS | |||
|---|---|---|---|
| Quadrant | BADHDUFLAG | Total packets | Discarded packets |
| A | 0 | 128 | 0 |
| B | 0 | 128 | 0 |
| C | 0 | 128 | 0 |
| D | 0 | 128 | 0 |
| Mode M9 | |||
|---|---|---|---|
| Quadrant | BADHDUFLAG | Total packets | Discarded packets |
| A | 0 | 14 | 0 |
| B | 0 | 14 | 0 |
| C | 0 | 14 | 0 |
| D | 0 | 14 | 0 |
| Quadrant | Total seconds | Saturated seconds | Saturation percentage |
|---|---|---|---|
| A | 6295 | 5513 | 87.577442% |
| B | 6295 | 88 | 1.397935% |
| C | 6295 | 131 | 2.081017% |
| D | 6296 | 58 | 0.921220% |
Noise dominated data is calculated using 1-second bins in cleaned event files. If a bin has >2000 counts, and if more than 50% of those come from <1% of pixels, then it is considered to be noise-dominated and hence unusable.
| Quadrant | # 1 sec bins | Bins with >0 counts | Bins with >2000 counts | High rate bins dominated by noise | Noise dominated (total time) | Noise dominated (detector-on time) | Marked lightcurve |
|---|---|---|---|---|---|---|---|
| A | 7654 | 6294 | 4311 | 4311 | 56.32% | 68.49% | 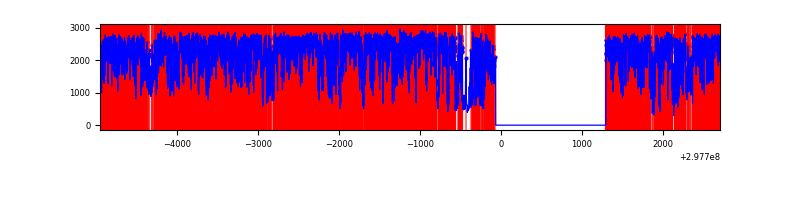 |
| B | 7655 | 6295 | 25 | 25 | 0.33% | 0.40% | 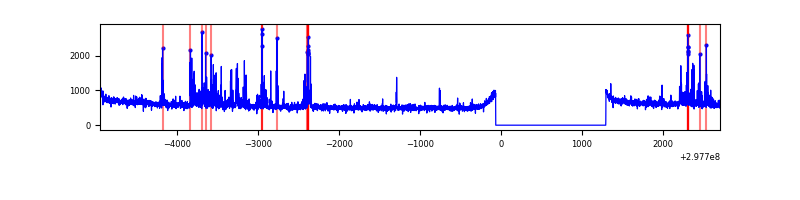 |
| C | 7655 | 6295 | 17 | 17 | 0.22% | 0.27% | 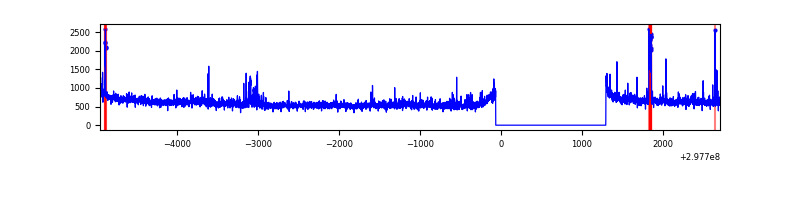 |
| D | 7656 | 6296 | 20 | 20 | 0.26% | 0.32% | 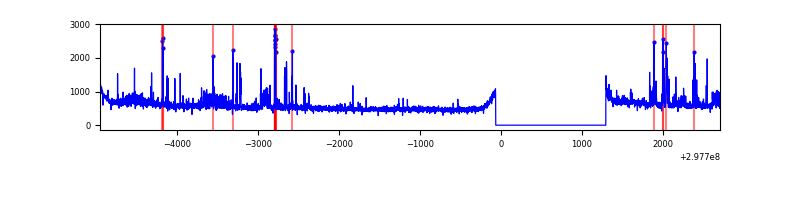 |
Top three noisy pixels from each quadrant. If the there are fewer than three noisy pixels in the level2.evt file, extra rows are filled as -1
| Pixel properties | Quadrant properties | ||||||
|---|---|---|---|---|---|---|---|
| Quadrant | DetID | PixID | Counts | Sigma | Mean | Median | Sigma |
| A | 14 | 238 | 12078907 | 187830.93 | 322 | 317 | 64.3 |
| A | 14 | 254 | 104764 | 1624.23 | 322 | 317 | 64.3 |
| A | 11 | 29 | 2865 | 39.62 | 322 | 317 | 64.3 |
| B | 7 | 220 | 237176 | 1404.81 | 903 | 885 | 168.2 |
| B | 0 | 245 | 25630 | 147.11 | 903 | 885 | 168.2 |
| B | 0 | 190 | 20046 | 113.92 | 903 | 885 | 168.2 |
| C | 9 | 221 | 189864 | 955.44 | 864 | 875 | 197.8 |
| C | 14 | 238 | 138691 | 696.73 | 864 | 875 | 197.8 |
| C | 3 | 233 | 116487 | 584.48 | 864 | 875 | 197.8 |
| D | 7 | 238 | 184378 | 865.97 | 893 | 870 | 211.9 |
| D | 1 | 52 | 127322 | 596.72 | 893 | 870 | 211.9 |
| D | 12 | 218 | 102404 | 479.13 | 893 | 870 | 211.9 |
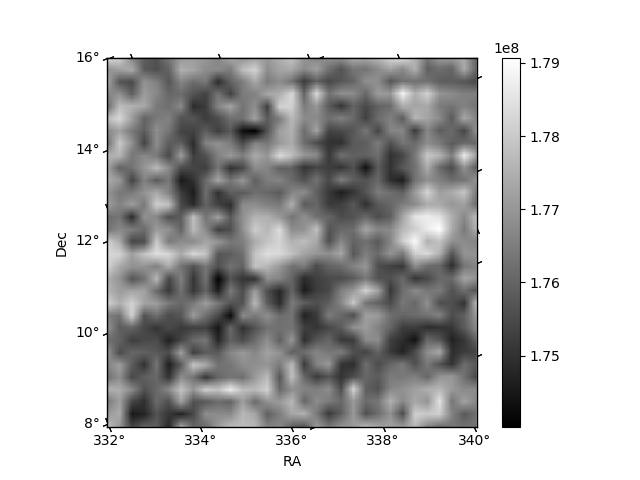
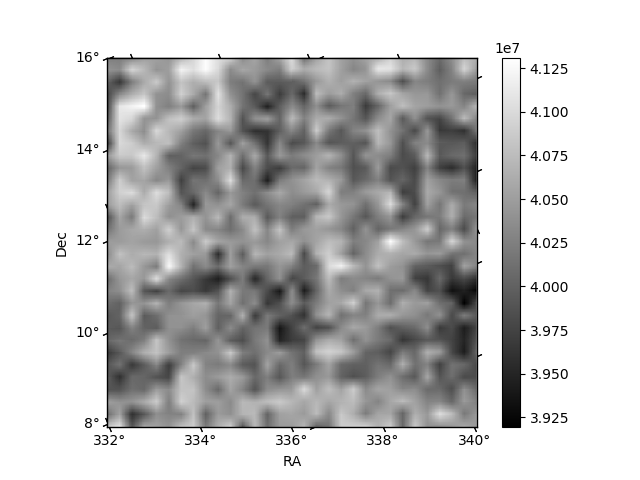
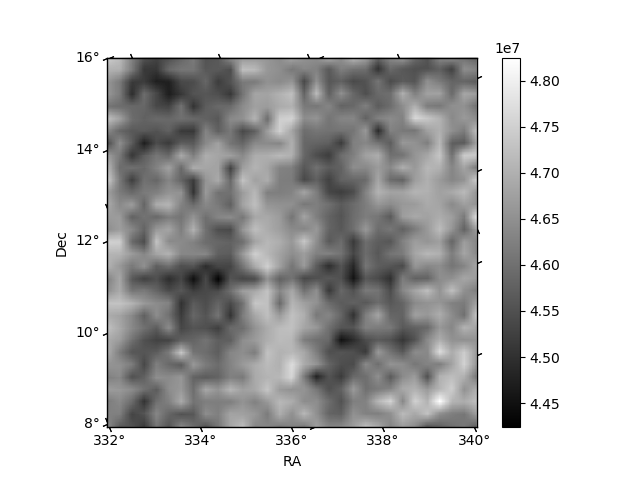
Histogram calculated using DETX and DETY for each event in the final _common_clean file
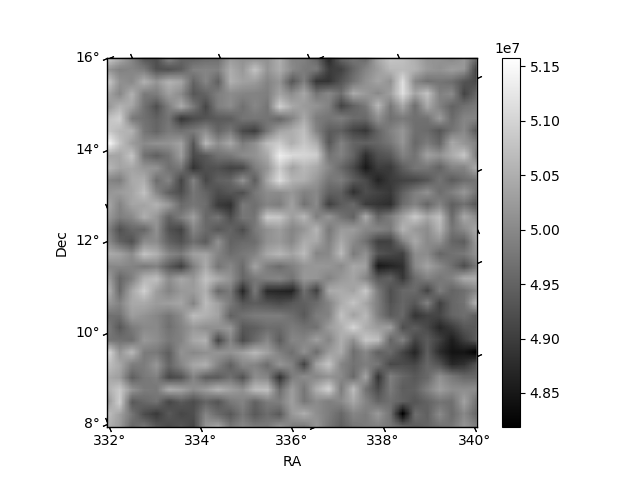
| Quadrant A | 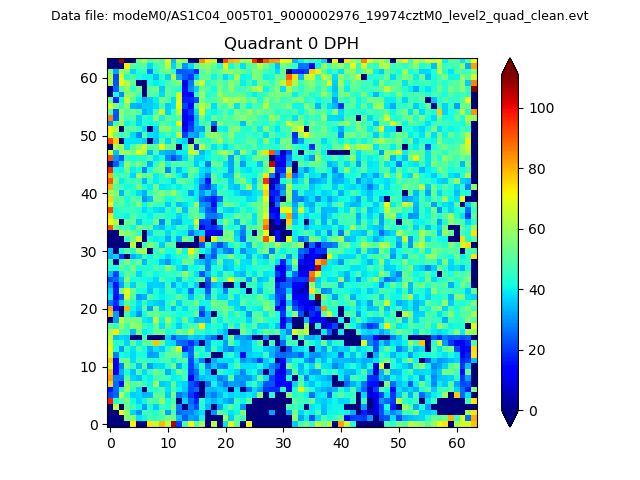 |
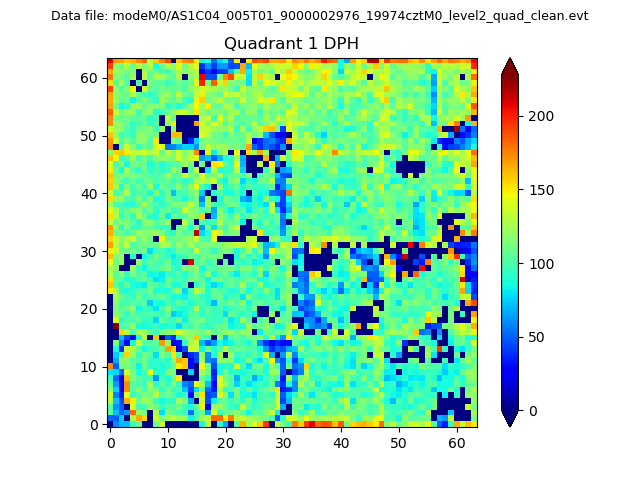 |
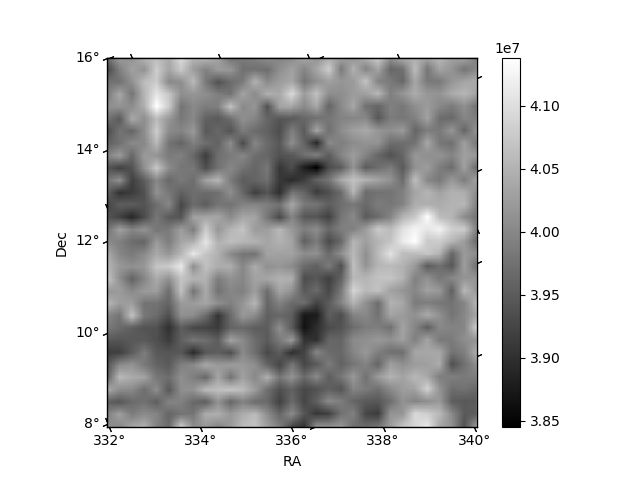
Quadrant B |
|---|---|---|---|
| Quadrant D | 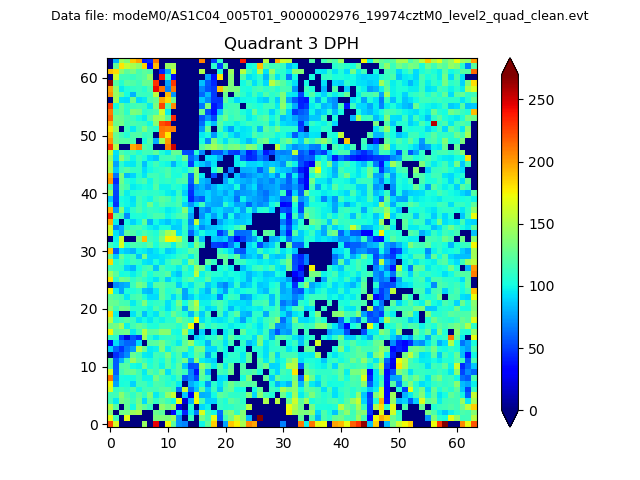 |
 |
Quadrant C |
| Plot type | Count rate plots | Images |
|---|---|---|
| Comparison with Poisson distribution Blue bars denote a histogram of data divided into 1 sec bins. Red curve is a Poisson curve with rate = median count rate of data. |
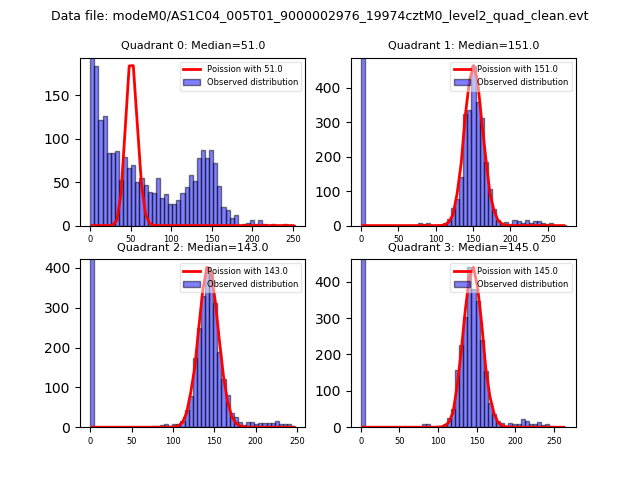 |
 |
| Quadrant-wise count rates Data is divided into 100 sec bins |
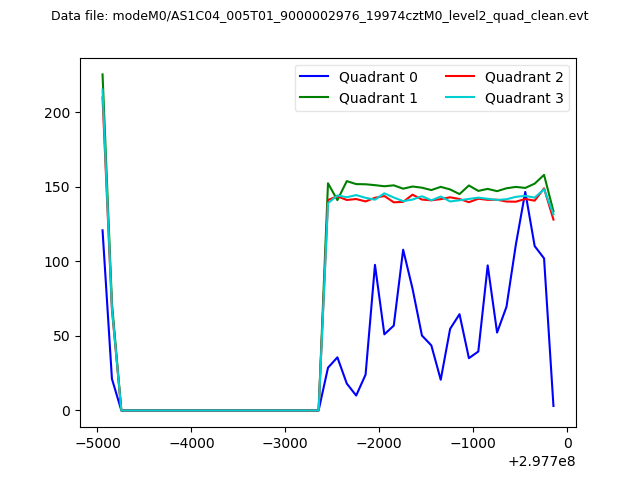 |
|
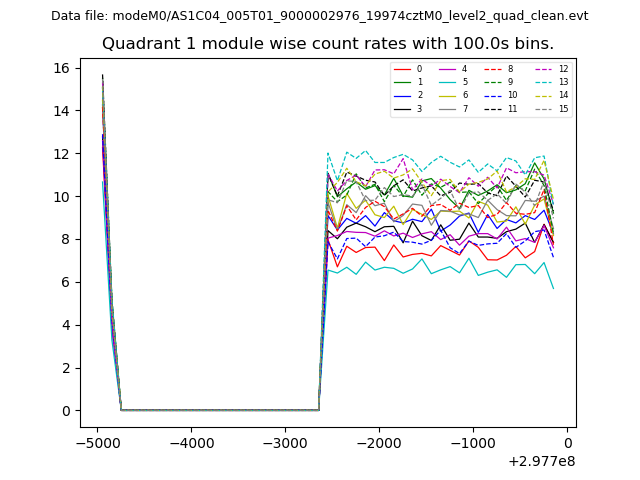
| Module-wise count rates for Quadrant A Data is divided into 100 sec bins |
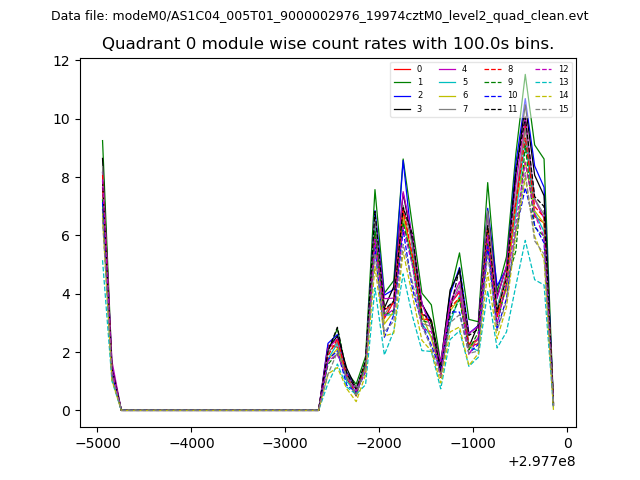 |
 |
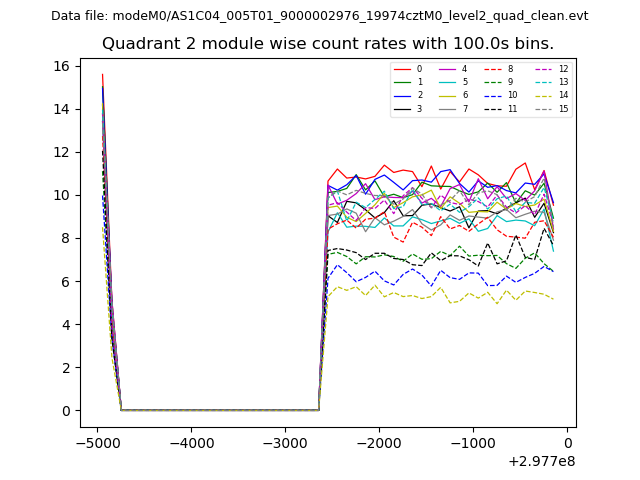
| Module-wise count rates for Quadrant B Data is divided into 100 sec bins |
 |
 |
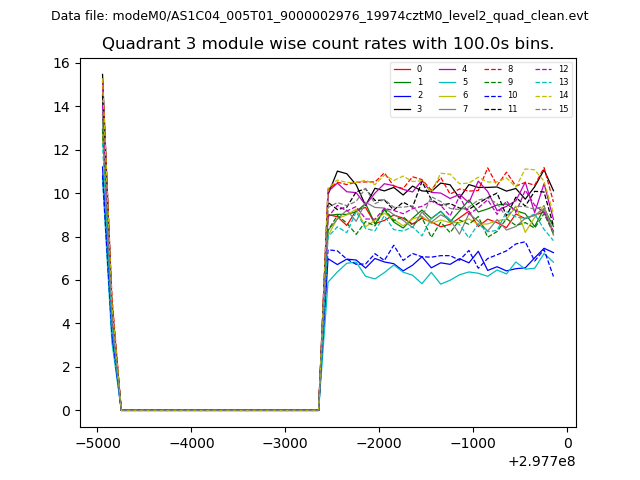
| Module-wise count rates for Quadrant C Data is divided into 100 sec bins |
 |
 |
| Module-wise count rates for Quadrant D Data is divided into 100 sec bins |
 |
 |
| Parameter | Plot |
|---|---|
| CZT HV Monitor | 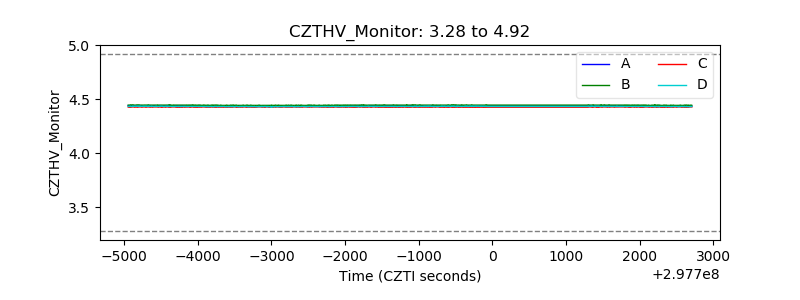 |
| D_VDD | 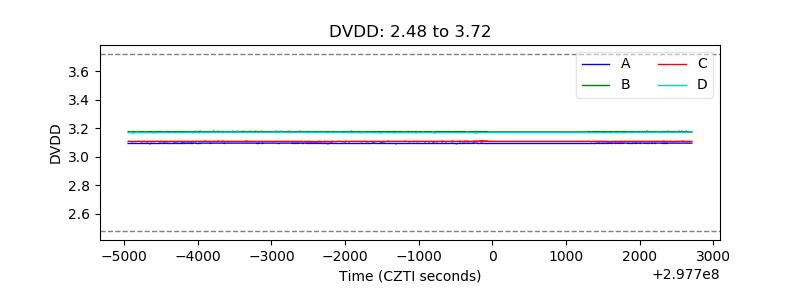 |
| Temperature 1 | 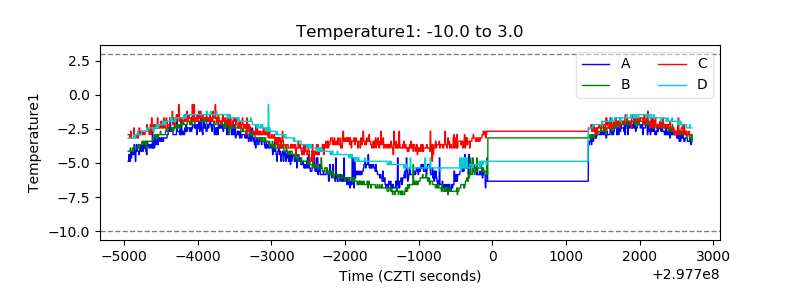 |
| Veto HV Monitor |  |
| Veto LLD | 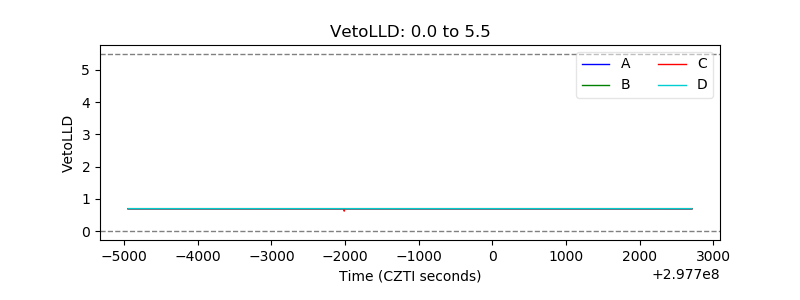 |
| Alpha Counter | 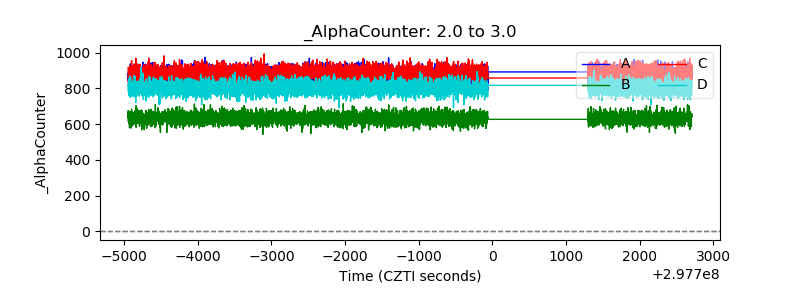 |
| _CPM_Rate | 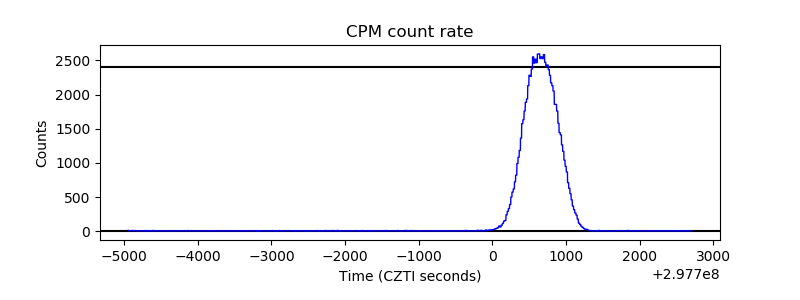 |
| CZT Counter |  |
| +2.5 Volts monitor |  |
| +5 Volts monitor |  |
| _ROLL_ROT | 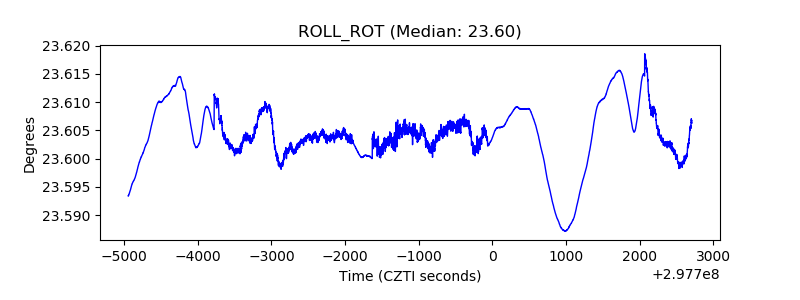 |
| _Roll_DEC | 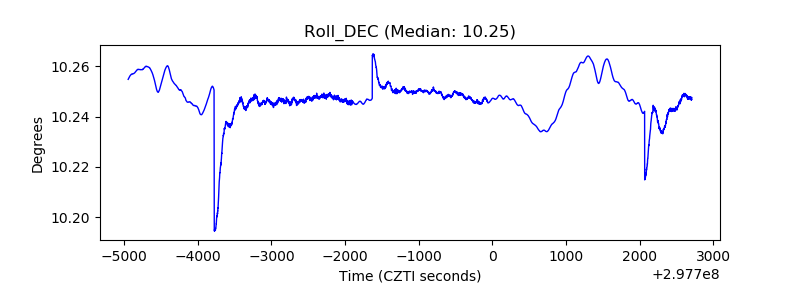 |
| _Roll_RA |  |
| Veto Counter | 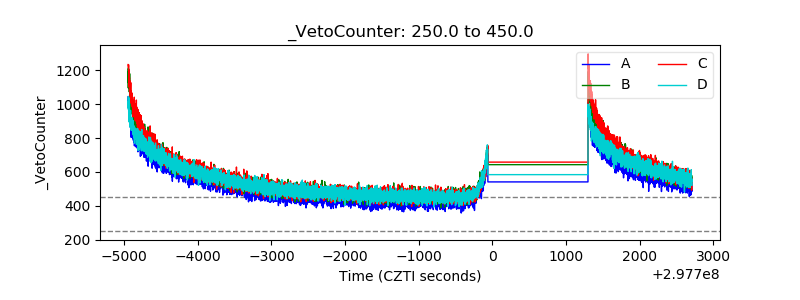 |