| Param | Original file | Final file |
|---|---|---|
| Filename | modeM0/AS1C04_005T01_9000002976_19976cztM0_level2.evt | modeM0/AS1C04_005T01_9000002976_19976cztM0_level2_quad_clean.evt |
| Size (bytes) | 764,429,760 | 69,500,160 |
| Size | 729.0 MB | 66.3 MB |
| Events in quadrant A | 11,807,295 | 216,897 |
| Events in quadrant B | 3,380,410 | 501,163 |
| Events in quadrant C | 3,993,462 | 476,561 |
| Events in quadrant D | 3,551,125 | 476,906 |
| Mode M0 | |||
|---|---|---|---|
| Quadrant | BADHDUFLAG | Total packets | Discarded packets |
| A | 0 | 39321 | 3 |
| B | 0 | 13815 | 2 |
| C | 0 | 16038 | 2 |
| D | 0 | 14402 | 2 |
| Mode SS | |||
|---|---|---|---|
| Quadrant | BADHDUFLAG | Total packets | Discarded packets |
| A | 0 | 126 | 0 |
| B | 0 | 126 | 0 |
| C | 0 | 126 | 0 |
| D | 0 | 126 | 0 |
| Mode M9 | |||
|---|---|---|---|
| Quadrant | BADHDUFLAG | Total packets | Discarded packets |
| A | 0 | 19 | 0 |
| B | 0 | 20 | 0 |
| C | 0 | 20 | 0 |
| D | 0 | 20 | 0 |
| Quadrant | Total seconds | Saturated seconds | Saturation percentage |
|---|---|---|---|
| A | 6182 | 4322 | 69.912650% |
| B | 6182 | 98 | 1.585247% |
| C | 6182 | 187 | 3.024911% |
| D | 6182 | 148 | 2.394047% |
Noise dominated data is calculated using 1-second bins in cleaned event files. If a bin has >2000 counts, and if more than 50% of those come from <1% of pixels, then it is considered to be noise-dominated and hence unusable.
| Quadrant | # 1 sec bins | Bins with >0 counts | Bins with >2000 counts | High rate bins dominated by noise | Noise dominated (total time) | Noise dominated (detector-on time) | Marked lightcurve |
|---|---|---|---|---|---|---|---|
| A | 7492 | 6183 | 3418 | 3418 | 45.62% | 55.28% | 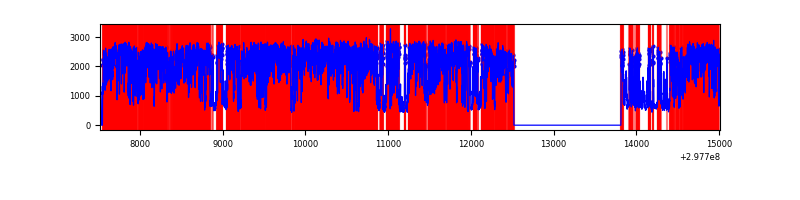 |
| B | 7492 | 6182 | 2 | 2 | 0.03% | 0.03% | 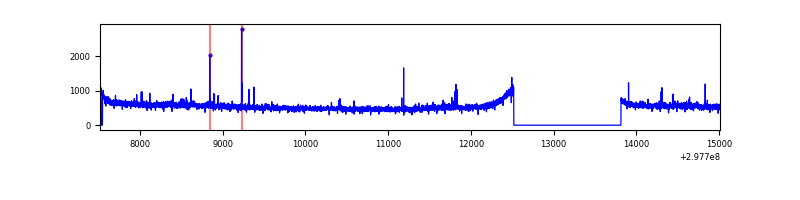 |
| C | 7492 | 6182 | 14 | 14 | 0.19% | 0.23% | 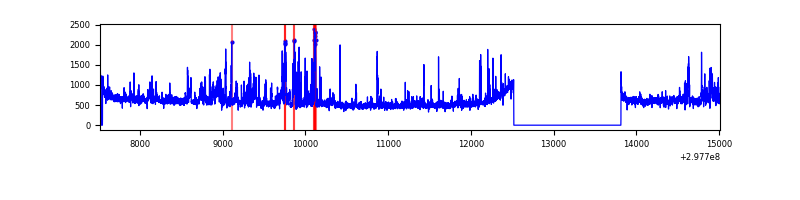 |
| D | 7492 | 6183 | 78 | 78 | 1.04% | 1.26% | 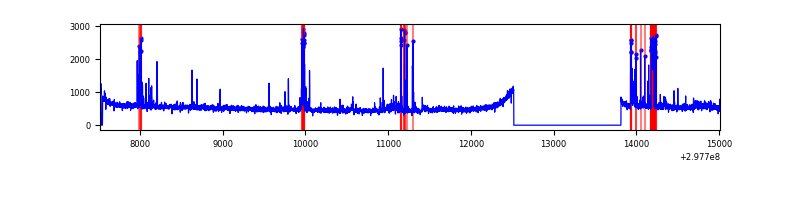 |
Top three noisy pixels from each quadrant. If the there are fewer than three noisy pixels in the level2.evt file, extra rows are filled as -1
| Pixel properties | Quadrant properties | ||||||
|---|---|---|---|---|---|---|---|
| Quadrant | DetID | PixID | Counts | Sigma | Mean | Median | Sigma |
| A | 14 | 238 | 9749567 | 104754.2 | 462 | 454 | 93.1 |
| A | 14 | 254 | 260714 | 2796.49 | 462 | 454 | 93.1 |
| A | 14 | 237 | 13787 | 143.26 | 462 | 454 | 93.1 |
| B | 12 | 111 | 18712 | 112.33 | 848 | 831 | 159.2 |
| B | 11 | 111 | 16563 | 98.83 | 848 | 831 | 159.2 |
| B | 4 | 171 | 15668 | 93.21 | 848 | 831 | 159.2 |
| C | 9 | 221 | 572084 | 3031.15 | 819 | 826 | 188.5 |
| C | 14 | 238 | 128714 | 678.58 | 819 | 826 | 188.5 |
| C | 3 | 233 | 80449 | 422.49 | 819 | 826 | 188.5 |
| D | 1 | 52 | 273681 | 1352.7 | 835 | 813 | 201.7 |
| D | 7 | 96 | 70592 | 345.92 | 835 | 813 | 201.7 |
| D | 12 | 218 | 38927 | 188.94 | 835 | 813 | 201.7 |
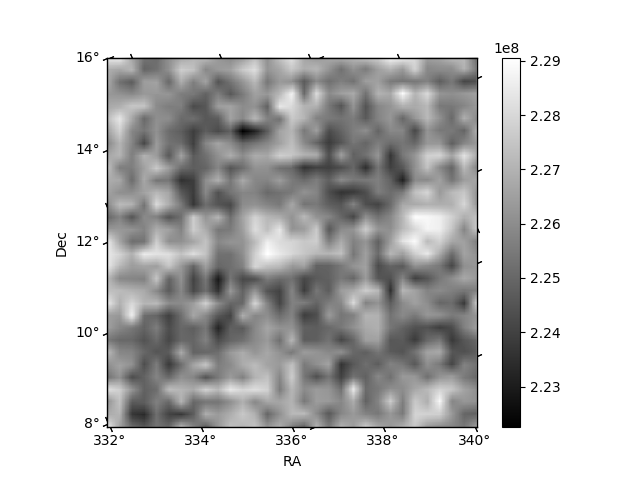
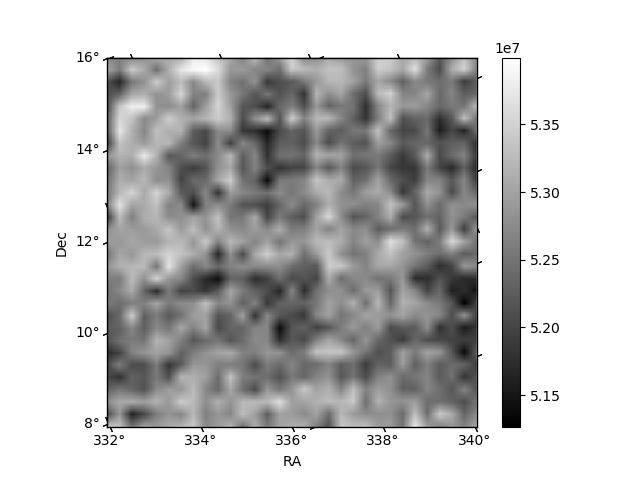
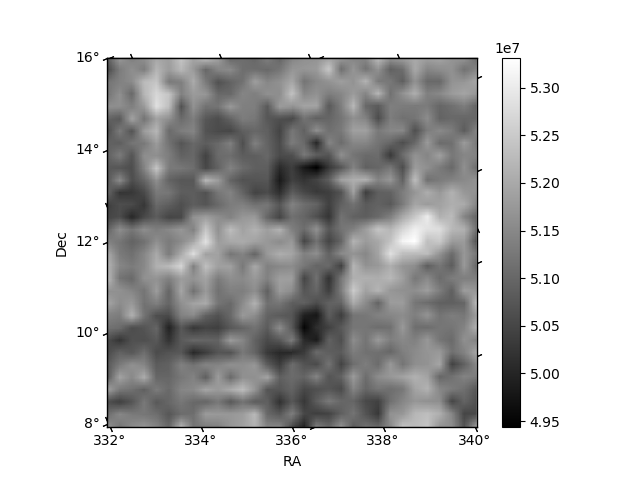
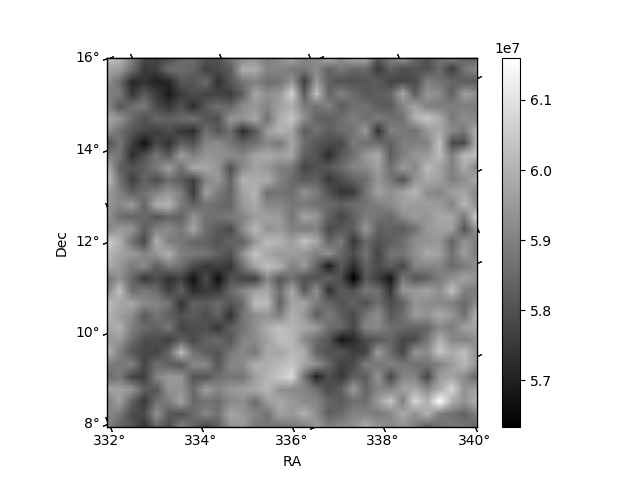
Histogram calculated using DETX and DETY for each event in the final _common_clean file
| Quadrant A | 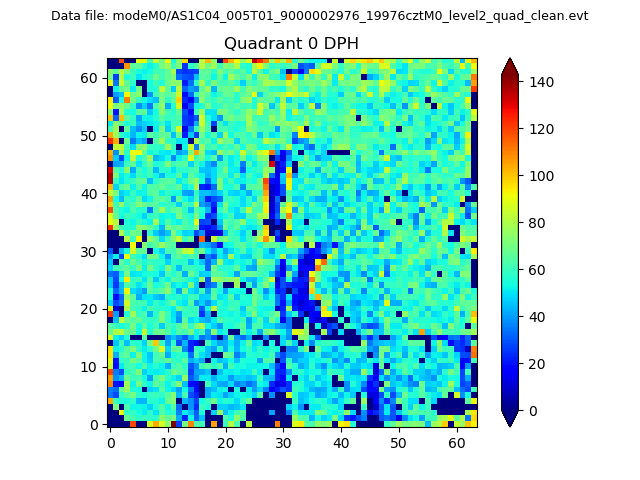 |
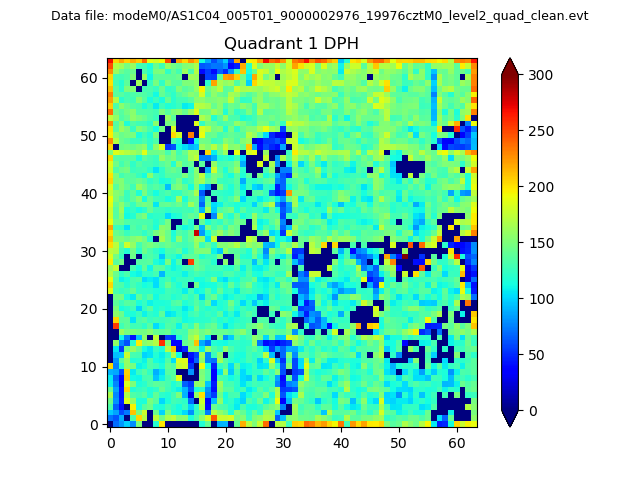 |
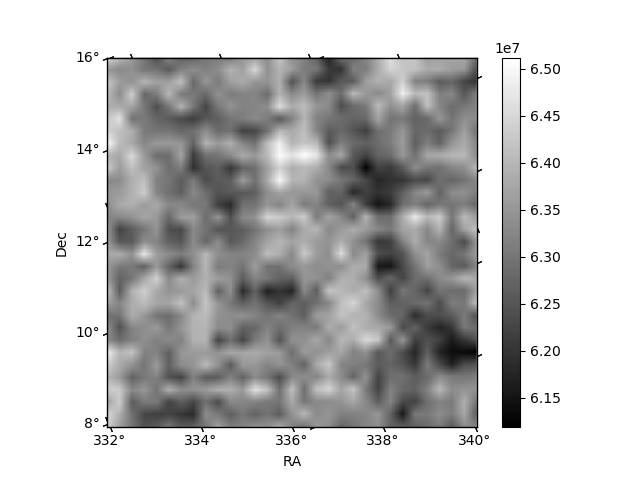
Quadrant B |
|---|---|---|---|
| Quadrant D | 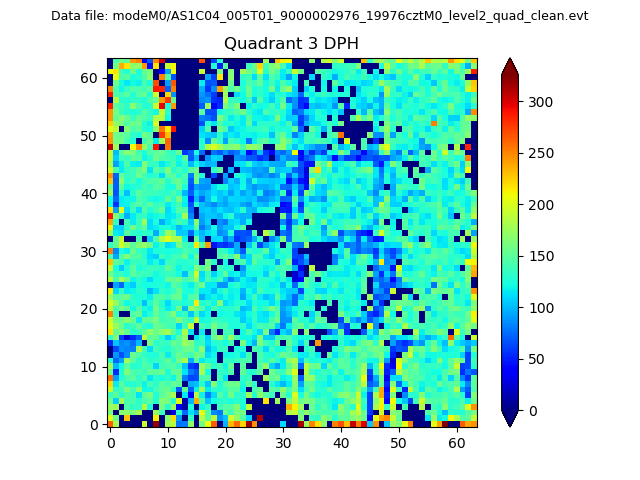 |
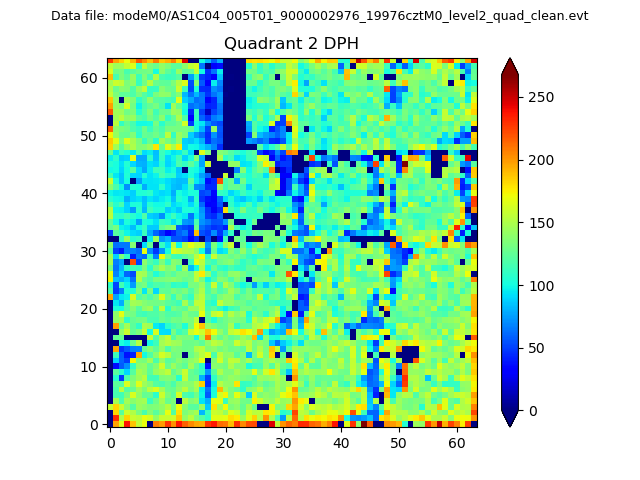 |
Quadrant C |
| Plot type | Count rate plots | Images |
|---|---|---|
| Comparison with Poisson distribution Blue bars denote a histogram of data divided into 1 sec bins. Red curve is a Poisson curve with rate = median count rate of data. |
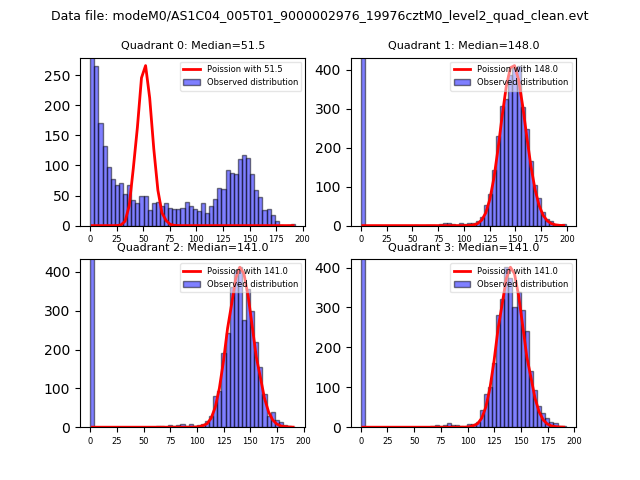 |
 |
| Quadrant-wise count rates Data is divided into 100 sec bins |
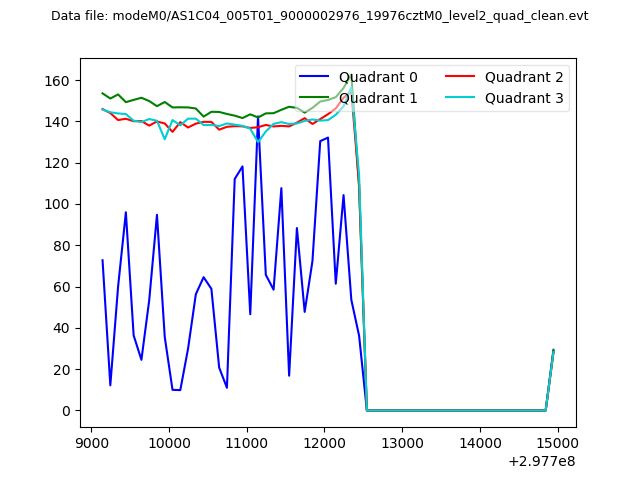 |
|
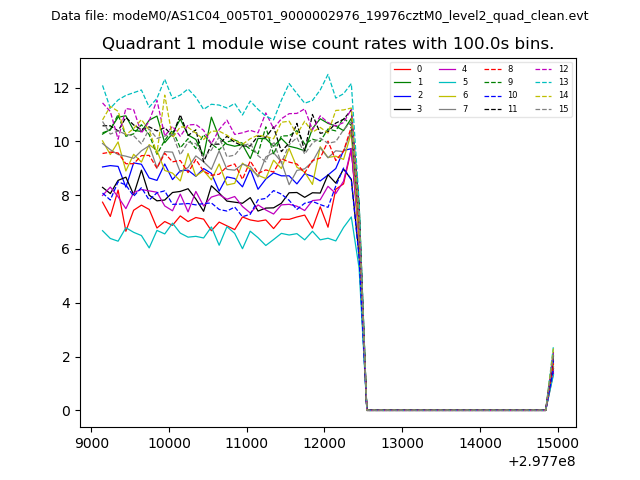
| Module-wise count rates for Quadrant A Data is divided into 100 sec bins |
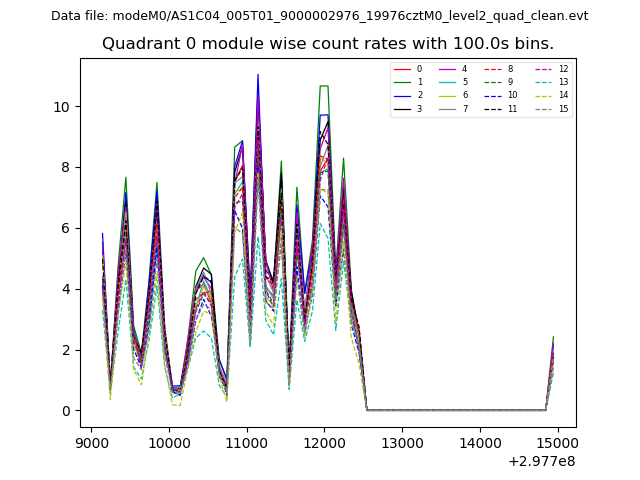 |
 |
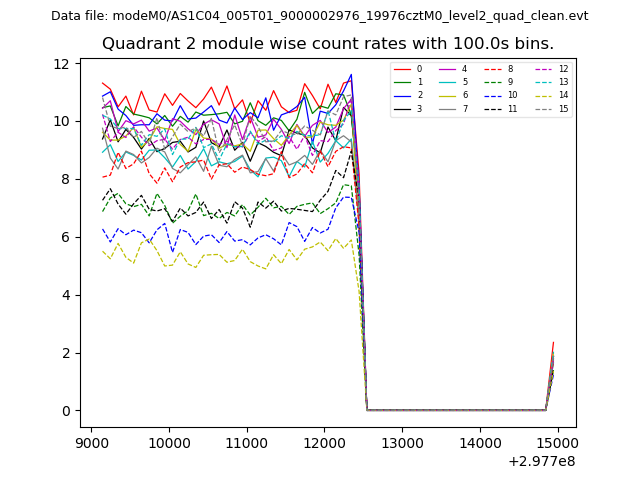
| Module-wise count rates for Quadrant B Data is divided into 100 sec bins |
 |
 |
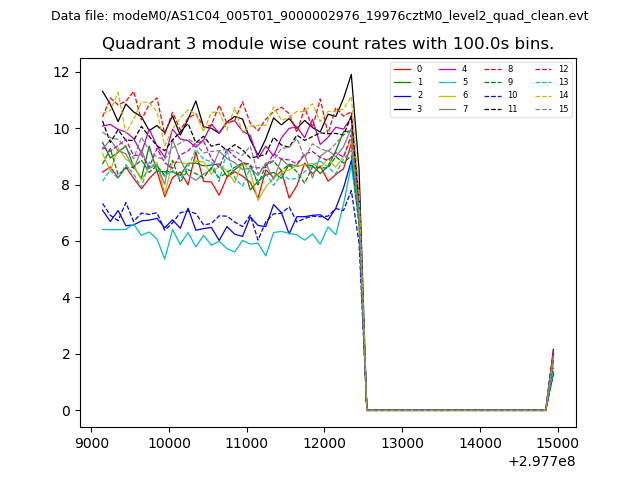
| Module-wise count rates for Quadrant C Data is divided into 100 sec bins |
 |
 |
| Module-wise count rates for Quadrant D Data is divided into 100 sec bins |
 |
 |
| Parameter | Plot |
|---|---|
| CZT HV Monitor | 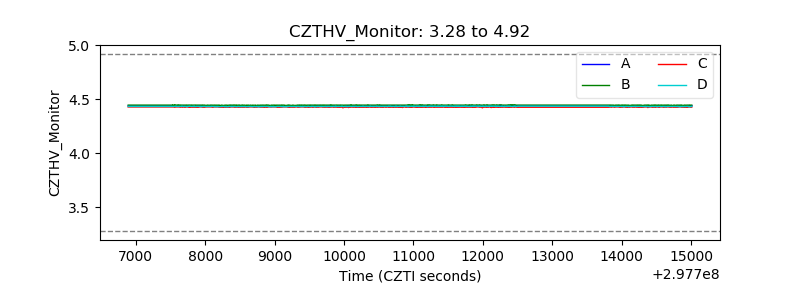 |
| D_VDD | 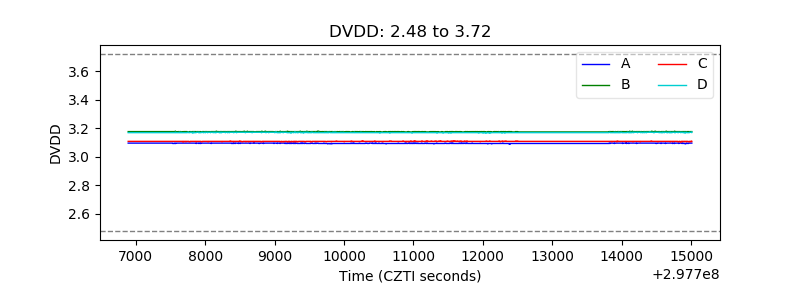 |
| Temperature 1 | 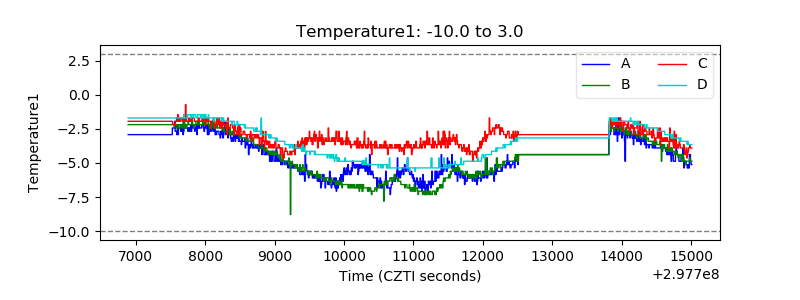 |
| Veto HV Monitor |  |
| Veto LLD | 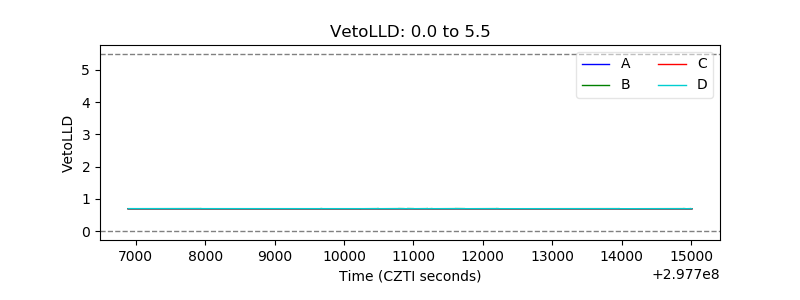 |
| Alpha Counter | 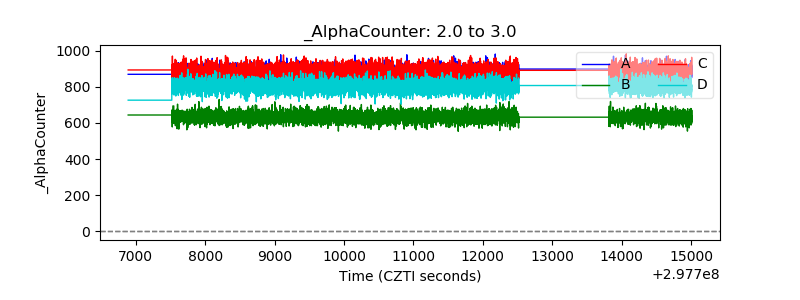 |
| _CPM_Rate | 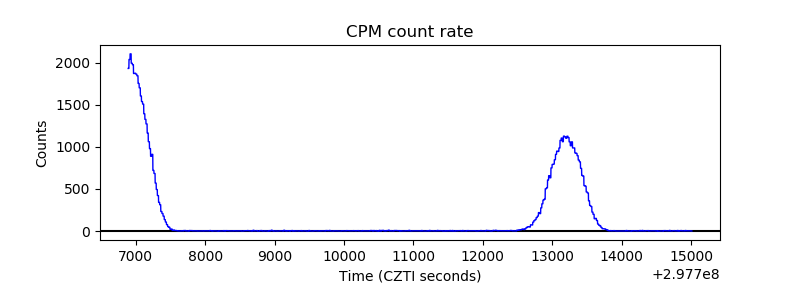 |
| CZT Counter | 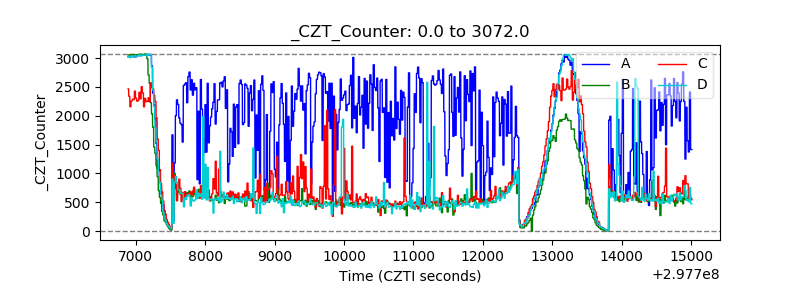 |
| +2.5 Volts monitor |  |
| +5 Volts monitor |  |
| _ROLL_ROT | 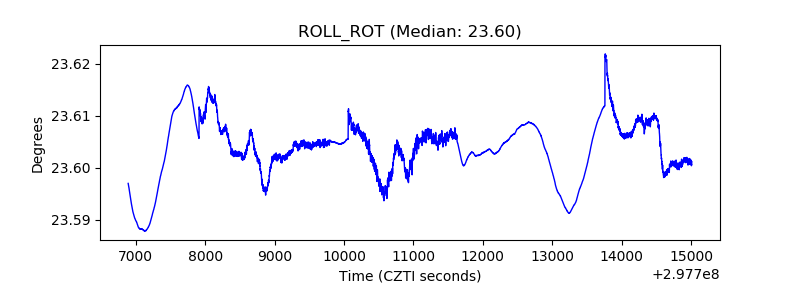 |
| _Roll_DEC | 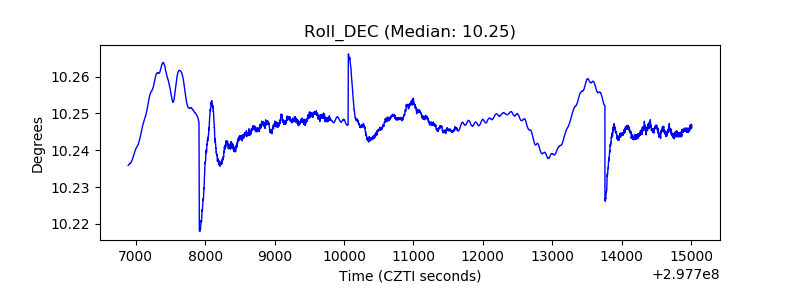 |
| _Roll_RA | 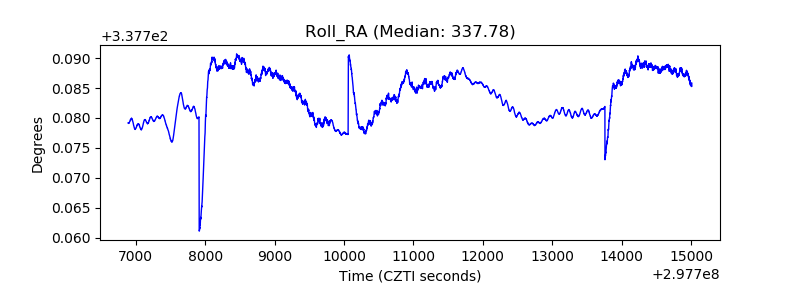 |
| Veto Counter | 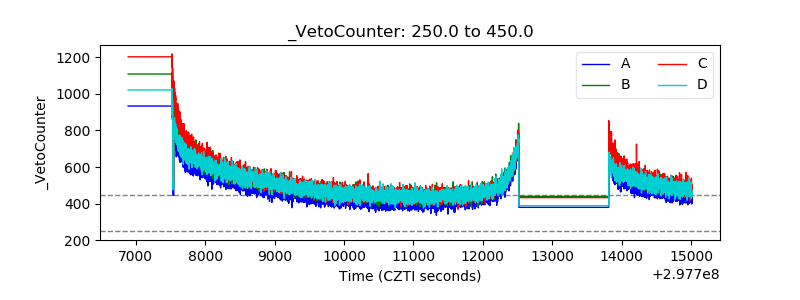 |