| Param | Original file | Final file |
|---|---|---|
| Filename | modeM0/AS1C04_005T01_9000002976_19977cztM0_level2.evt | modeM0/AS1C04_005T01_9000002976_19977cztM0_level2_quad_clean.evt |
| Size (bytes) | 246,421,440 | 22,806,720 |
| Size | 235.0 MB | 21.8 MB |
| Events in quadrant A | 3,773,426 | 82,333 |
| Events in quadrant B | 1,065,491 | 158,646 |
| Events in quadrant C | 1,325,530 | 148,886 |
| Events in quadrant D | 1,156,194 | 150,069 |
| Mode M0 | |||
|---|---|---|---|
| Quadrant | BADHDUFLAG | Total packets | Discarded packets |
| A | 0 | 12649 | 0 |
| B | 0 | 4305 | 0 |
| C | 0 | 5329 | 0 |
| D | 0 | 4725 | 0 |
| Mode SS | |||
|---|---|---|---|
| Quadrant | BADHDUFLAG | Total packets | Discarded packets |
| A | 0 | 42 | 0 |
| B | 0 | 42 | 0 |
| C | 0 | 42 | 0 |
| D | 0 | 42 | 0 |
| Quadrant | Total seconds | Saturated seconds | Saturation percentage |
|---|---|---|---|
| A | 2061 | 1236 | 59.970888% |
| B | 2062 | 5 | 0.242483% |
| C | 2062 | 42 | 2.036857% |
| D | 2062 | 56 | 2.715810% |
Noise dominated data is calculated using 1-second bins in cleaned event files. If a bin has >2000 counts, and if more than 50% of those come from <1% of pixels, then it is considered to be noise-dominated and hence unusable.
| Quadrant | # 1 sec bins | Bins with >0 counts | Bins with >2000 counts | High rate bins dominated by noise | Noise dominated (total time) | Noise dominated (detector-on time) | Marked lightcurve |
|---|---|---|---|---|---|---|---|
| A | 2060 | 2060 | 1073 | 1073 | 52.09% | 52.09% | 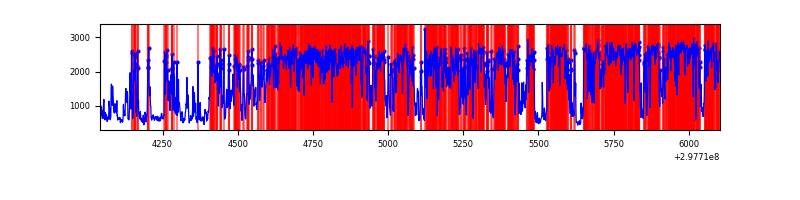 |
| B | 2062 | 2062 | 0 | 0 | 0.00% | 0.00% | 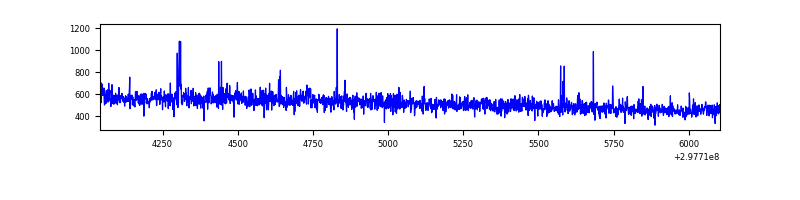 |
| C | 2062 | 2062 | 0 | 0 | 0.00% | 0.00% | 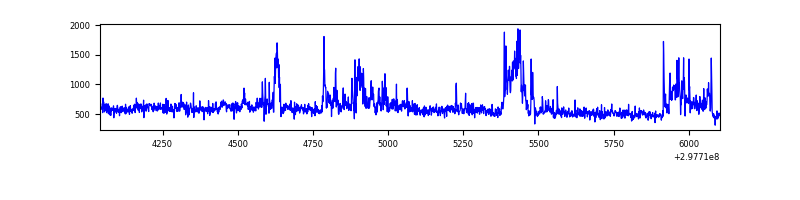 |
| D | 2062 | 2062 | 48 | 48 | 2.33% | 2.33% | 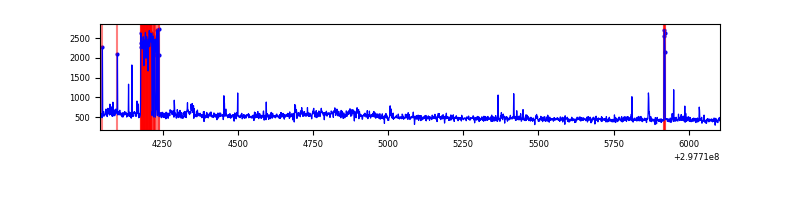 |
Top three noisy pixels from each quadrant. If the there are fewer than three noisy pixels in the level2.evt file, extra rows are filled as -1
| Pixel properties | Quadrant properties | ||||||
|---|---|---|---|---|---|---|---|
| Quadrant | DetID | PixID | Counts | Sigma | Mean | Median | Sigma |
| A | 14 | 238 | 3071845 | 81255.55 | 178 | 175 | 37.8 |
| A | 14 | 254 | 6323 | 162.63 | 178 | 175 | 37.8 |
| A | 10 | 253 | 2624 | 64.78 | 178 | 175 | 37.8 |
| B | 4 | 171 | 7970 | 145.18 | 269 | 263 | 53.1 |
| B | 12 | 111 | 6042 | 108.86 | 269 | 263 | 53.1 |
| B | 11 | 111 | 5317 | 95.2 | 269 | 263 | 53.1 |
| C | 9 | 221 | 217654 | 3528.5 | 259 | 261 | 61.6 |
| C | 14 | 238 | 41423 | 668.1 | 259 | 261 | 61.6 |
| C | 3 | 233 | 41315 | 666.35 | 259 | 261 | 61.6 |
| D | 1 | 52 | 132067 | 2011.35 | 262 | 255 | 65.5 |
| D | 12 | 218 | 26528 | 400.91 | 262 | 255 | 65.5 |
| D | 2 | 234 | 8794 | 130.3 | 262 | 255 | 65.5 |
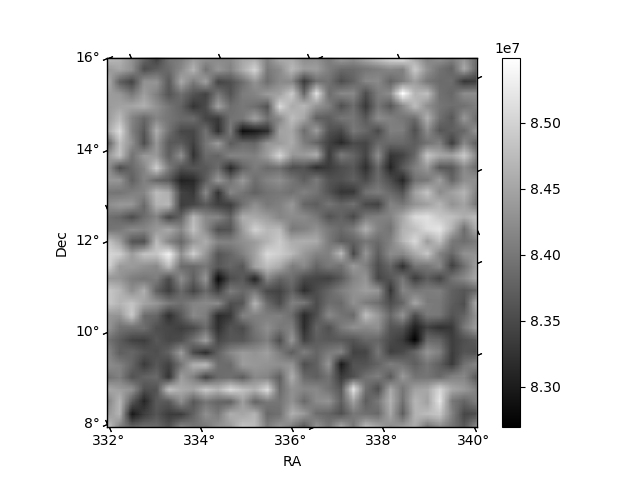
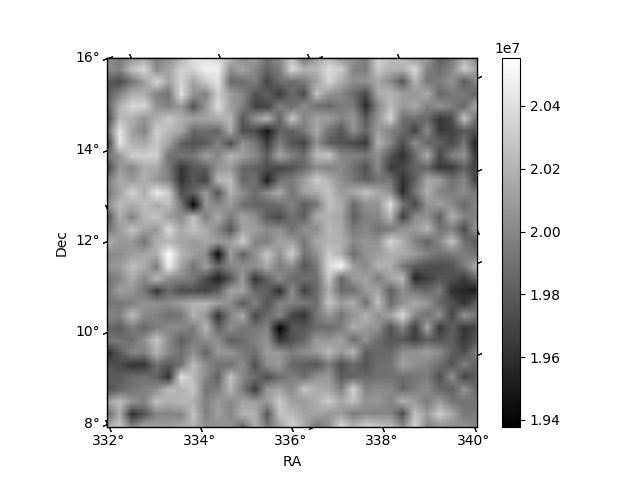
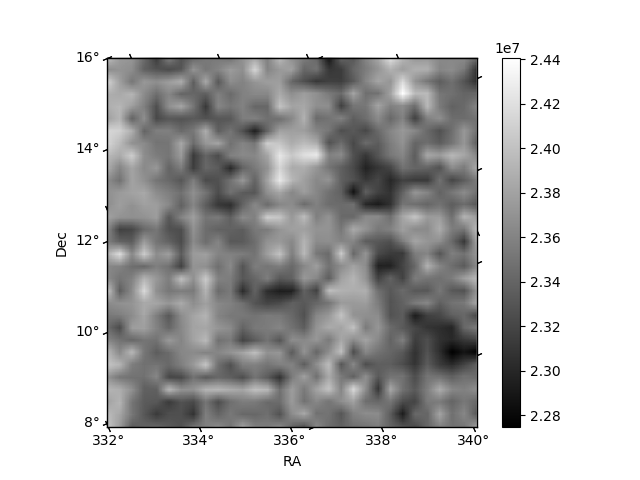
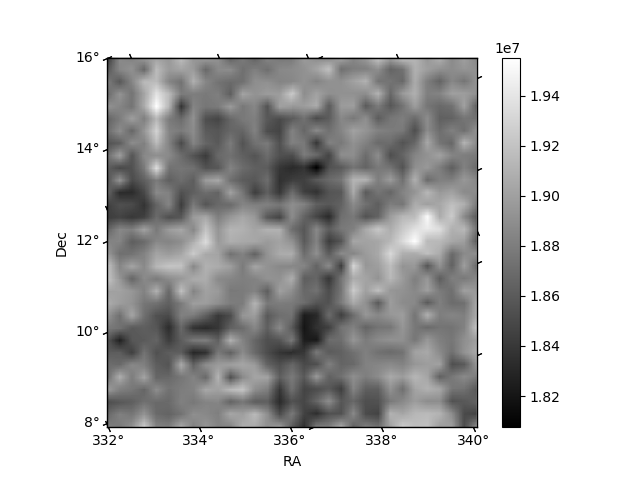
Histogram calculated using DETX and DETY for each event in the final _common_clean file
| Quadrant A | 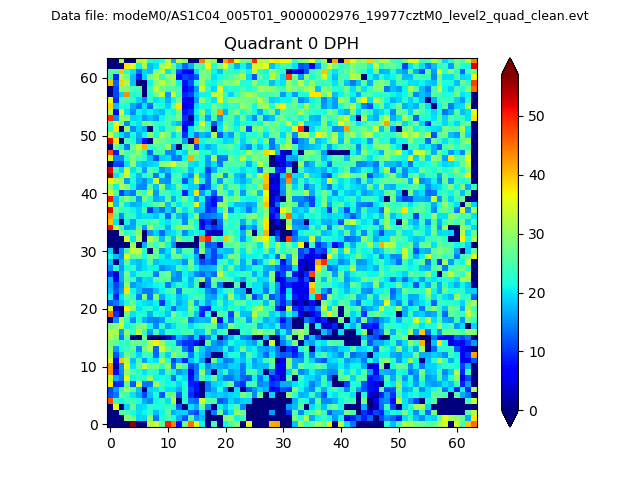 |
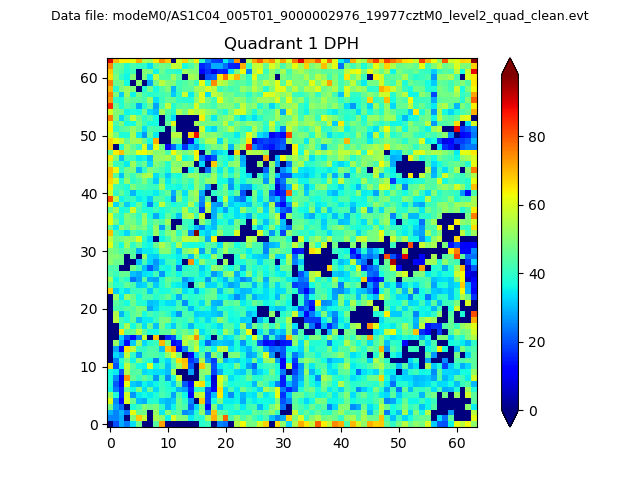 |
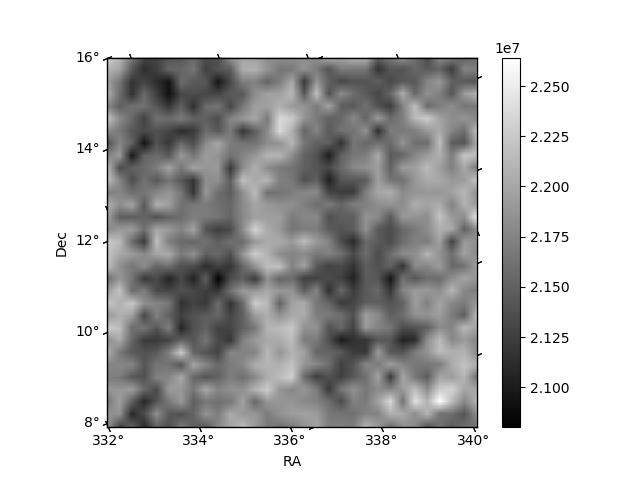
Quadrant B |
|---|---|---|---|
| Quadrant D | 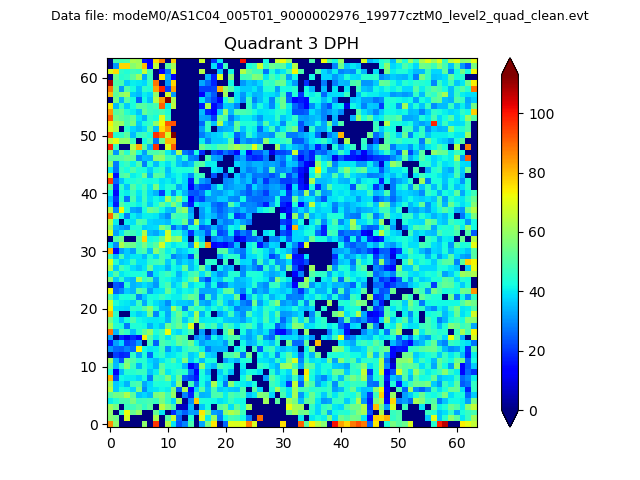 |
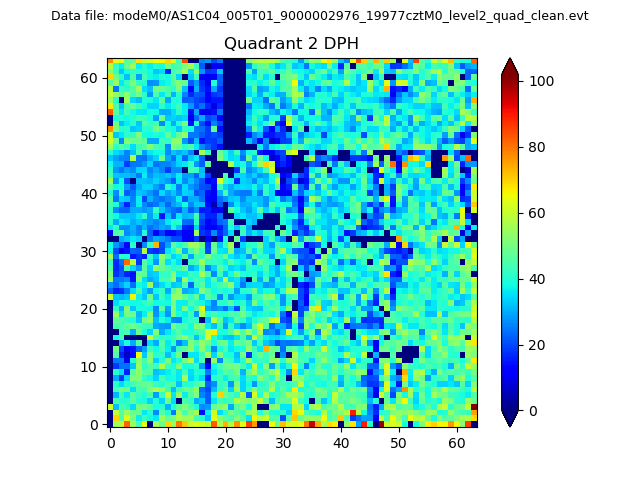 |
Quadrant C |
| Plot type | Count rate plots | Images |
|---|---|---|
| Comparison with Poisson distribution Blue bars denote a histogram of data divided into 1 sec bins. Red curve is a Poisson curve with rate = median count rate of data. |
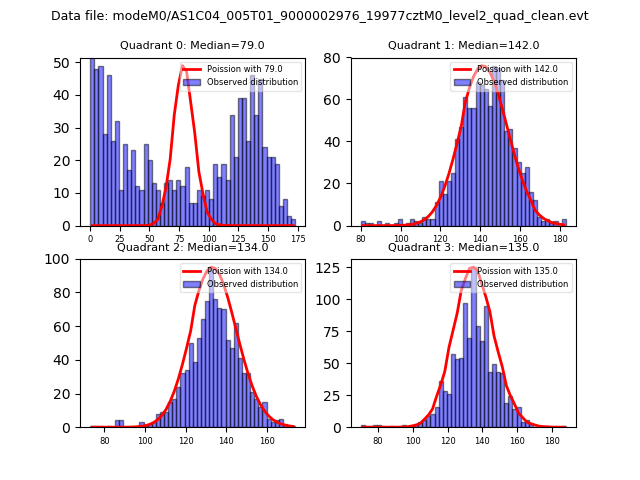 |
 |
| Quadrant-wise count rates Data is divided into 100 sec bins |
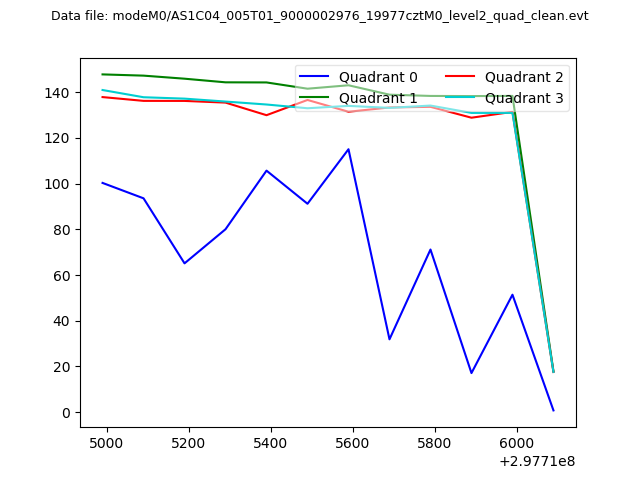 |
|
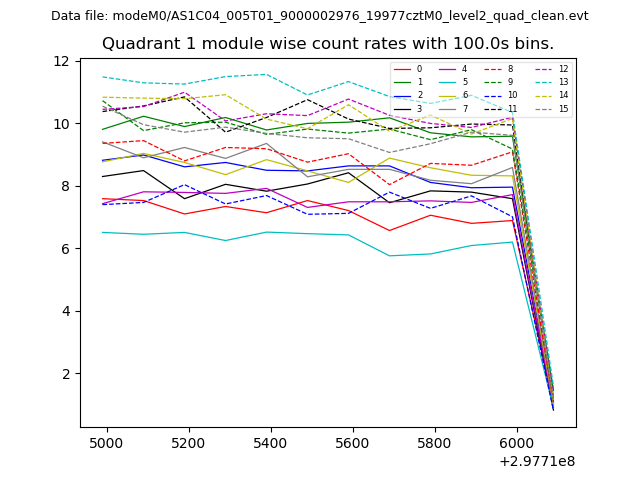
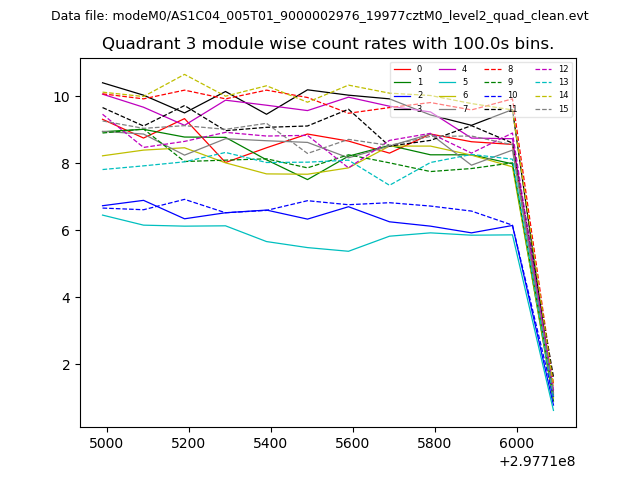
| Module-wise count rates for Quadrant A Data is divided into 100 sec bins |
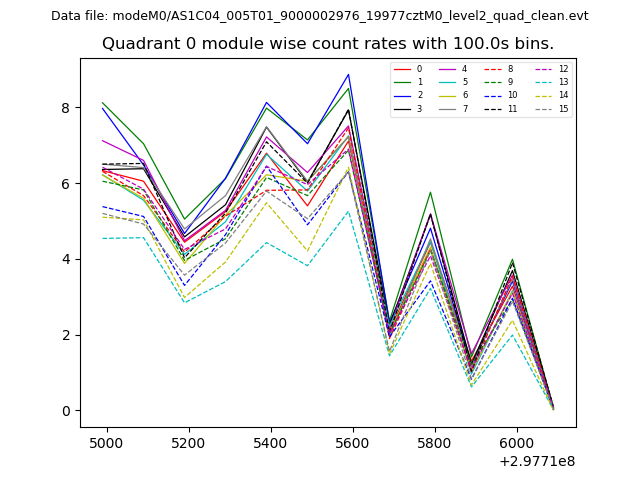 |
 |
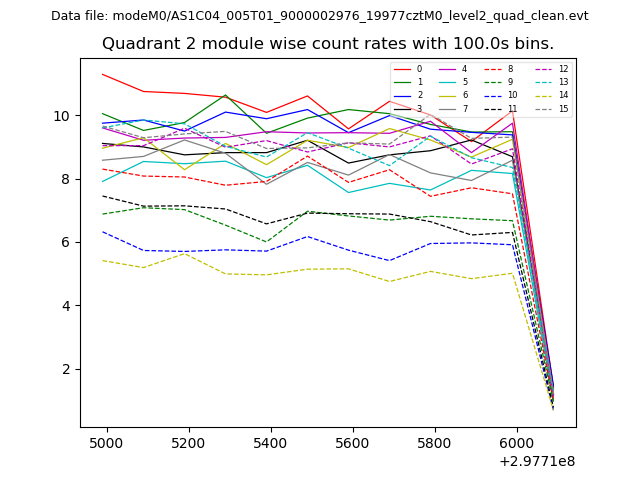
| Module-wise count rates for Quadrant B Data is divided into 100 sec bins |
 |
 |
| Module-wise count rates for Quadrant C Data is divided into 100 sec bins |
 |
 |
| Module-wise count rates for Quadrant D Data is divided into 100 sec bins |
 |
 |
| Parameter | Plot |
|---|---|
| CZT HV Monitor | 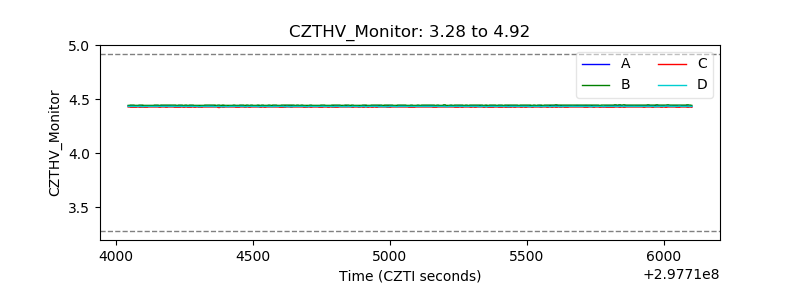 |
| D_VDD | 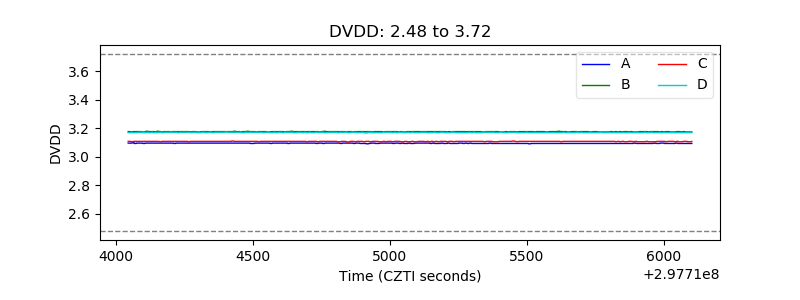 |
| Temperature 1 | 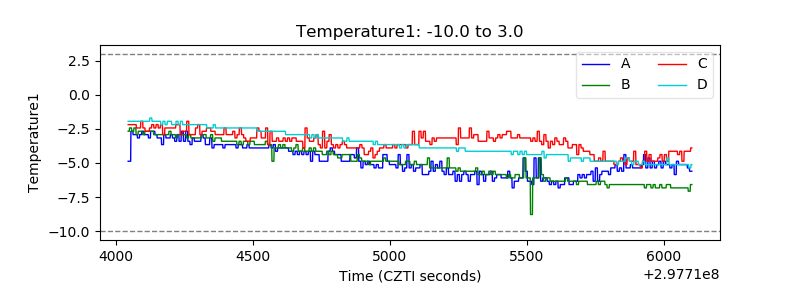 |
| Veto HV Monitor | 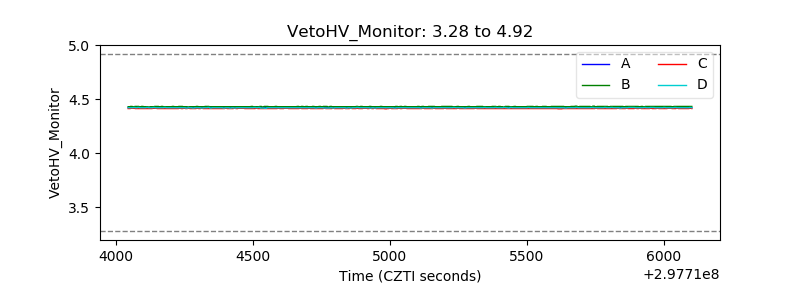 |
| Veto LLD | 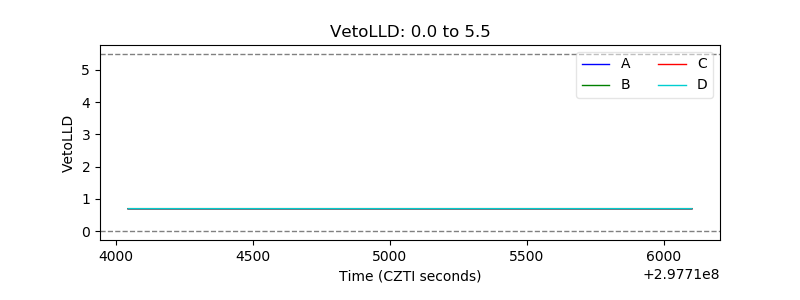 |
| Alpha Counter | 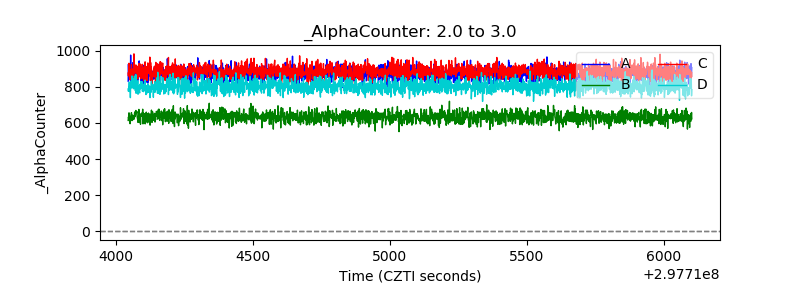 |
| _CPM_Rate | 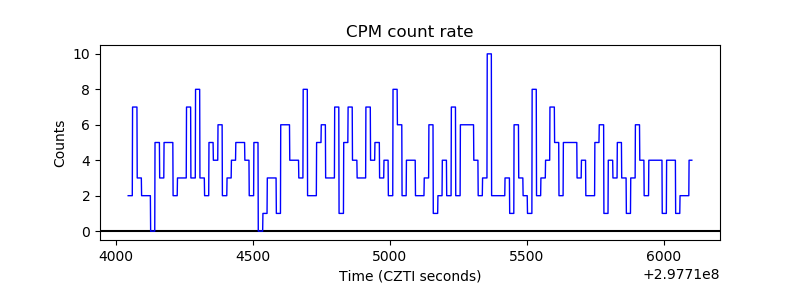 |
| CZT Counter | 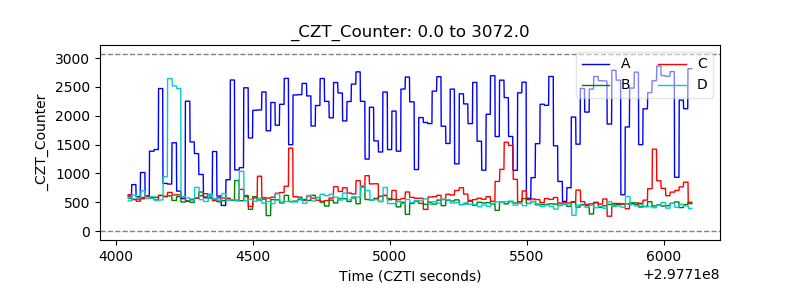 |
| +2.5 Volts monitor |  |
| +5 Volts monitor | 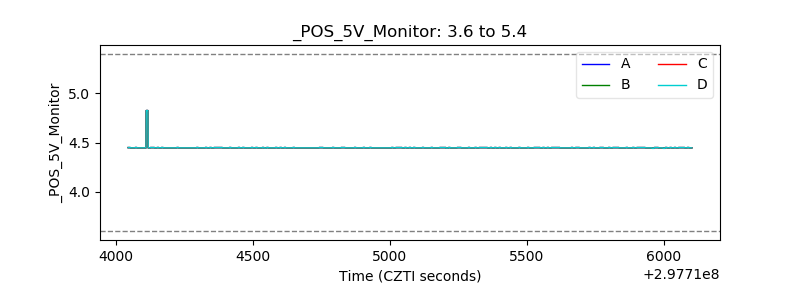 |
| _ROLL_ROT | 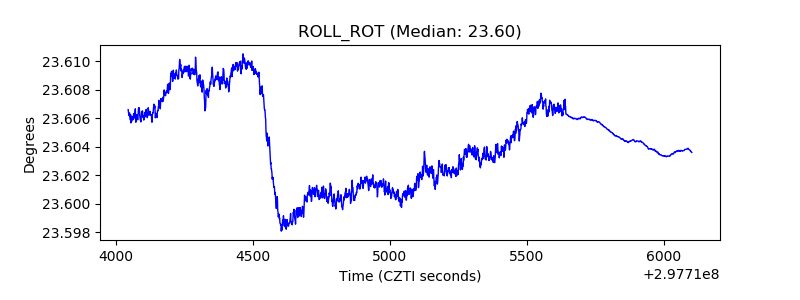 |
| _Roll_DEC | 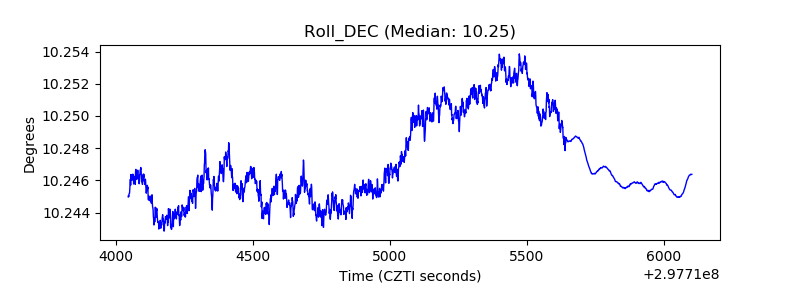 |
| _Roll_RA | 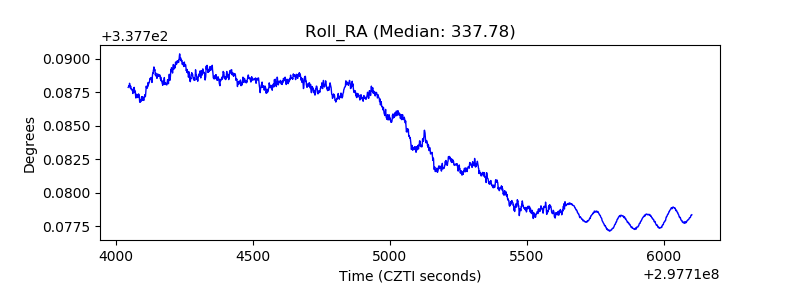 |
| Veto Counter | 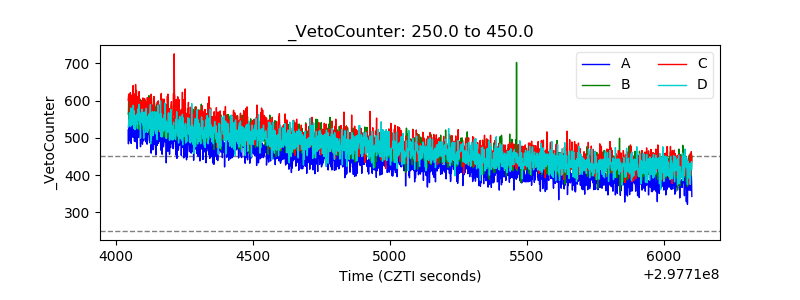 |