| Param | Original file | Final file |
|---|---|---|
| Filename | modeM0/AS1A05_022T08_9000002980cztM0_level2.fits | modeM0/AS1A05_022T08_9000002980cztM0_level2_quad_clean.evt |
| Size (bytes) | 141,880,320 | 139,956,480 |
| Size | 135.3 MB | 133.5 MB |
| Events in quadrant A | 838,114 | 815,207 |
| Events in quadrant B | 859,238 | 868,971 |
| Events in quadrant C | 858,564 | 809,744 |
| Events in quadrant D | 749,504 | 753,322 |
| Mode SS | |||
|---|---|---|---|
| Quadrant | BADHDUFLAG | Total packets | Discarded packets |
| A | 0 | 290 | 0 |
| B | 0 | 290 | 0 |
| C | 0 | 290 | 0 |
| D | 0 | 290 | 0 |
| Mode M9 | |||
|---|---|---|---|
| Quadrant | BADHDUFLAG | Total packets | Discarded packets |
| A | 0 | 28 | 0 |
| B | 0 | 28 | 0 |
| C | 0 | 28 | 0 |
| D | 0 | 28 | 0 |
| Mode M0 | |||
|---|---|---|---|
| Quadrant | BADHDUFLAG | Total packets | Discarded packets |
| A | 0 | 45450 | 0 |
| B | 0 | 31161 | 0 |
| C | 0 | 32229 | 0 |
| D | 0 | 39259 | 0 |
| Quadrant | Total seconds | Saturated seconds | Saturation percentage |
|---|---|---|---|
| A | 14350 | 2026 | 14.118467% |
| B | 14350 | 179 | 1.247387% |
| C | 14350 | 356 | 2.480836% |
| D | 14350 | 723 | 5.038328% |
Noise dominated data is calculated using 1-second bins in cleaned event files. If a bin has >2000 counts, and if more than 50% of those come from <1% of pixels, then it is considered to be noise-dominated and hence unusable.
| Quadrant | # 1 sec bins | Bins with >0 counts | Bins with >2000 counts | High rate bins dominated by noise | Noise dominated (total time) | Noise dominated (detector-on time) | Marked lightcurve |
|---|---|---|---|---|---|---|---|
| A | 16454 | 14259 | 0 | 0 | 0.00% | 0.00% |  |
| B | 16455 | 14347 | 0 | 0 | 0.00% | 0.00% | 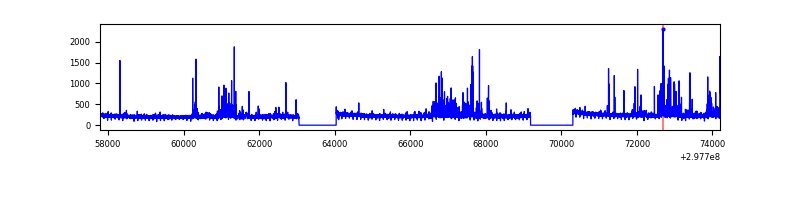 |
| C | 16454 | 14346 | 0 | 0 | 0.00% | 0.00% |  |
| D | 16455 | 14343 | 0 | 0 | 0.00% | 0.00% |  |
Top three noisy pixels from each quadrant. If the there are fewer than three noisy pixels in the level2.evt file, extra rows are filled as -1
| Pixel properties | Quadrant properties | ||||||
|---|---|---|---|---|---|---|---|
| Quadrant | DetID | PixID | Counts | Sigma | Mean | Median | Sigma |
| A | 0 | 29 | 763 | 10.07 | 218 | 206 | 55.3 |
| A | 9 | 19 | 657 | 8.16 | 218 | 206 | 55.3 |
| A | 7 | 110 | 644 | 7.92 | 218 | 206 | 55.3 |
| B | 2 | 9 | 688 | 9.78 | 227 | 217 | 48.2 |
| B | 2 | 8 | 593 | 7.81 | 227 | 217 | 48.2 |
| B | 14 | 254 | 567 | 7.27 | 227 | 217 | 48.2 |
| C | 3 | 126 | 600 | 6.47 | 227 | 213 | 59.8 |
| C | 12 | 241 | 597 | 6.42 | 227 | 213 | 59.8 |
| C | 3 | 187 | 582 | 6.17 | 227 | 213 | 59.8 |
| D | 15 | 46 | 574 | 6.53 | 214 | 196 | 57.9 |
| D | 10 | 189 | 544 | 6.01 | 214 | 196 | 57.9 |
| D | 6 | 67 | 529 | 5.75 | 214 | 196 | 57.9 |
Histogram calculated using DETX and DETY for each event in the final _common_clean file
| Quadrant A | 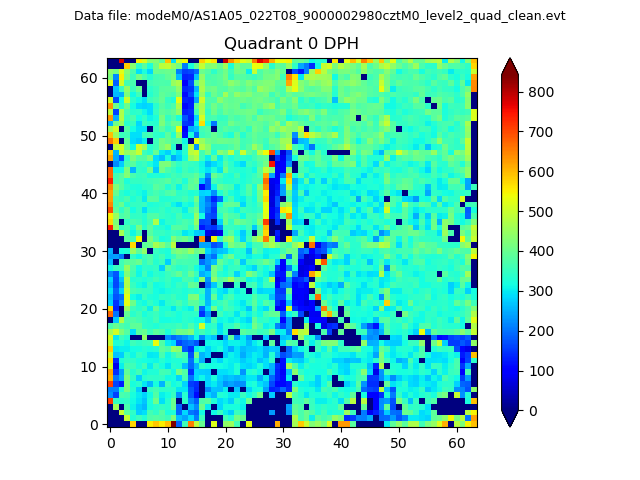 |
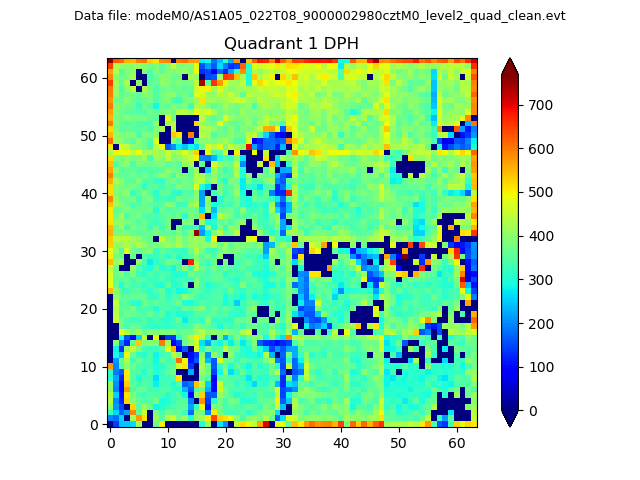 |
Quadrant B |
|---|---|---|---|
| Quadrant D | 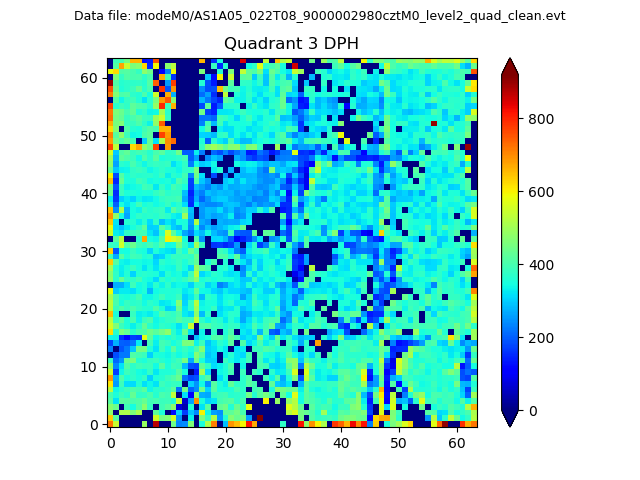 |
 |
Quadrant C |
| Plot type | Count rate plots | Images |
|---|---|---|
| Comparison with Poisson distribution Blue bars denote a histogram of data divided into 1 sec bins. Red curve is a Poisson curve with rate = median count rate of data. |
 |
 |
| Quadrant-wise count rates Data is divided into 100 sec bins |
 |
|
| Module-wise count rates for Quadrant A Data is divided into 100 sec bins |
 |
 |
| Module-wise count rates for Quadrant B Data is divided into 100 sec bins |
 |
 |
| Module-wise count rates for Quadrant C Data is divided into 100 sec bins |
 |
 |
| Module-wise count rates for Quadrant D Data is divided into 100 sec bins |
 |
 |
| Parameter | Plot |
|---|---|
| CZT HV Monitor |  |
| D_VDD |  |
| Temperature 1 |  |
| Veto HV Monitor |  |
| Veto LLD |  |
| Alpha Counter |  |
| _CPM_Rate |  |
| CZT Counter |  |
| +2.5 Volts monitor |  |
| +5 Volts monitor |  |
| _ROLL_ROT |  |
| _Roll_DEC |  |
| _Roll_RA |  |
| Veto Counter |  |