| Param | Original file | Final file |
|---|---|---|
| Filename | modeM0/AS1A06_002T02_9000002982_19987cztM0_level2.evt | modeM0/AS1A06_002T02_9000002982_19987cztM0_level2_quad_clean.evt |
| Size (bytes) | 136,961,280 | 12,038,400 |
| Size | 130.6 MB | 11.5 MB |
| Events in quadrant A | 1,363,114 | 63,330 |
| Events in quadrant B | 885,256 | 67,884 |
| Events in quadrant C | 930,849 | 63,424 |
| Events in quadrant D | 870,037 | 63,908 |
| Mode M9 | |||
|---|---|---|---|
| Quadrant | BADHDUFLAG | Total packets | Discarded packets |
| A | 0 | 9 | 0 |
| B | 0 | 9 | 0 |
| C | 0 | 9 | 0 |
| D | 0 | 9 | 0 |
| Mode SS | |||
|---|---|---|---|
| Quadrant | BADHDUFLAG | Total packets | Discarded packets |
| A | 0 | 28 | 0 |
| B | 0 | 28 | 0 |
| C | 0 | 28 | 0 |
| D | 0 | 28 | 0 |
| Mode M0 | |||
|---|---|---|---|
| Quadrant | BADHDUFLAG | Total packets | Discarded packets |
| A | 0 | 5101 | 1 |
| B | 0 | 3643 | 1 |
| C | 0 | 3741 | 1 |
| D | 0 | 3527 | 1 |
| Quadrant | Total seconds | Saturated seconds | Saturation percentage |
|---|---|---|---|
| A | 1415 | 226 | 15.971731% |
| B | 1415 | 33 | 2.332155% |
| C | 1415 | 51 | 3.604240% |
| D | 1415 | 27 | 1.908127% |
Noise dominated data is calculated using 1-second bins in cleaned event files. If a bin has >2000 counts, and if more than 50% of those come from <1% of pixels, then it is considered to be noise-dominated and hence unusable.
| Quadrant | # 1 sec bins | Bins with >0 counts | Bins with >2000 counts | High rate bins dominated by noise | Noise dominated (total time) | Noise dominated (detector-on time) | Marked lightcurve |
|---|---|---|---|---|---|---|---|
| A | 1415 | 1415 | 149 | 149 | 10.53% | 10.53% | 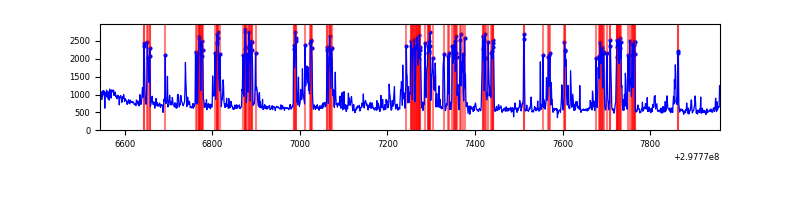 |
| B | 1415 | 1415 | 0 | 0 | 0.00% | 0.00% | 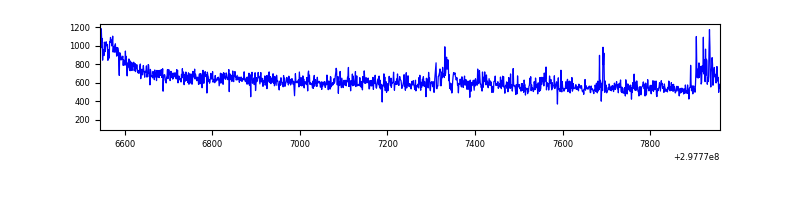 |
| C | 1415 | 1415 | 6 | 6 | 0.42% | 0.42% | 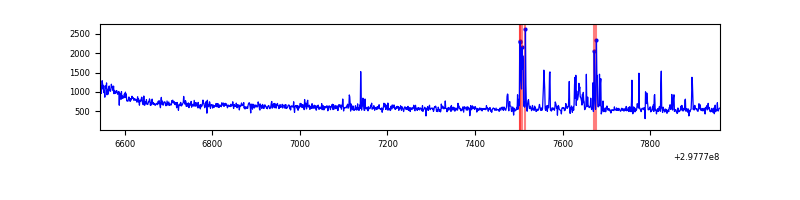 |
| D | 1415 | 1415 | 0 | 0 | 0.00% | 0.00% | 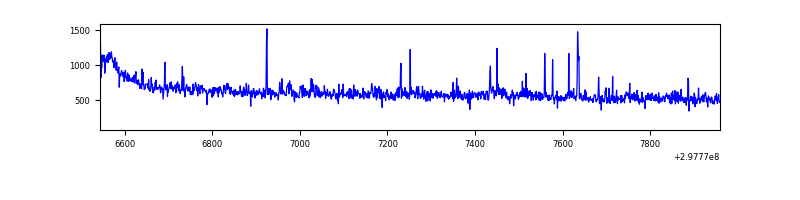 |
Top three noisy pixels from each quadrant. If the there are fewer than three noisy pixels in the level2.evt file, extra rows are filled as -1
| Pixel properties | Quadrant properties | ||||||
|---|---|---|---|---|---|---|---|
| Quadrant | DetID | PixID | Counts | Sigma | Mean | Median | Sigma |
| A | 14 | 238 | 504211 | 11620.51 | 211 | 208 | 43.4 |
| A | 14 | 254 | 33321 | 763.47 | 211 | 208 | 43.4 |
| A | 13 | 252 | 11018 | 249.24 | 211 | 208 | 43.4 |
| B | 7 | 220 | 11722 | 271.45 | 219 | 215 | 42.4 |
| B | 0 | 198 | 7542 | 172.84 | 219 | 215 | 42.4 |
| B | 4 | 216 | 5078 | 114.72 | 219 | 215 | 42.4 |
| C | 0 | 207 | 74431 | 1511.93 | 208 | 210 | 49.1 |
| C | 14 | 238 | 33741 | 683.05 | 208 | 210 | 49.1 |
| C | 3 | 233 | 8431 | 167.47 | 208 | 210 | 49.1 |
| D | 1 | 52 | 29361 | 548.61 | 218 | 211 | 53.1 |
| D | 7 | 96 | 8959 | 164.64 | 218 | 211 | 53.1 |
| D | 13 | 104 | 5094 | 91.9 | 218 | 211 | 53.1 |
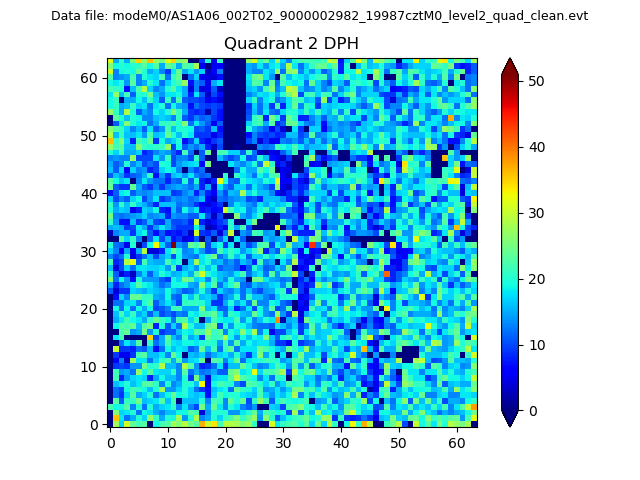
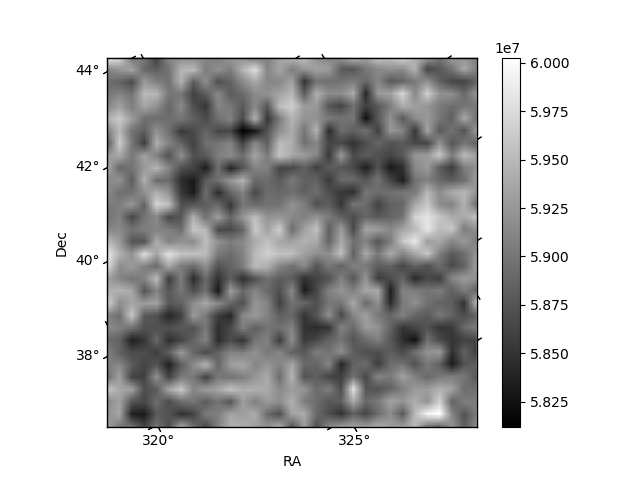
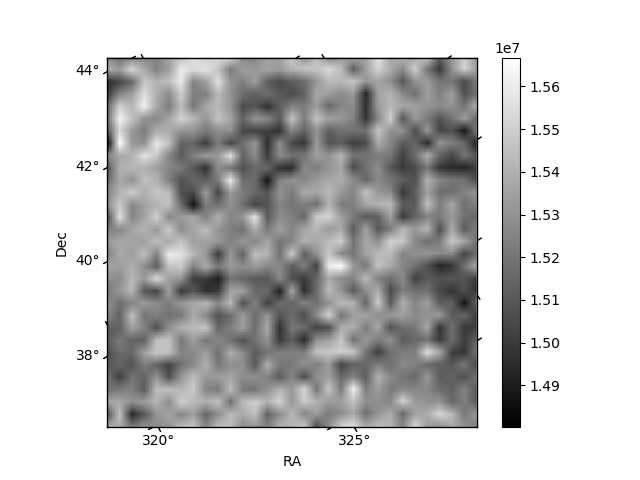
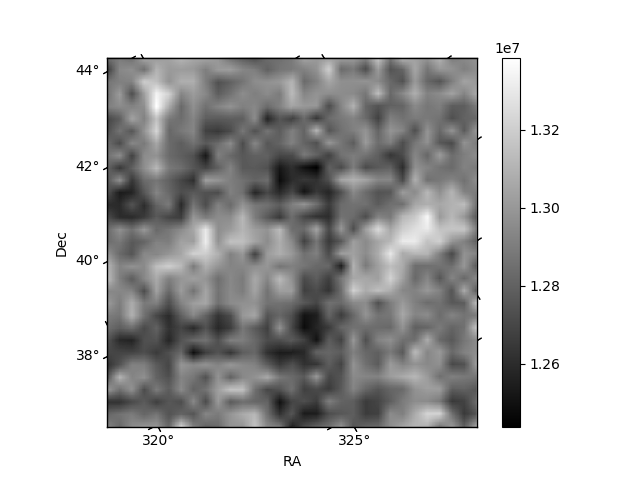
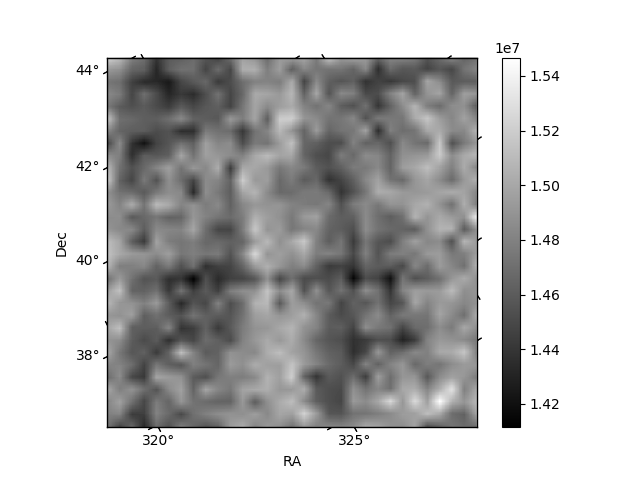
Histogram calculated using DETX and DETY for each event in the final _common_clean file
| Quadrant A | 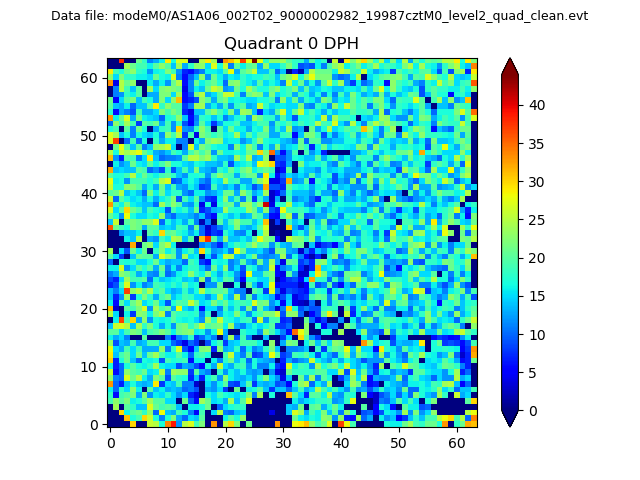 |
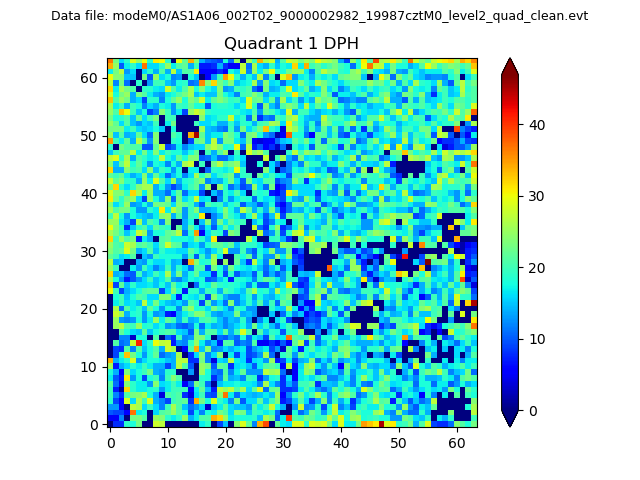 |
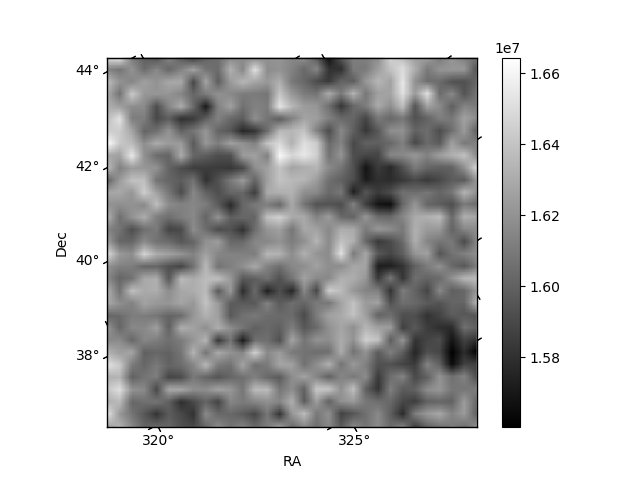
Quadrant B |
|---|---|---|---|
| Quadrant D | 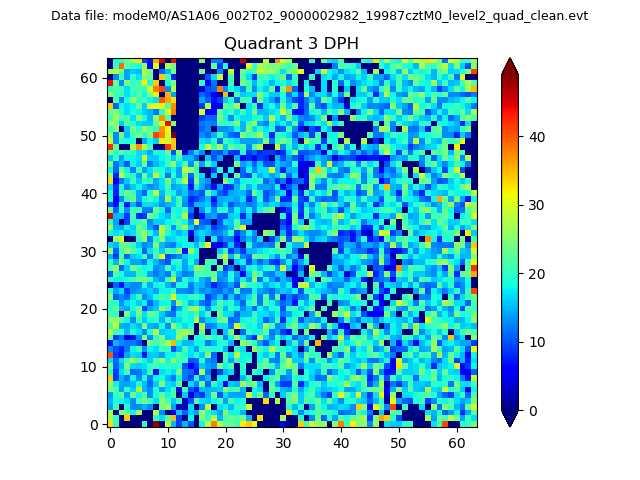 |
 |
Quadrant C |
| Plot type | Count rate plots | Images |
|---|---|---|
| Comparison with Poisson distribution Blue bars denote a histogram of data divided into 1 sec bins. Red curve is a Poisson curve with rate = median count rate of data. |
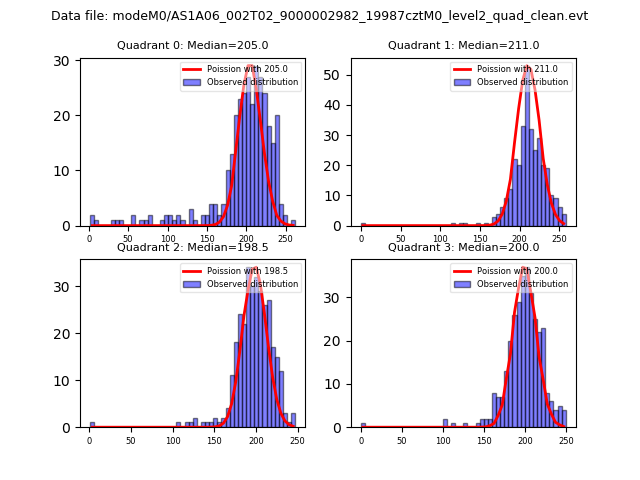 |
 |
| Quadrant-wise count rates Data is divided into 100 sec bins |
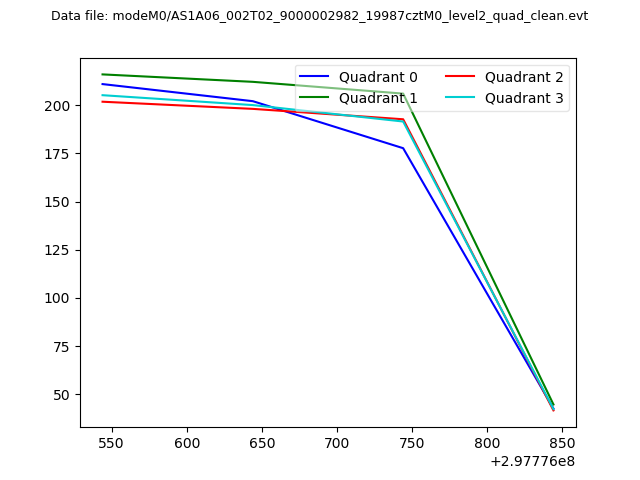 |
|
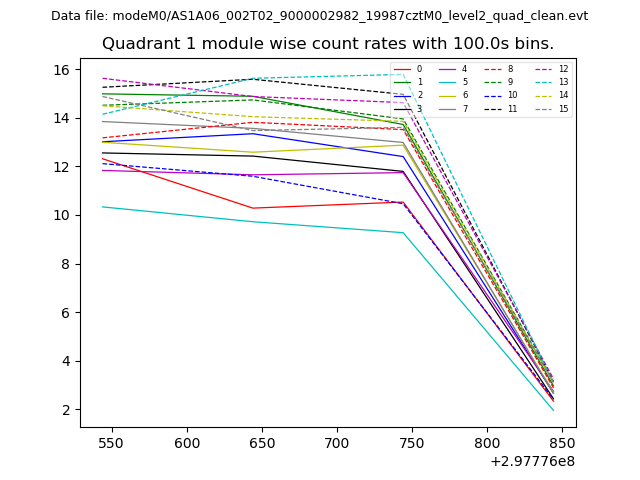
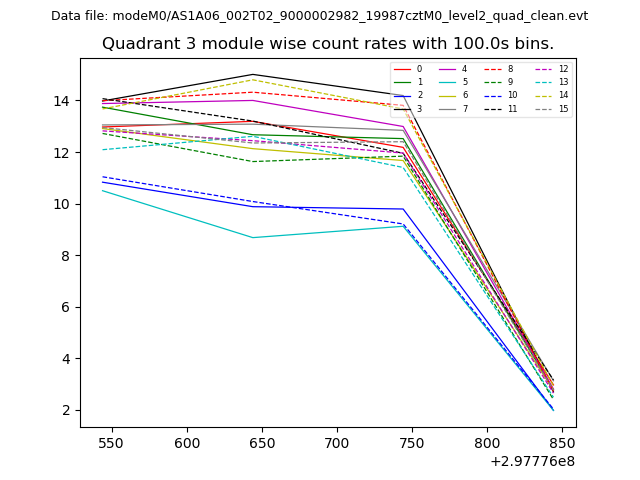
| Module-wise count rates for Quadrant A Data is divided into 100 sec bins |
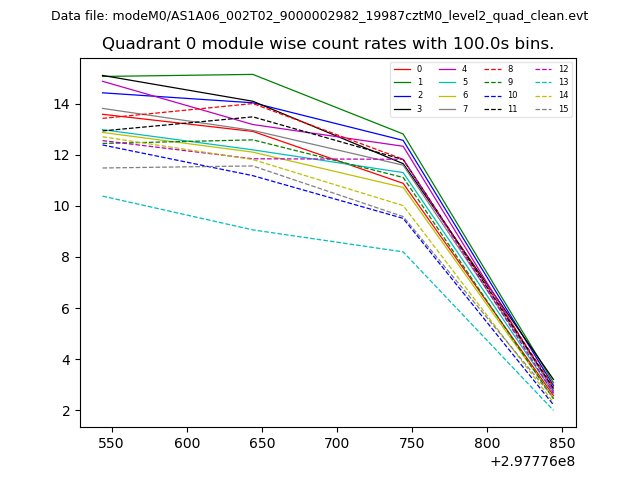 |
 |
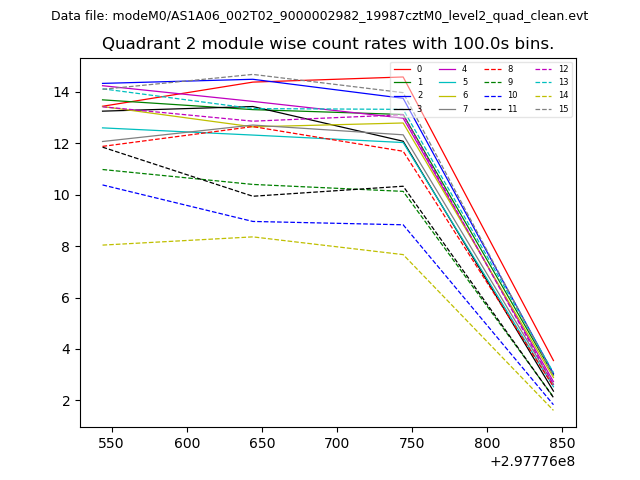
| Module-wise count rates for Quadrant B Data is divided into 100 sec bins |
 |
 |
| Module-wise count rates for Quadrant C Data is divided into 100 sec bins |
 |
 |
| Module-wise count rates for Quadrant D Data is divided into 100 sec bins |
 |
 |
| Parameter | Plot |
|---|---|
| CZT HV Monitor | 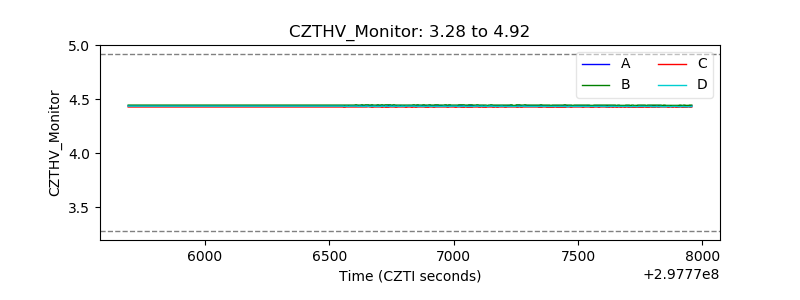 |
| D_VDD | 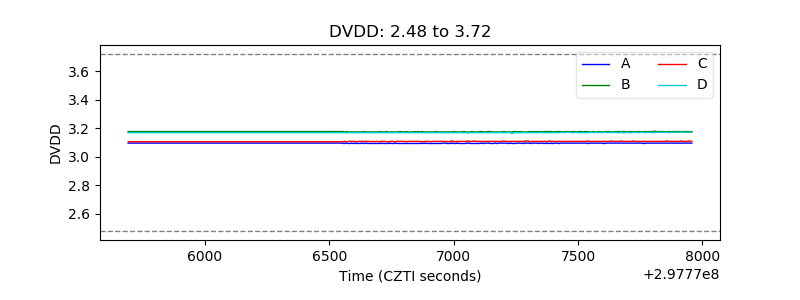 |
| Temperature 1 | 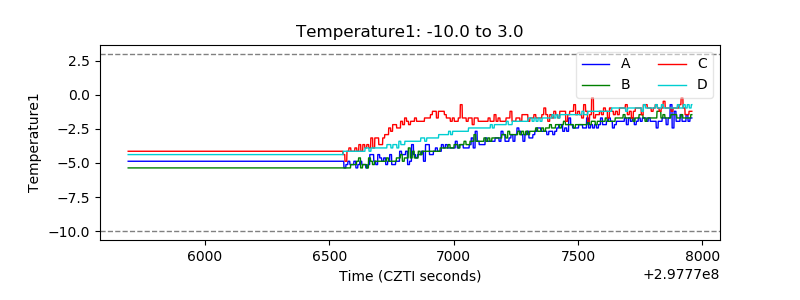 |
| Veto HV Monitor |  |
| Veto LLD | 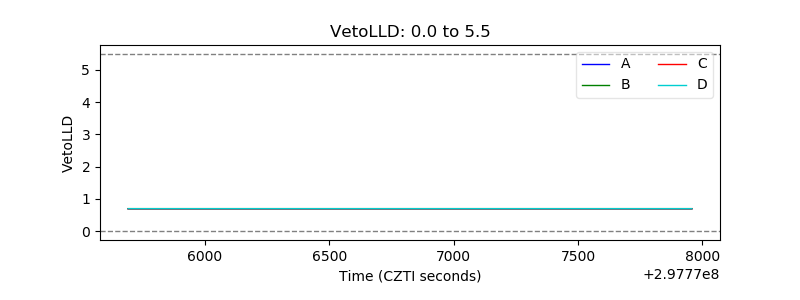 |
| Alpha Counter | 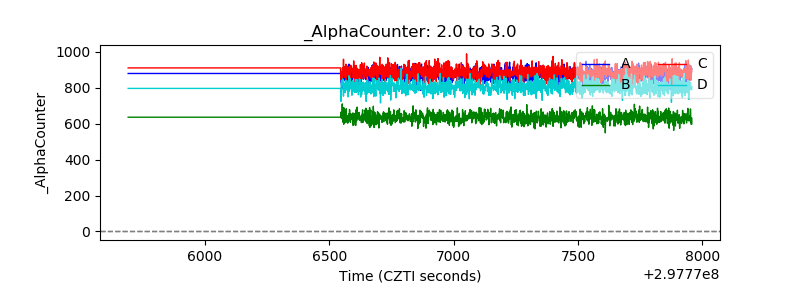 |
| _CPM_Rate | 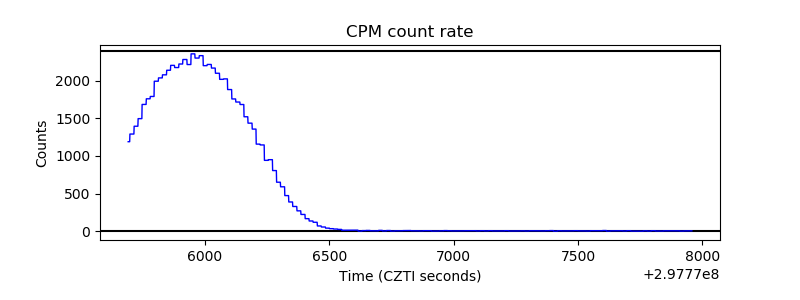 |
| CZT Counter | 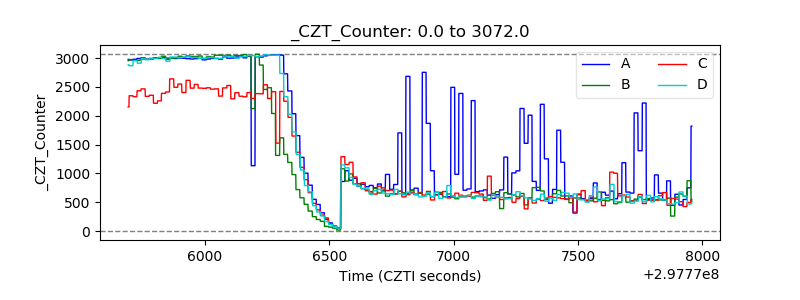 |
| +2.5 Volts monitor |  |
| +5 Volts monitor |  |
| _ROLL_ROT | 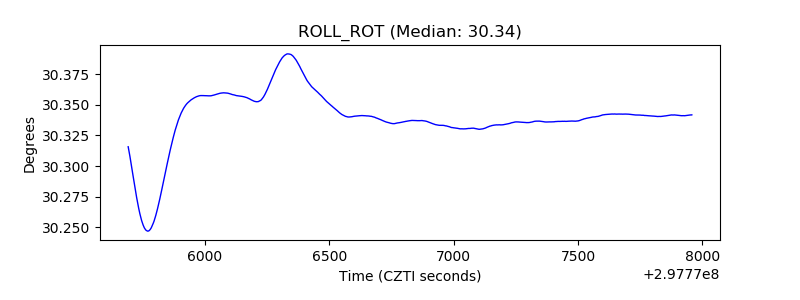 |
| _Roll_DEC | 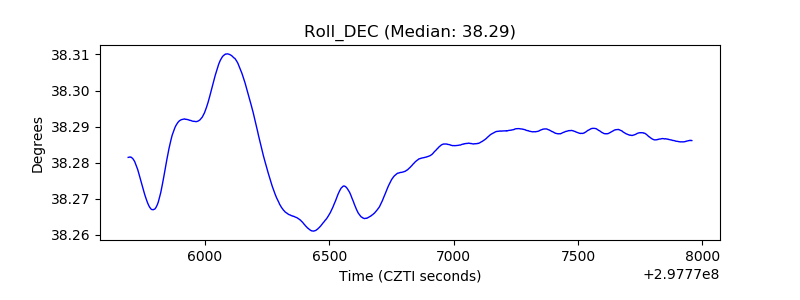 |
| _Roll_RA | 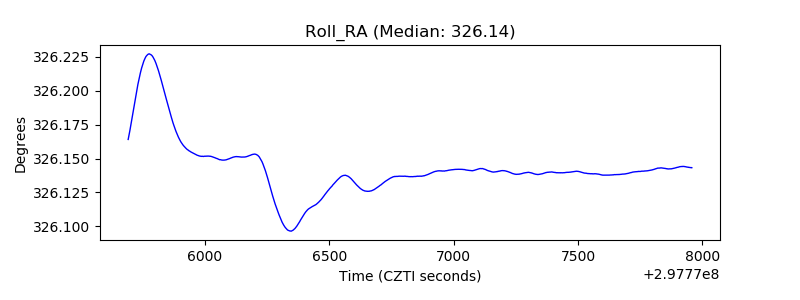 |
| Veto Counter | 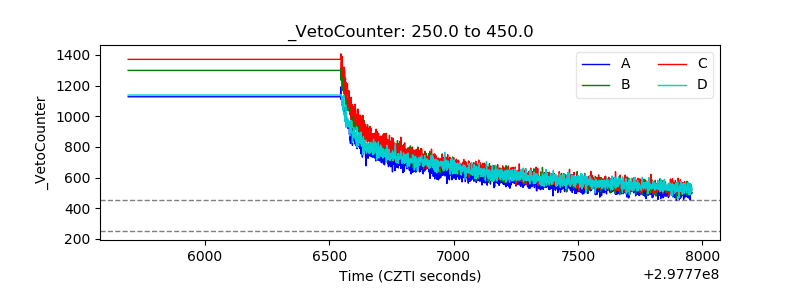 |