| Param | Original file | Final file |
|---|---|---|
| Filename | modeM0/AS1A06_002T02_9000002982_19988cztM0_level2.evt | modeM0/AS1A06_002T02_9000002982_19988cztM0_level2_quad_clean.evt |
| Size (bytes) | 567,025,920 | 71,334,720 |
| Size | 540.8 MB | 68.0 MB |
| Events in quadrant A | 5,415,456 | 417,882 |
| Events in quadrant B | 3,765,471 | 443,387 |
| Events in quadrant C | 3,859,247 | 420,988 |
| Events in quadrant D | 3,690,245 | 422,741 |
| Mode M9 | |||
|---|---|---|---|
| Quadrant | BADHDUFLAG | Total packets | Discarded packets |
| A | 0 | 16 | 0 |
| B | 0 | 16 | 0 |
| C | 0 | 16 | 0 |
| D | 0 | 17 | 0 |
| Mode SS | |||
|---|---|---|---|
| Quadrant | BADHDUFLAG | Total packets | Discarded packets |
| A | 0 | 132 | 0 |
| B | 0 | 132 | 0 |
| C | 0 | 132 | 0 |
| D | 0 | 132 | 0 |
| Mode M0 | |||
|---|---|---|---|
| Quadrant | BADHDUFLAG | Total packets | Discarded packets |
| A | 0 | 20412 | 3 |
| B | 0 | 15418 | 2 |
| C | 0 | 15543 | 2 |
| D | 0 | 15131 | 2 |
| Quadrant | Total seconds | Saturated seconds | Saturation percentage |
|---|---|---|---|
| A | 6521 | 777 | 11.915350% |
| B | 6521 | 136 | 2.085570% |
| C | 6521 | 195 | 2.990339% |
| D | 6521 | 104 | 1.594847% |
Noise dominated data is calculated using 1-second bins in cleaned event files. If a bin has >2000 counts, and if more than 50% of those come from <1% of pixels, then it is considered to be noise-dominated and hence unusable.
| Quadrant | # 1 sec bins | Bins with >0 counts | Bins with >2000 counts | High rate bins dominated by noise | Noise dominated (total time) | Noise dominated (detector-on time) | Marked lightcurve |
|---|---|---|---|---|---|---|---|
| A | 7796 | 6521 | 538 | 538 | 6.90% | 8.25% | 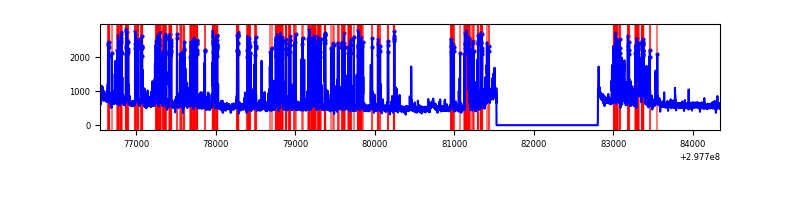 |
| B | 7796 | 6521 | 2 | 2 | 0.03% | 0.03% | 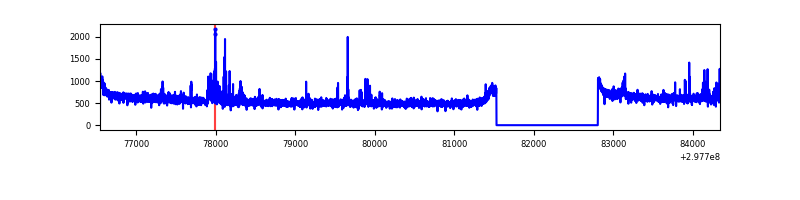 |
| C | 7796 | 6521 | 15 | 15 | 0.19% | 0.23% | 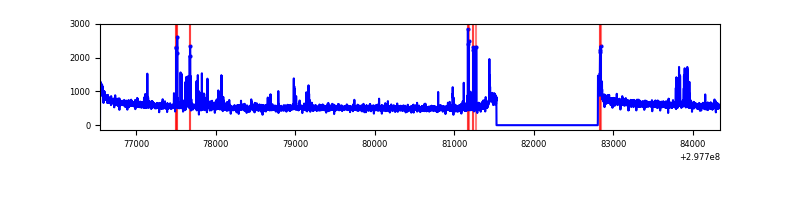 |
| D | 7796 | 6521 | 5 | 5 | 0.06% | 0.08% | 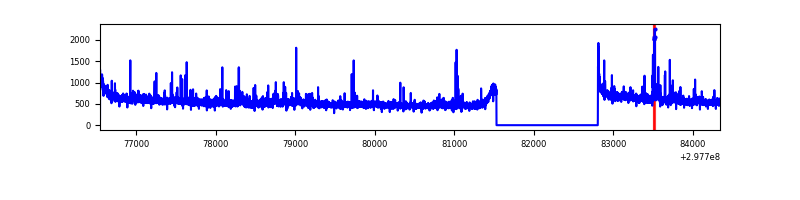 |
Top three noisy pixels from each quadrant. If the there are fewer than three noisy pixels in the level2.evt file, extra rows are filled as -1
| Pixel properties | Quadrant properties | ||||||
|---|---|---|---|---|---|---|---|
| Quadrant | DetID | PixID | Counts | Sigma | Mean | Median | Sigma |
| A | 14 | 238 | 1795958 | 10235.58 | 888 | 874 | 175.4 |
| A | 14 | 254 | 160251 | 908.77 | 888 | 874 | 175.4 |
| A | 13 | 252 | 35337 | 196.51 | 888 | 874 | 175.4 |
| B | 7 | 220 | 59036 | 342.71 | 920 | 900 | 169.6 |
| B | 4 | 216 | 24720 | 140.42 | 920 | 900 | 169.6 |
| B | 0 | 197 | 21909 | 123.85 | 920 | 900 | 169.6 |
| C | 0 | 207 | 156332 | 770.09 | 882 | 891 | 201.8 |
| C | 14 | 238 | 140098 | 689.66 | 882 | 891 | 201.8 |
| C | 3 | 233 | 118262 | 581.48 | 882 | 891 | 201.8 |
| D | 1 | 52 | 119462 | 542.13 | 912 | 887 | 218.7 |
| D | 12 | 218 | 76443 | 345.45 | 912 | 887 | 218.7 |
| D | 2 | 234 | 23751 | 104.54 | 912 | 887 | 218.7 |
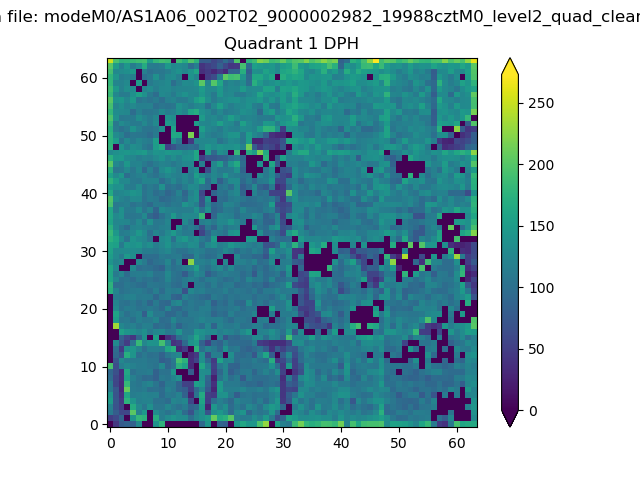
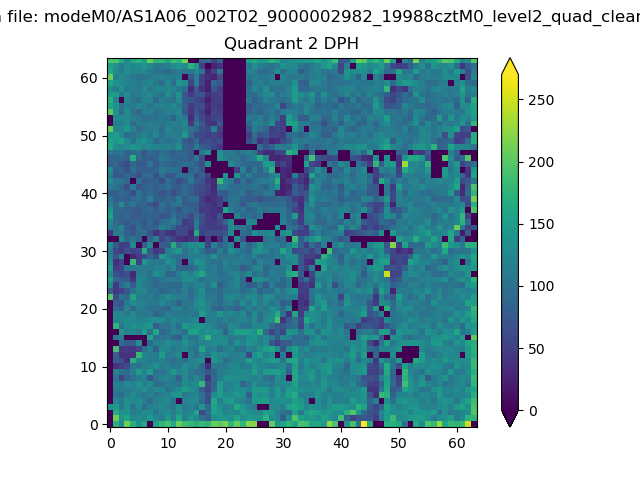
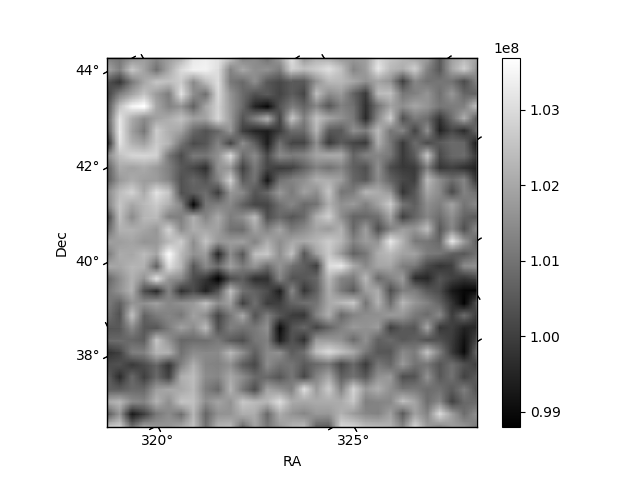
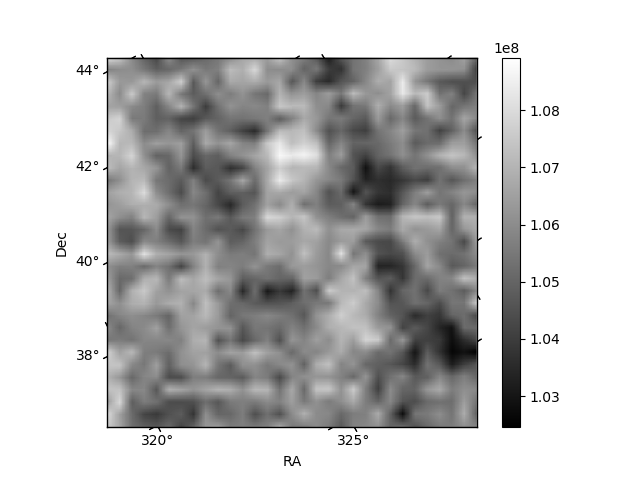
Histogram calculated using DETX and DETY for each event in the final _common_clean file
| Quadrant A | 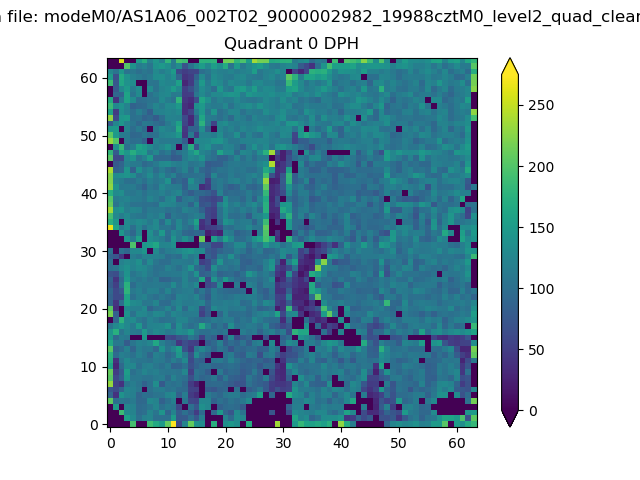 |
 |
Quadrant B |
|---|---|---|---|
| Quadrant D | 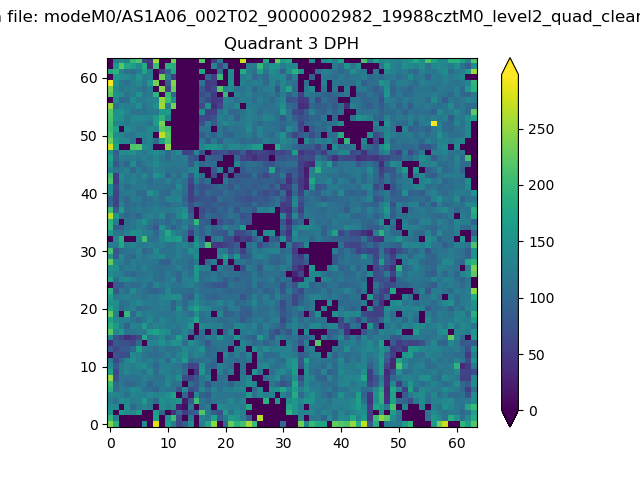 |
 |
Quadrant C |
| Plot type | Count rate plots | Images |
|---|---|---|
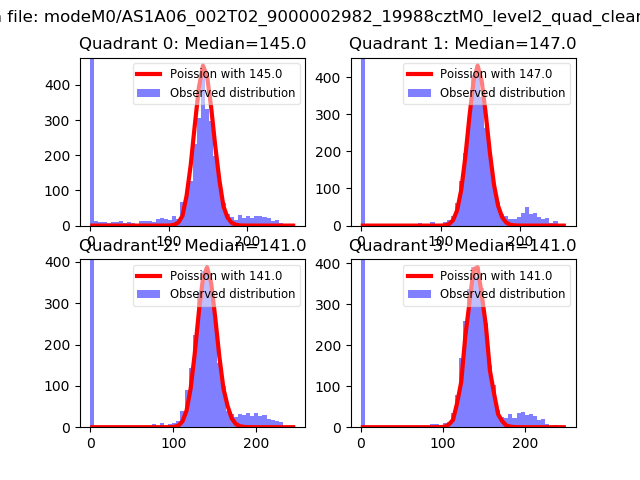
| Comparison with Poisson distribution Blue bars denote a histogram of data divided into 1 sec bins. Red curve is a Poisson curve with rate = median count rate of data. |
 |
 |
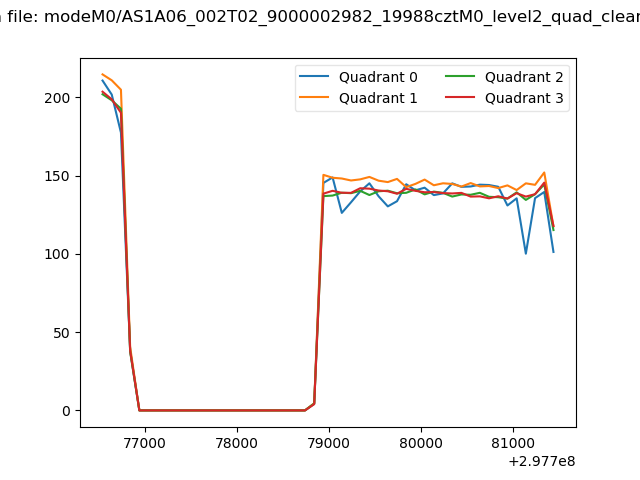
| Quadrant-wise count rates Data is divided into 100 sec bins |
 |
|
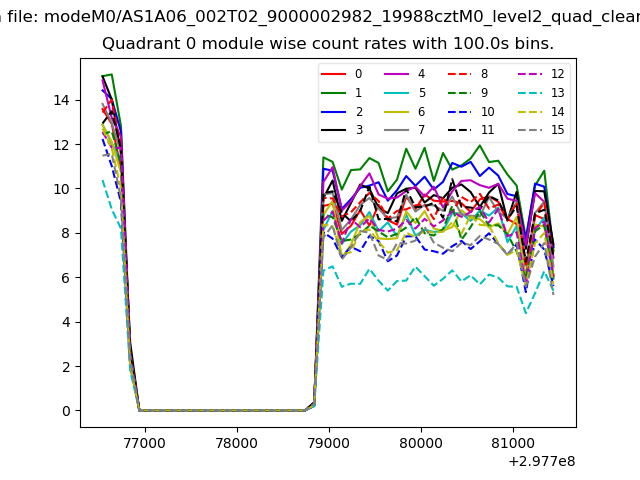
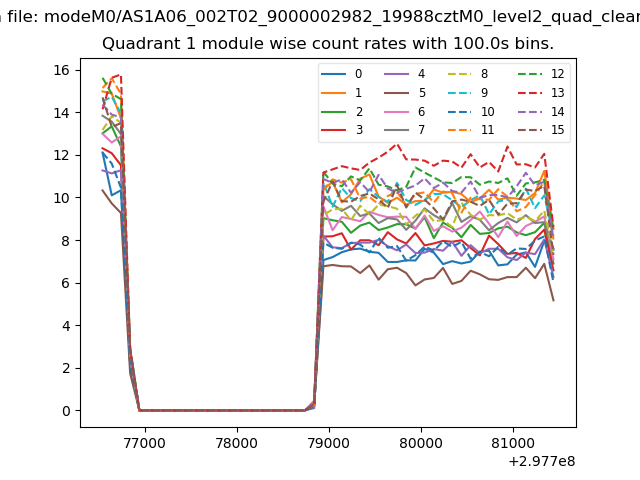
| Module-wise count rates for Quadrant A Data is divided into 100 sec bins |
 |
 |
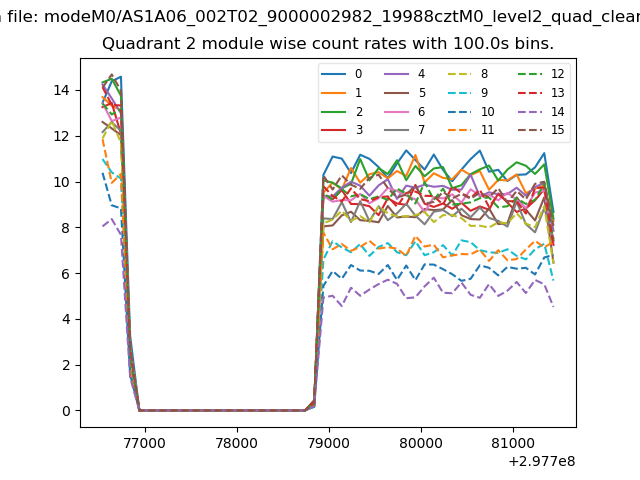
| Module-wise count rates for Quadrant B Data is divided into 100 sec bins |
 |
 |
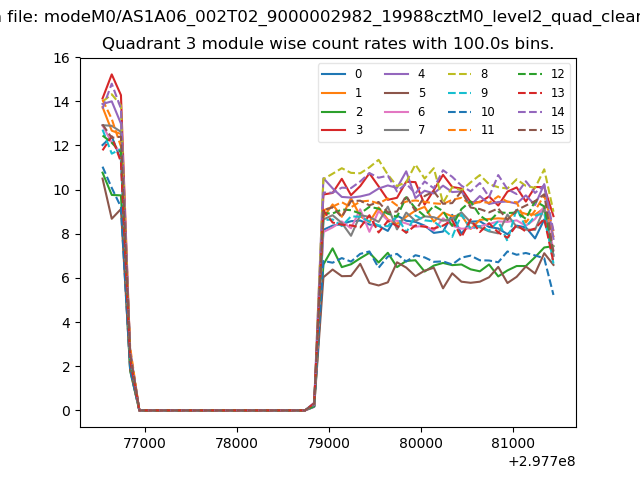
| Module-wise count rates for Quadrant C Data is divided into 100 sec bins |
 |
 |
| Module-wise count rates for Quadrant D Data is divided into 100 sec bins |
 |
 |
| Parameter | Plot |
|---|---|
| CZT HV Monitor | 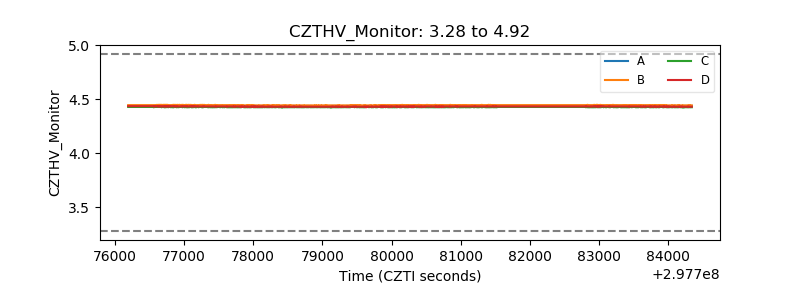 |
| D_VDD | 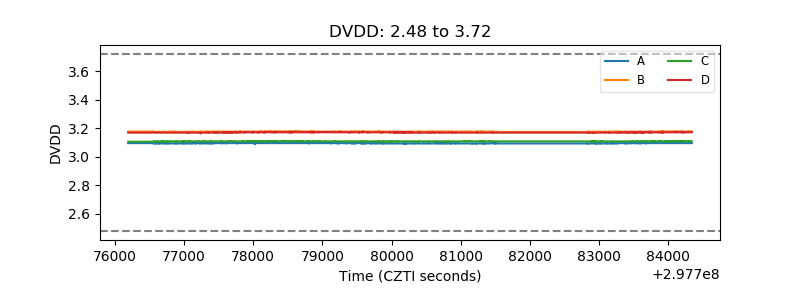 |
| Temperature 1 | 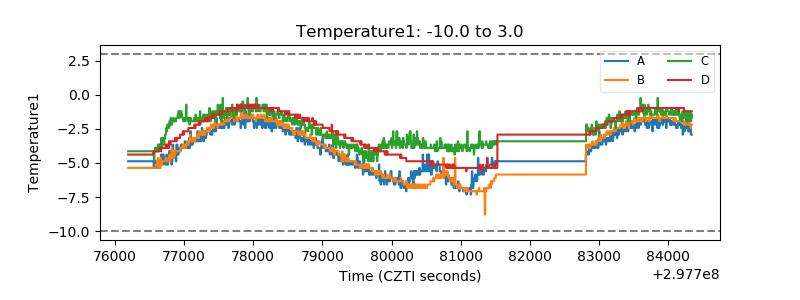 |
| Veto HV Monitor | 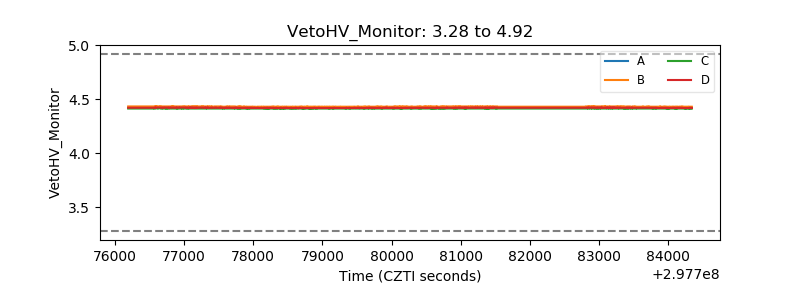 |
| Veto LLD | 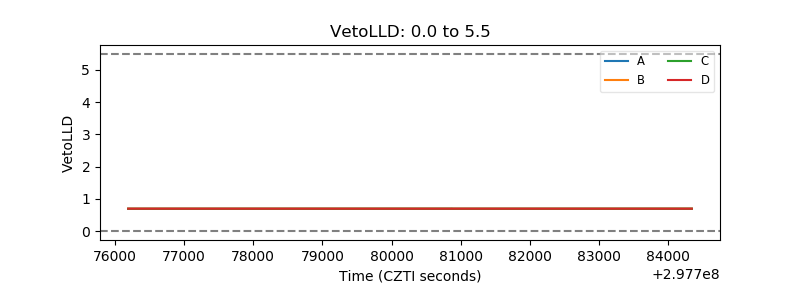 |
| Alpha Counter | 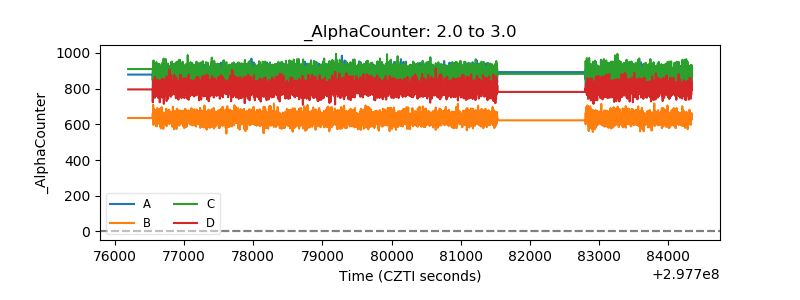 |
| _CPM_Rate | 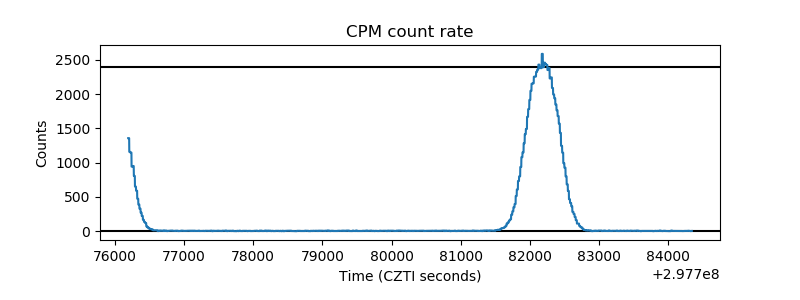 |
| CZT Counter | 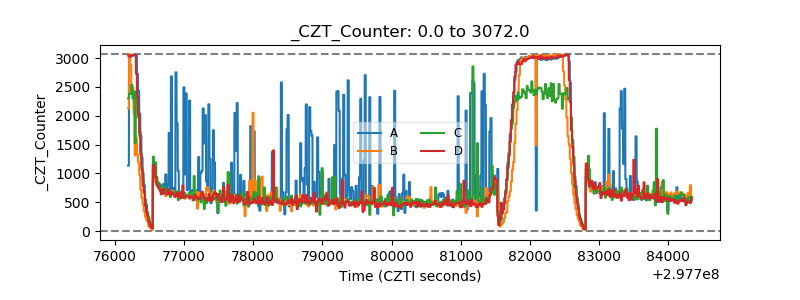 |
| +2.5 Volts monitor |  |
| +5 Volts monitor |  |
| _ROLL_ROT | 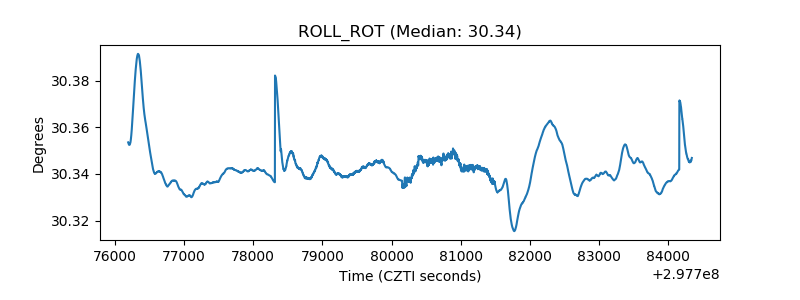 |
| _Roll_DEC | 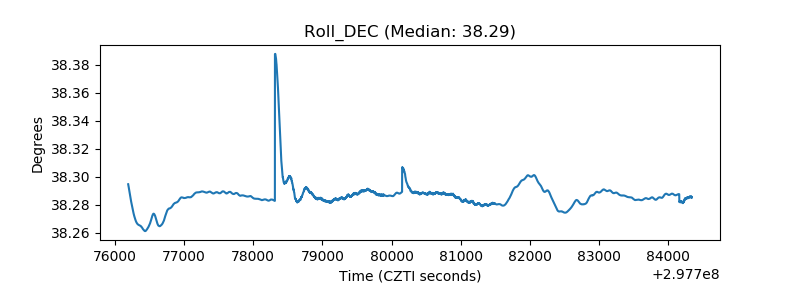 |
| _Roll_RA | 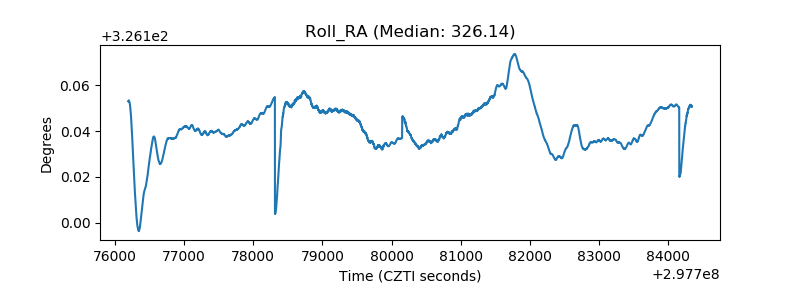 |
| Veto Counter | 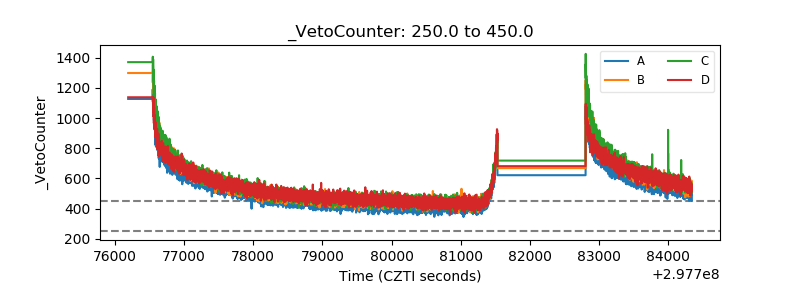 |