| Param | Original file | Final file |
|---|---|---|
| Filename | modeM0/AS1A06_002T02_9000002982_19989cztM0_level2.evt | modeM0/AS1A06_002T02_9000002982_19989cztM0_level2_quad_clean.evt |
| Size (bytes) | 541,514,880 | 71,570,880 |
| Size | 516.4 MB | 68.3 MB |
| Events in quadrant A | 4,025,592 | 439,103 |
| Events in quadrant B | 3,945,635 | 440,563 |
| Events in quadrant C | 4,042,764 | 419,853 |
| Events in quadrant D | 3,953,644 | 422,498 |
| Mode M9 | |||
|---|---|---|---|
| Quadrant | BADHDUFLAG | Total packets | Discarded packets |
| A | 0 | 14 | 0 |
| B | 0 | 15 | 0 |
| C | 0 | 15 | 0 |
| D | 0 | 15 | 0 |
| Mode SS | |||
|---|---|---|---|
| Quadrant | BADHDUFLAG | Total packets | Discarded packets |
| A | 0 | 130 | 0 |
| B | 0 | 130 | 0 |
| C | 0 | 130 | 0 |
| D | 0 | 130 | 0 |
| Mode M0 | |||
|---|---|---|---|
| Quadrant | BADHDUFLAG | Total packets | Discarded packets |
| A | 0 | 16058 | 2 |
| B | 0 | 16066 | 2 |
| C | 0 | 16324 | 2 |
| D | 0 | 16124 | 2 |
| Quadrant | Total seconds | Saturated seconds | Saturation percentage |
|---|---|---|---|
| A | 6376 | 242 | 3.795483% |
| B | 6376 | 167 | 2.619197% |
| C | 6376 | 224 | 3.513174% |
| D | 6376 | 161 | 2.525094% |
Noise dominated data is calculated using 1-second bins in cleaned event files. If a bin has >2000 counts, and if more than 50% of those come from <1% of pixels, then it is considered to be noise-dominated and hence unusable.
| Quadrant | # 1 sec bins | Bins with >0 counts | Bins with >2000 counts | High rate bins dominated by noise | Noise dominated (total time) | Noise dominated (detector-on time) | Marked lightcurve |
|---|---|---|---|---|---|---|---|
| A | 7701 | 6376 | 93 | 93 | 1.21% | 1.46% | 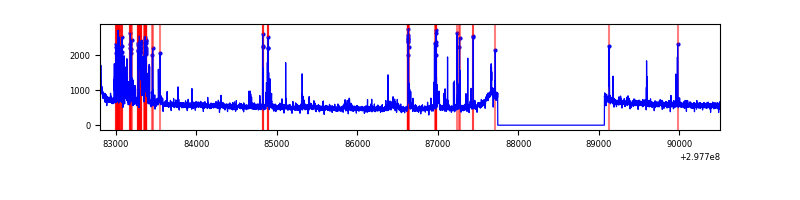 |
| B | 7701 | 6376 | 18 | 18 | 0.23% | 0.28% | 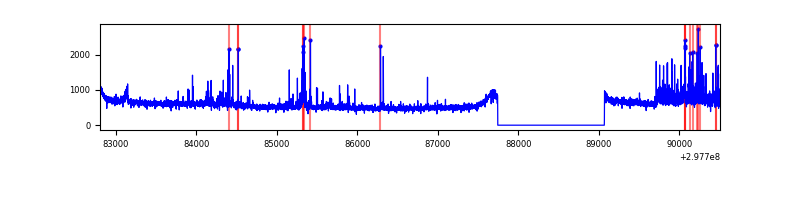 |
| C | 7701 | 6376 | 6 | 6 | 0.08% | 0.09% | 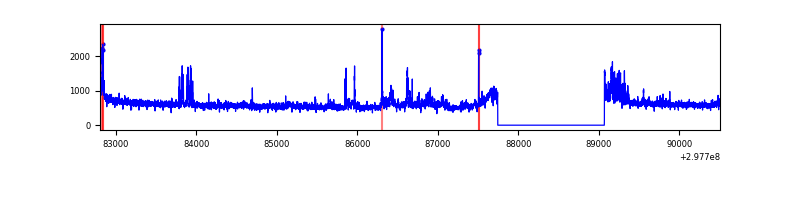 |
| D | 7701 | 6376 | 55 | 55 | 0.71% | 0.86% | 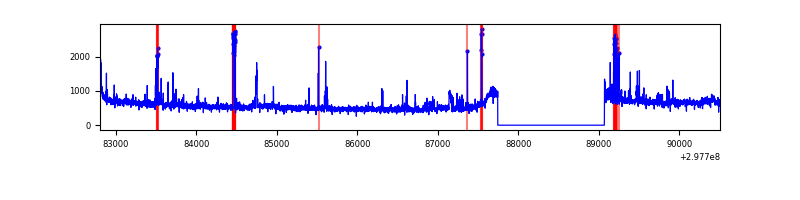 |
Top three noisy pixels from each quadrant. If the there are fewer than three noisy pixels in the level2.evt file, extra rows are filled as -1
| Pixel properties | Quadrant properties | ||||||
|---|---|---|---|---|---|---|---|
| Quadrant | DetID | PixID | Counts | Sigma | Mean | Median | Sigma |
| A | 14 | 238 | 387269 | 2151.12 | 914 | 900 | 179.6 |
| A | 14 | 254 | 88759 | 489.16 | 914 | 900 | 179.6 |
| A | 13 | 252 | 37217 | 202.2 | 914 | 900 | 179.6 |
| B | 7 | 220 | 144152 | 856.53 | 908 | 890 | 167.3 |
| B | 0 | 197 | 109510 | 649.42 | 908 | 890 | 167.3 |
| B | 0 | 245 | 32220 | 187.32 | 908 | 890 | 167.3 |
| C | 3 | 233 | 354347 | 1778.14 | 875 | 885 | 198.8 |
| C | 14 | 238 | 139219 | 695.91 | 875 | 885 | 198.8 |
| C | 0 | 207 | 113604 | 567.05 | 875 | 885 | 198.8 |
| D | 1 | 52 | 272633 | 1265.07 | 900 | 880 | 214.8 |
| D | 12 | 218 | 217917 | 1010.35 | 900 | 880 | 214.8 |
| D | 2 | 234 | 26004 | 116.96 | 900 | 880 | 214.8 |
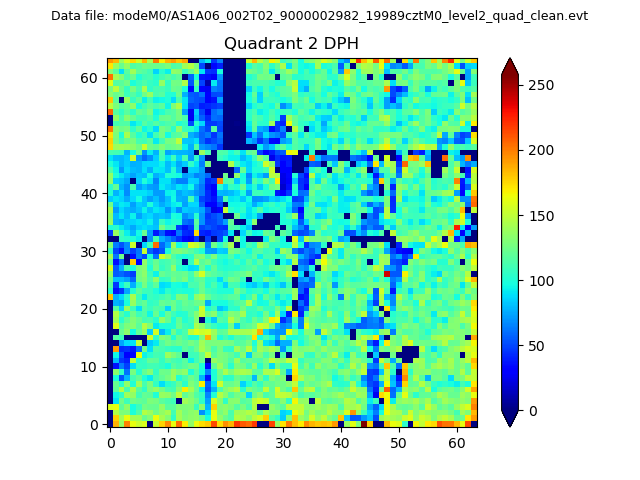
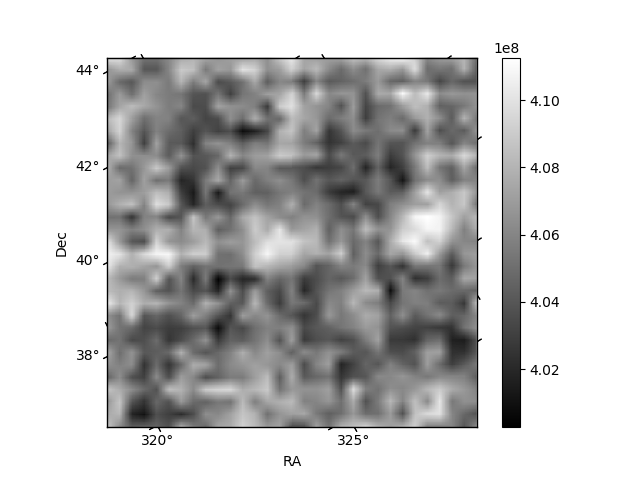
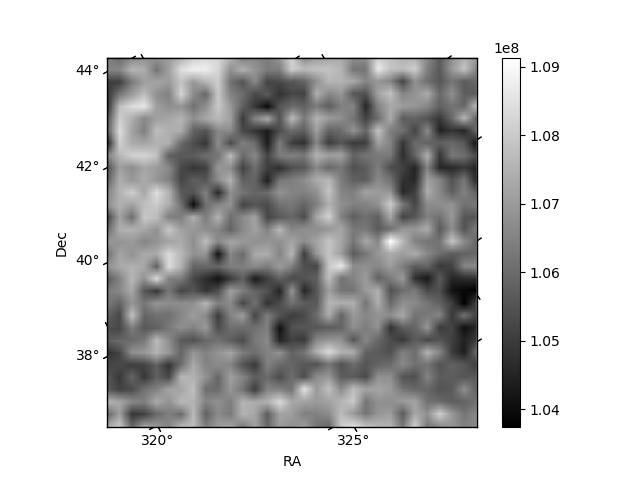
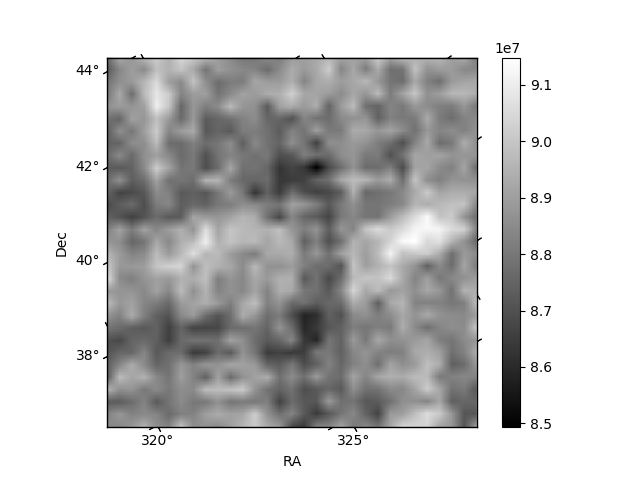
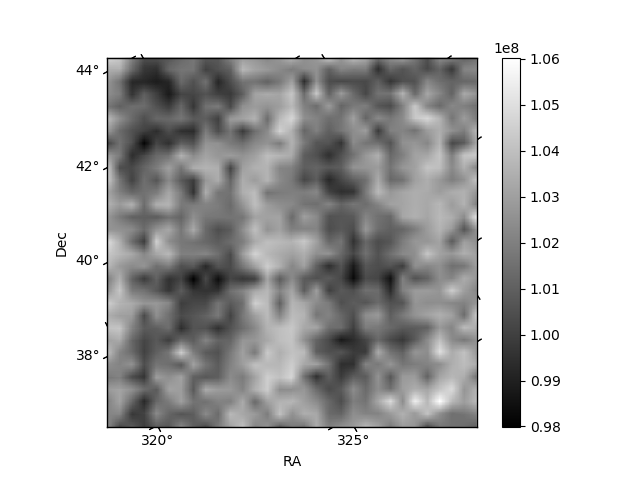
Histogram calculated using DETX and DETY for each event in the final _common_clean file
| Quadrant A | 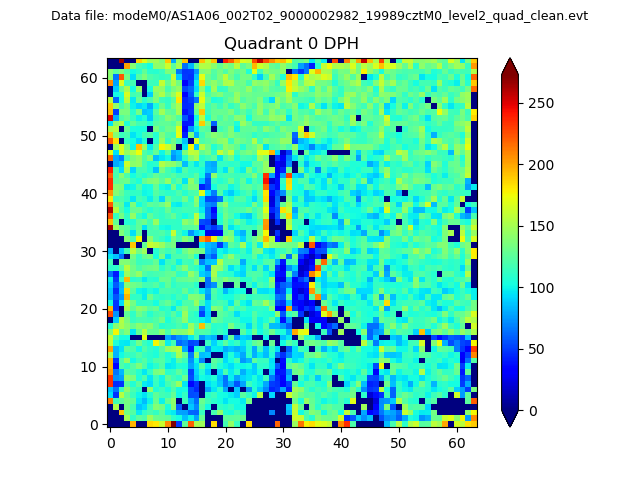 |
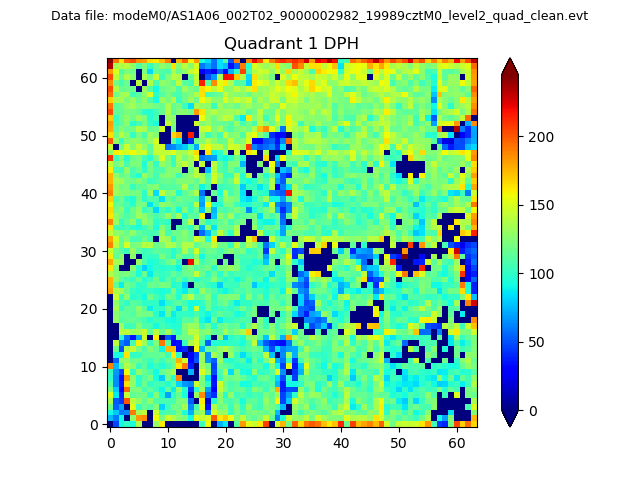 |
Quadrant B |
|---|---|---|---|
| Quadrant D | 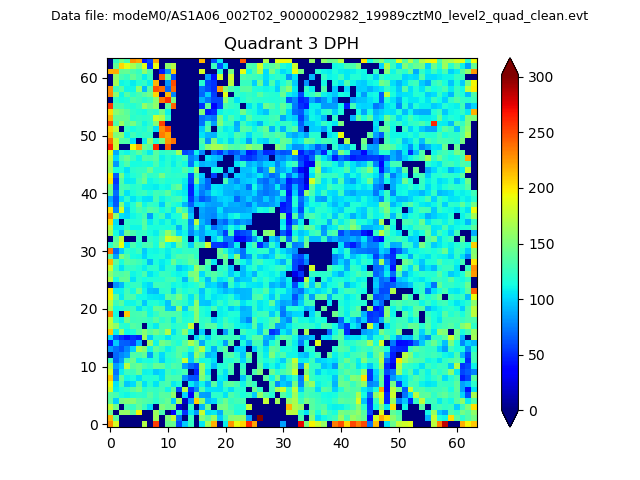 |
 |
Quadrant C |
| Plot type | Count rate plots | Images |
|---|---|---|
| Comparison with Poisson distribution Blue bars denote a histogram of data divided into 1 sec bins. Red curve is a Poisson curve with rate = median count rate of data. |
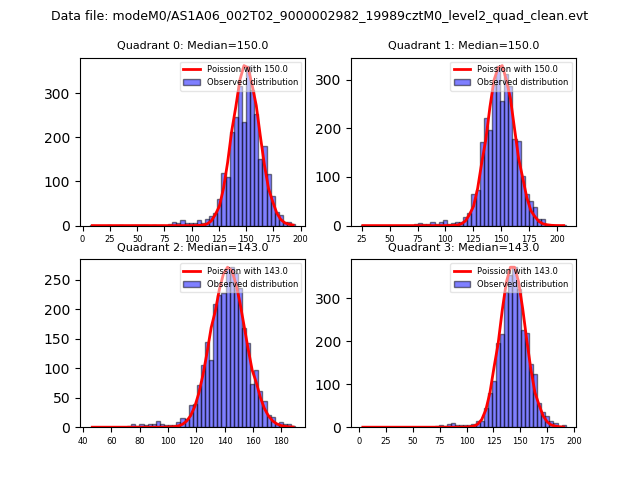 |
 |
| Quadrant-wise count rates Data is divided into 100 sec bins |
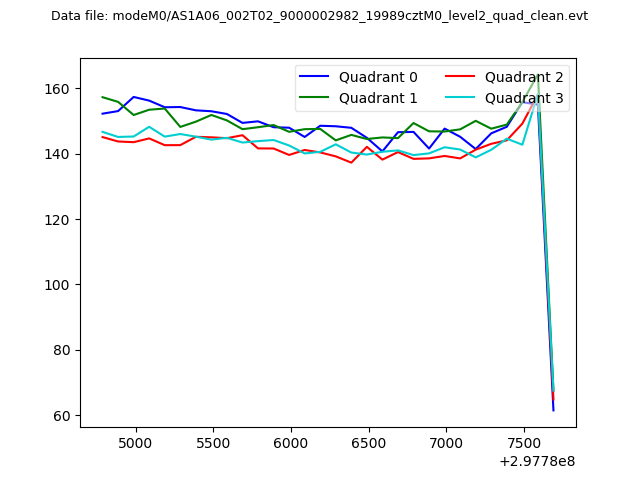 |
|
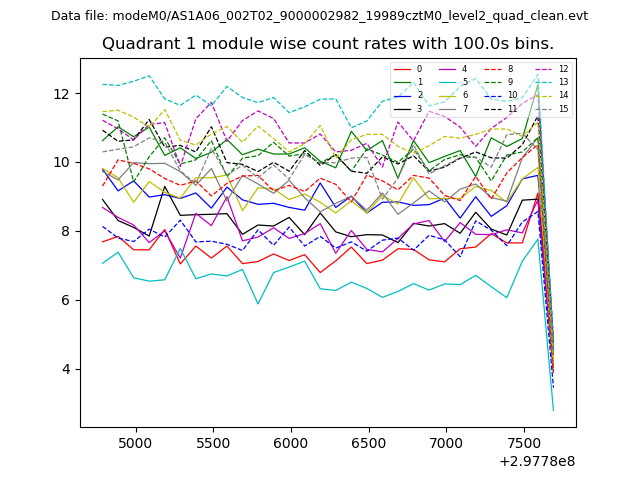
| Module-wise count rates for Quadrant A Data is divided into 100 sec bins |
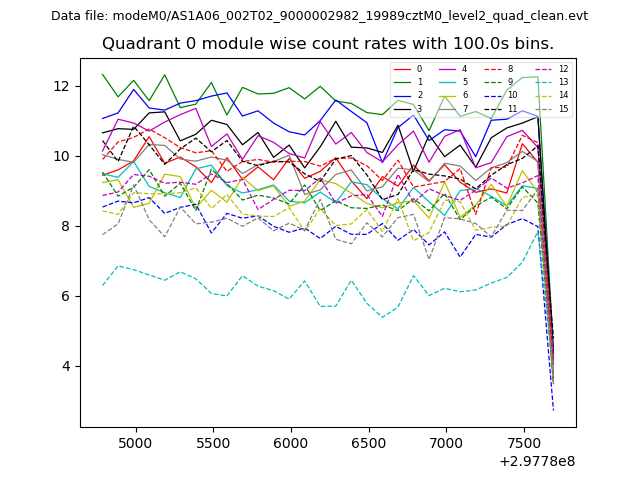 |
 |
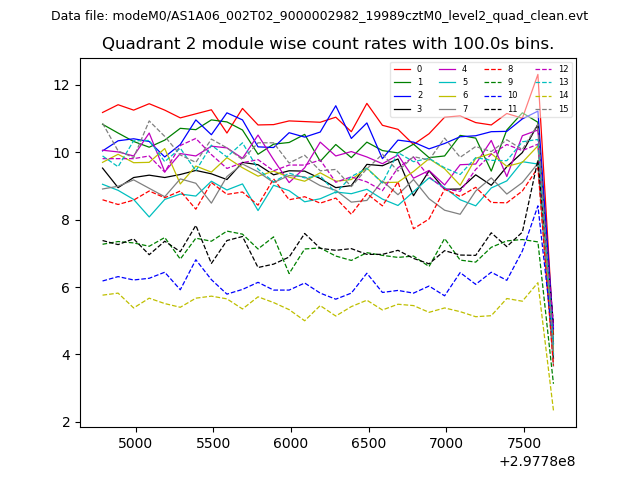
| Module-wise count rates for Quadrant B Data is divided into 100 sec bins |
 |
 |
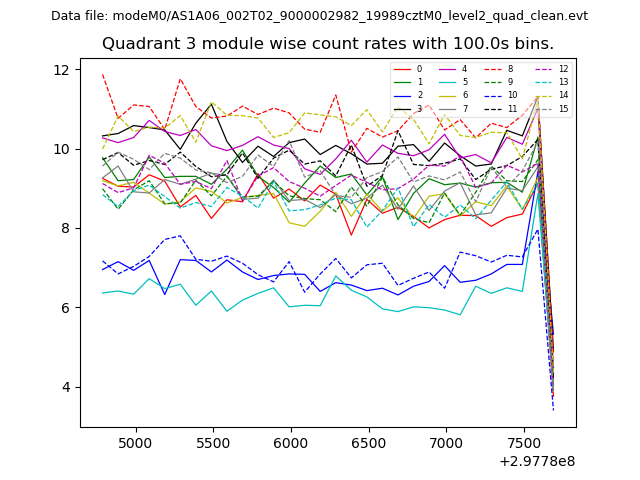
| Module-wise count rates for Quadrant C Data is divided into 100 sec bins |
 |
 |
| Module-wise count rates for Quadrant D Data is divided into 100 sec bins |
 |
 |
| Parameter | Plot |
|---|---|
| CZT HV Monitor | 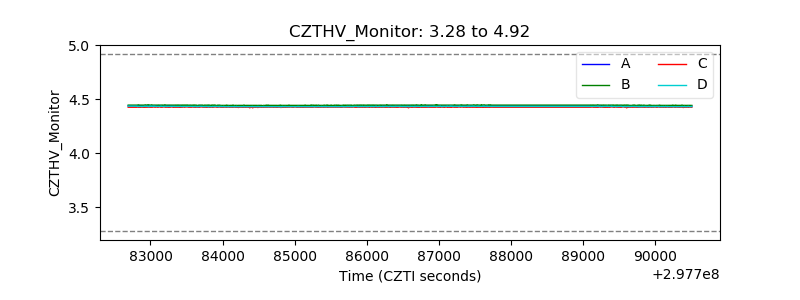 |
| D_VDD | 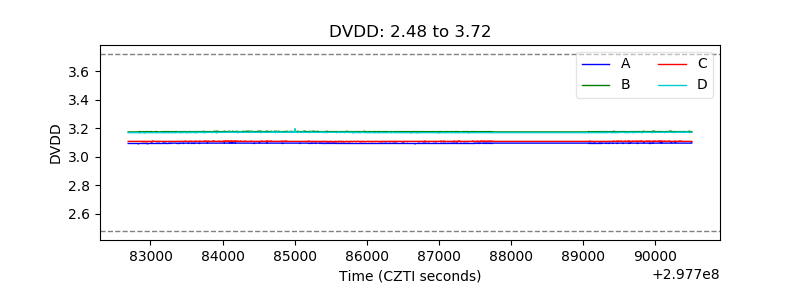 |
| Temperature 1 | 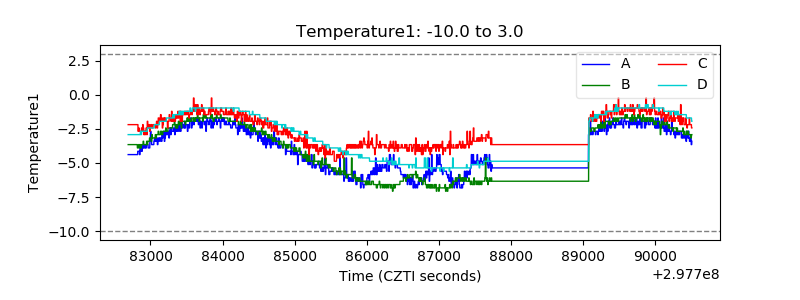 |
| Veto HV Monitor | 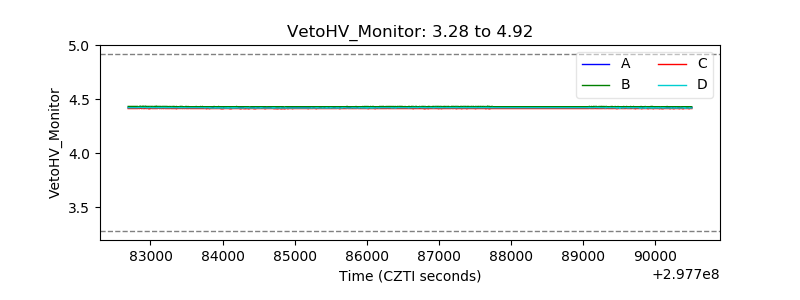 |
| Veto LLD | 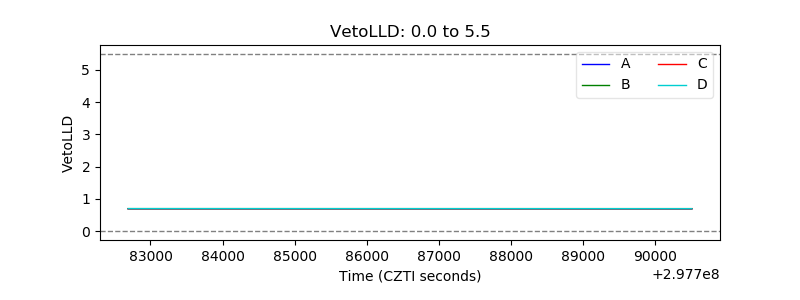 |
| Alpha Counter | 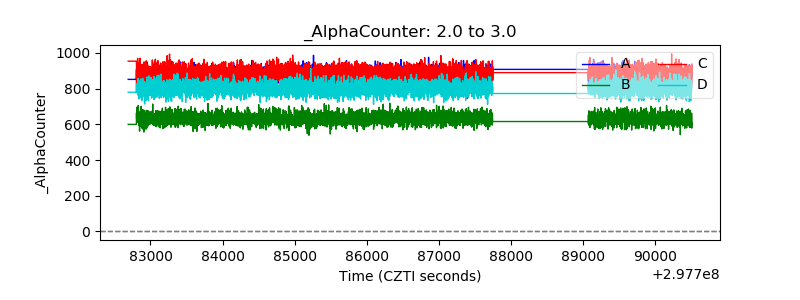 |
| _CPM_Rate | 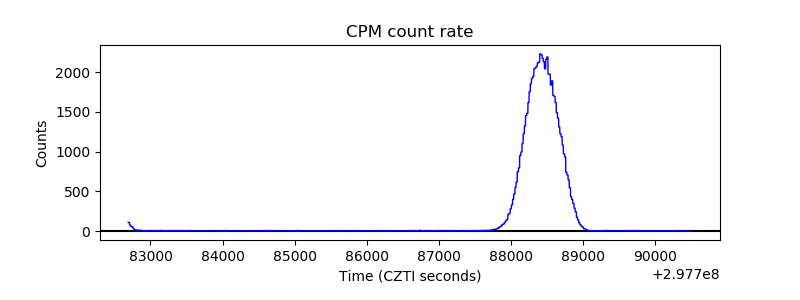 |
| CZT Counter | 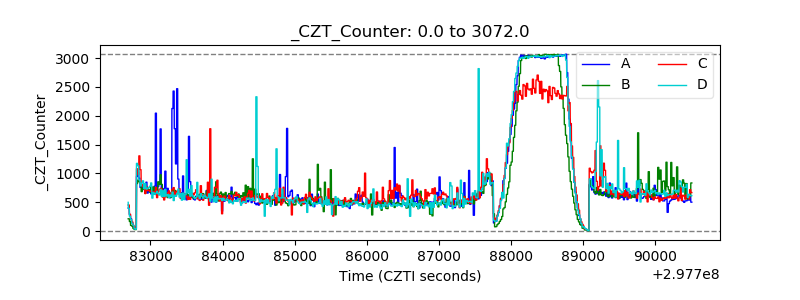 |
| +2.5 Volts monitor |  |
| +5 Volts monitor |  |
| _ROLL_ROT | 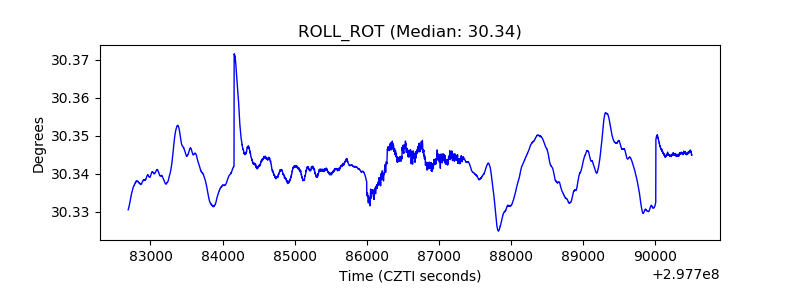 |
| _Roll_DEC |  |
| _Roll_RA | 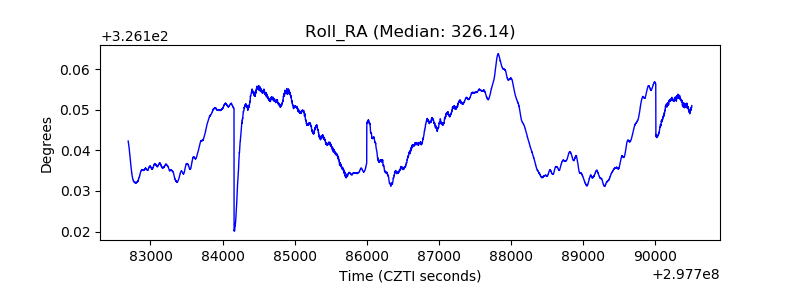 |
| Veto Counter | 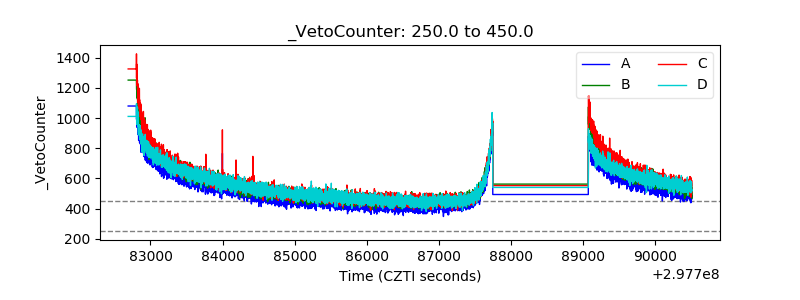 |