| Param | Original file | Final file |
|---|---|---|
| Filename | modeM0/AS1A06_002T02_9000002982_19990cztM0_level2.evt | modeM0/AS1A06_002T02_9000002982_19990cztM0_level2_quad_clean.evt |
| Size (bytes) | 531,599,040 | 83,301,120 |
| Size | 507.0 MB | 79.4 MB |
| Events in quadrant A | 3,709,601 | 529,679 |
| Events in quadrant B | 4,081,031 | 533,185 |
| Events in quadrant C | 3,773,198 | 509,909 |
| Events in quadrant D | 4,106,426 | 507,607 |
| Mode M9 | |||
|---|---|---|---|
| Quadrant | BADHDUFLAG | Total packets | Discarded packets |
| A | 0 | 21 | 0 |
| B | 0 | 22 | 0 |
| C | 0 | 22 | 0 |
| D | 0 | 22 | 0 |
| Mode SS | |||
|---|---|---|---|
| Quadrant | BADHDUFLAG | Total packets | Discarded packets |
| A | 0 | 128 | 0 |
| B | 0 | 128 | 0 |
| C | 0 | 128 | 0 |
| D | 0 | 128 | 0 |
| Mode M0 | |||
|---|---|---|---|
| Quadrant | BADHDUFLAG | Total packets | Discarded packets |
| A | 0 | 15126 | 2 |
| B | 0 | 16488 | 2 |
| C | 0 | 15230 | 2 |
| D | 0 | 16425 | 2 |
| Quadrant | Total seconds | Saturated seconds | Saturation percentage |
|---|---|---|---|
| A | 6336 | 190 | 2.998737% |
| B | 6336 | 206 | 3.251263% |
| C | 6336 | 211 | 3.330177% |
| D | 6336 | 172 | 2.714646% |
Noise dominated data is calculated using 1-second bins in cleaned event files. If a bin has >2000 counts, and if more than 50% of those come from <1% of pixels, then it is considered to be noise-dominated and hence unusable.
| Quadrant | # 1 sec bins | Bins with >0 counts | Bins with >2000 counts | High rate bins dominated by noise | Noise dominated (total time) | Noise dominated (detector-on time) | Marked lightcurve |
|---|---|---|---|---|---|---|---|
| A | 7601 | 6336 | 48 | 48 | 0.63% | 0.76% | 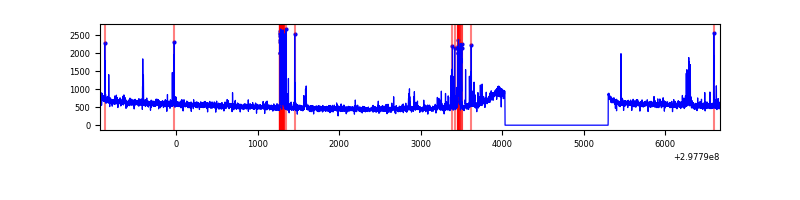 |
| B | 7600 | 6335 | 28 | 28 | 0.37% | 0.44% | 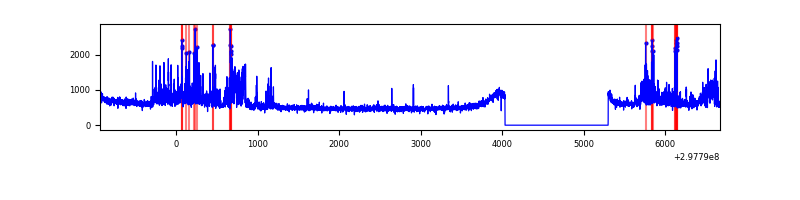 |
| C | 7600 | 6335 | 4 | 4 | 0.05% | 0.06% | 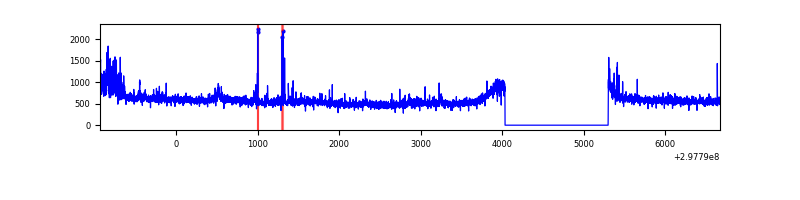 |
| D | 7600 | 6335 | 69 | 69 | 0.91% | 1.09% | 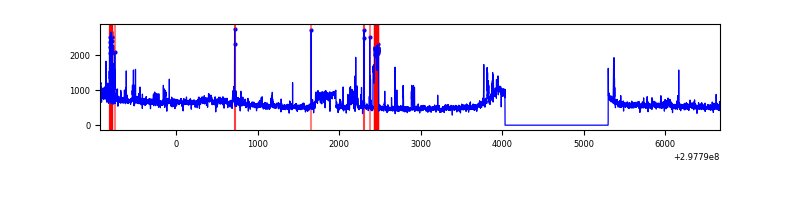 |
Top three noisy pixels from each quadrant. If the there are fewer than three noisy pixels in the level2.evt file, extra rows are filled as -1
| Pixel properties | Quadrant properties | ||||||
|---|---|---|---|---|---|---|---|
| Quadrant | DetID | PixID | Counts | Sigma | Mean | Median | Sigma |
| A | 14 | 238 | 201395 | 1134.53 | 887 | 871 | 176.7 |
| A | 14 | 254 | 93687 | 525.14 | 887 | 871 | 176.7 |
| A | 0 | 226 | 7762 | 38.99 | 887 | 871 | 176.7 |
| B | 0 | 197 | 257471 | 1567.76 | 878 | 860 | 163.7 |
| B | 7 | 220 | 253155 | 1541.39 | 878 | 860 | 163.7 |
| B | 0 | 245 | 31220 | 185.48 | 878 | 860 | 163.7 |
| C | 3 | 233 | 182974 | 928.06 | 852 | 861 | 196.2 |
| C | 14 | 238 | 135880 | 688.06 | 852 | 861 | 196.2 |
| C | 0 | 207 | 125640 | 635.88 | 852 | 861 | 196.2 |
| D | 1 | 52 | 668217 | 3169.07 | 875 | 852 | 210.6 |
| D | 12 | 218 | 71391 | 334.96 | 875 | 852 | 210.6 |
| D | 2 | 234 | 25141 | 115.34 | 875 | 852 | 210.6 |
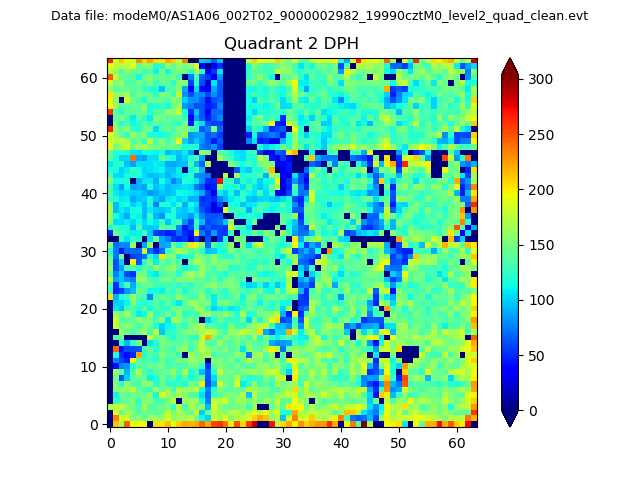
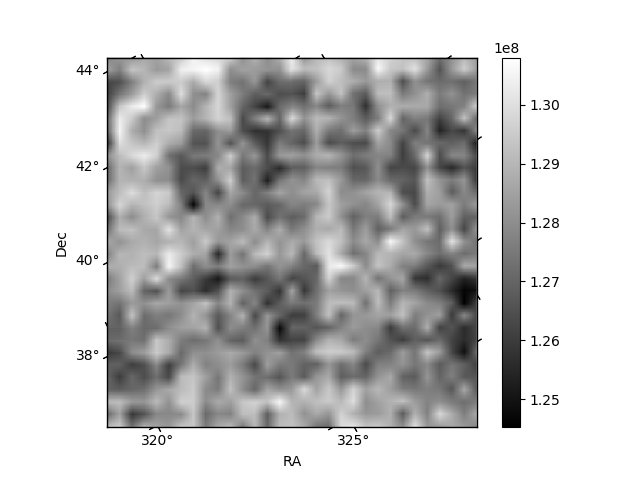
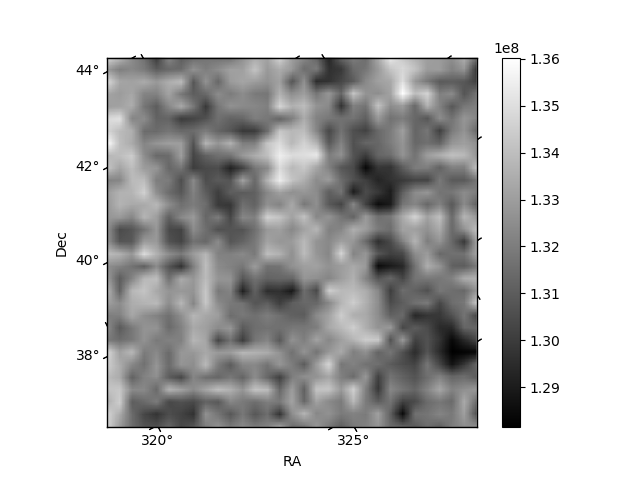
Histogram calculated using DETX and DETY for each event in the final _common_clean file
| Quadrant A | 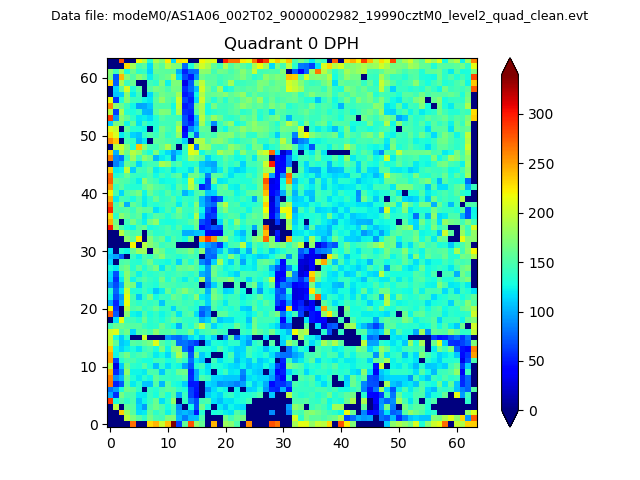 |
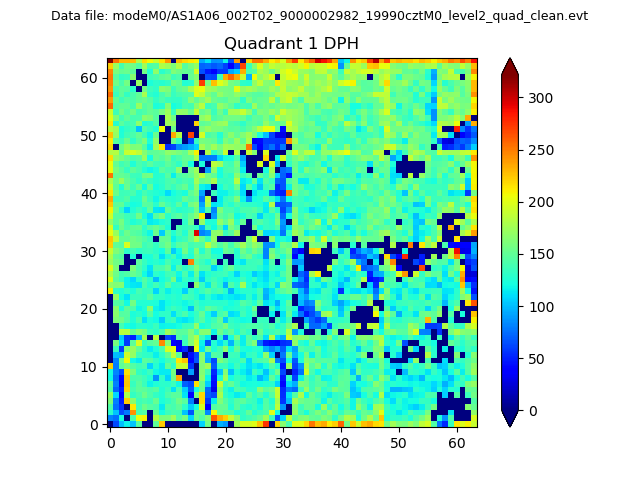 |
Quadrant B |
|---|---|---|---|
| Quadrant D | 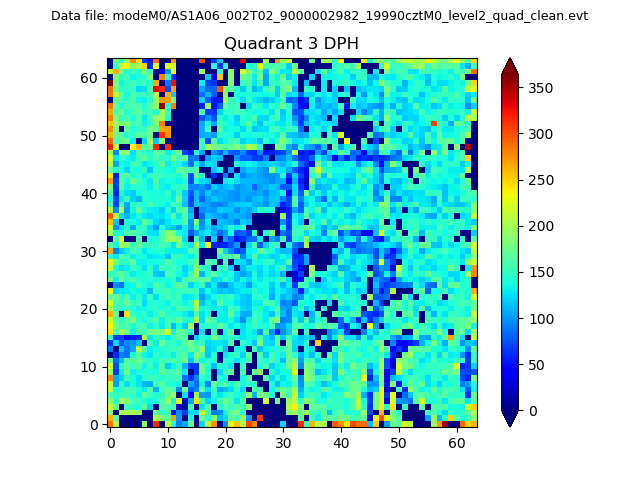 |
 |
Quadrant C |
| Plot type | Count rate plots | Images |
|---|---|---|
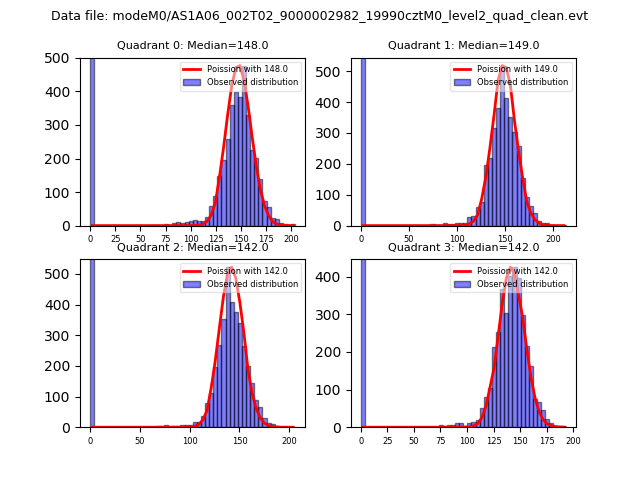
| Comparison with Poisson distribution Blue bars denote a histogram of data divided into 1 sec bins. Red curve is a Poisson curve with rate = median count rate of data. |
 |
 |
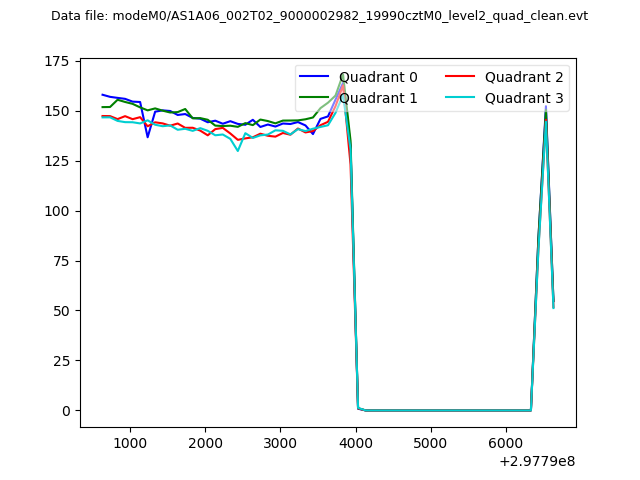
| Quadrant-wise count rates Data is divided into 100 sec bins |
 |
|
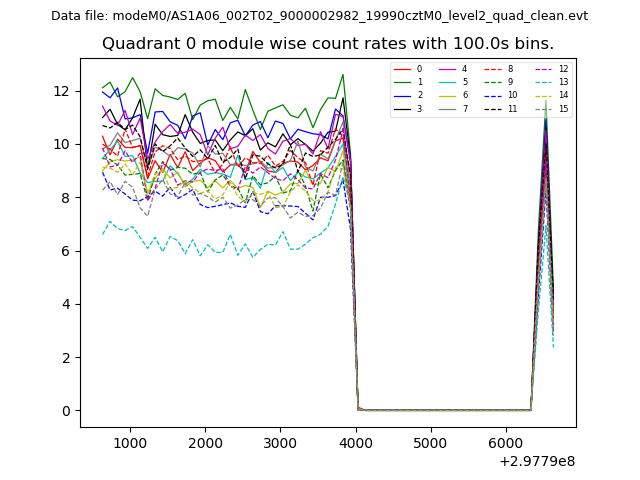
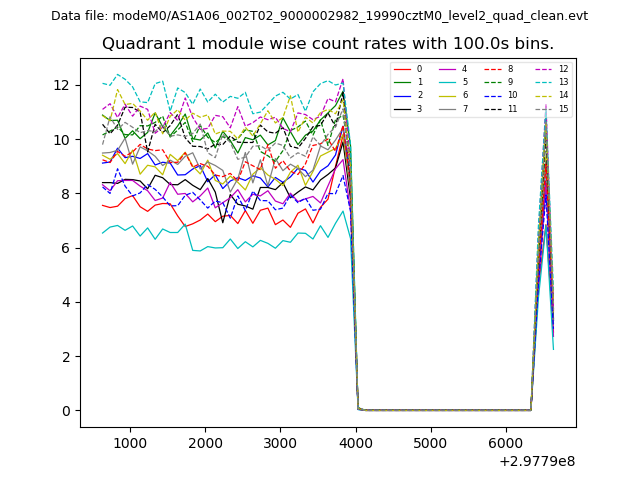
| Module-wise count rates for Quadrant A Data is divided into 100 sec bins |
 |
 |
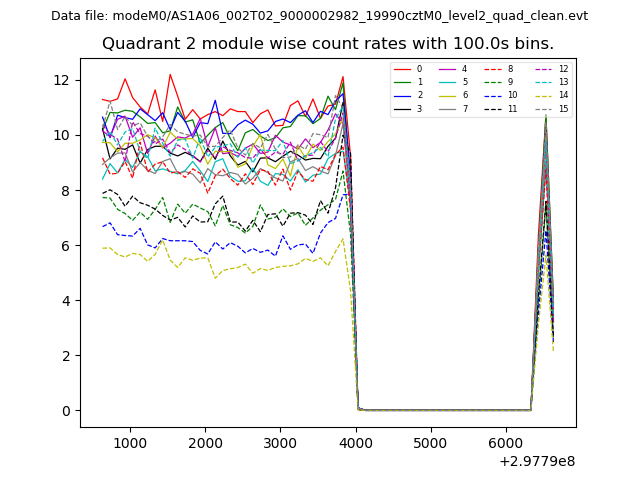
| Module-wise count rates for Quadrant B Data is divided into 100 sec bins |
 |
 |
| Module-wise count rates for Quadrant C Data is divided into 100 sec bins |
 |
 |
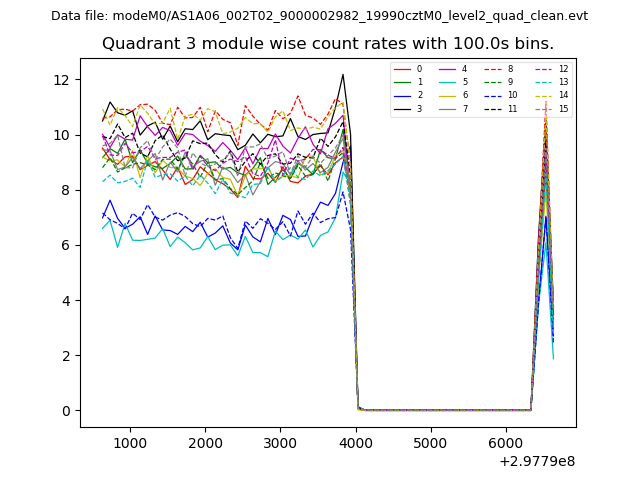
| Module-wise count rates for Quadrant D Data is divided into 100 sec bins |
 |
 |
| Parameter | Plot |
|---|---|
| CZT HV Monitor | 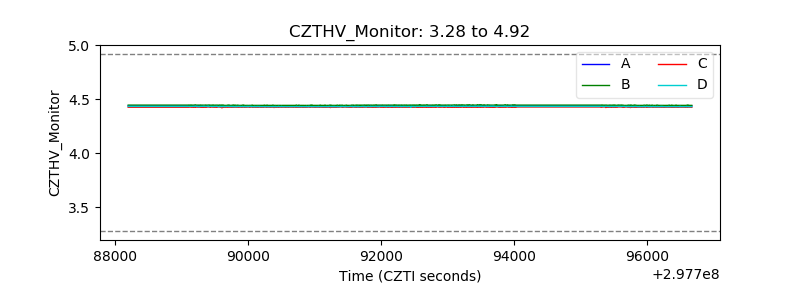 |
| D_VDD | 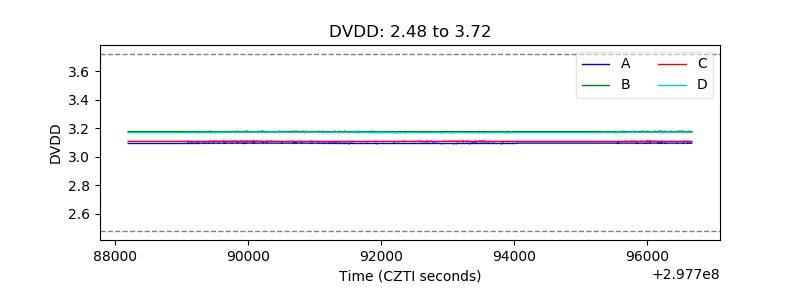 |
| Temperature 1 | 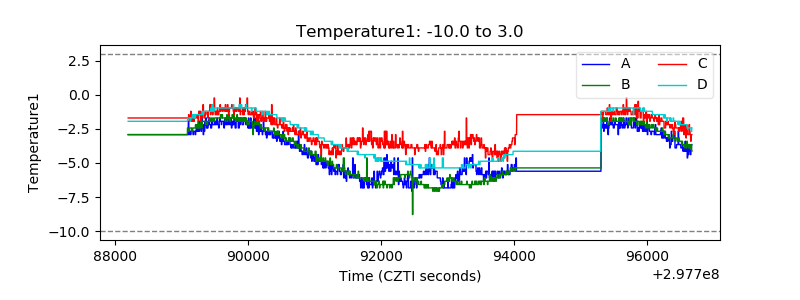 |
| Veto HV Monitor |  |
| Veto LLD | 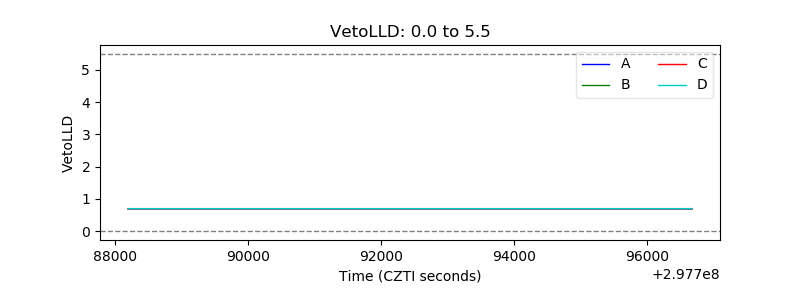 |
| Alpha Counter | 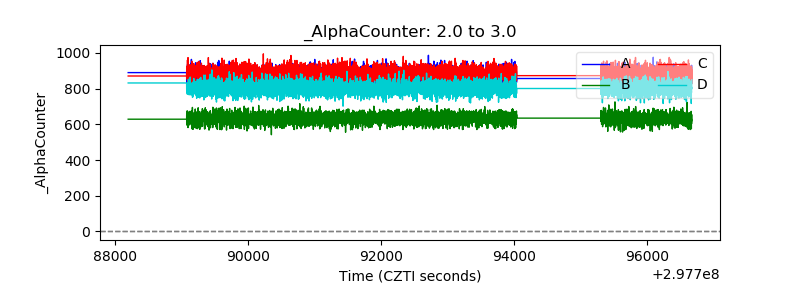 |
| _CPM_Rate | 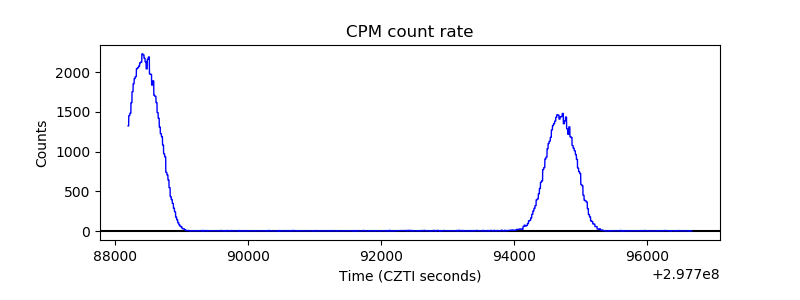 |
| CZT Counter | 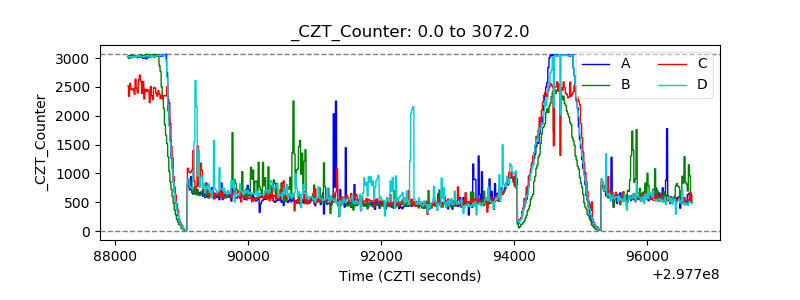 |
| +2.5 Volts monitor |  |
| +5 Volts monitor |  |
| _ROLL_ROT | 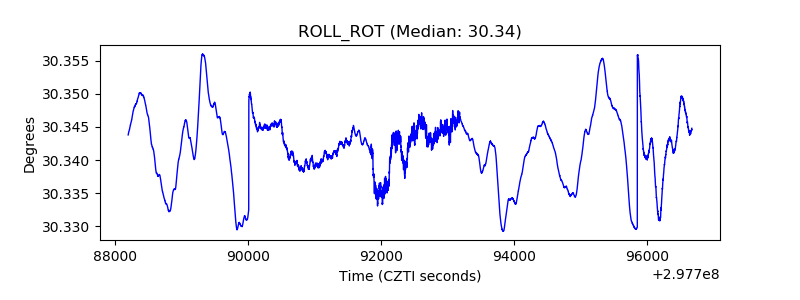 |
| _Roll_DEC | 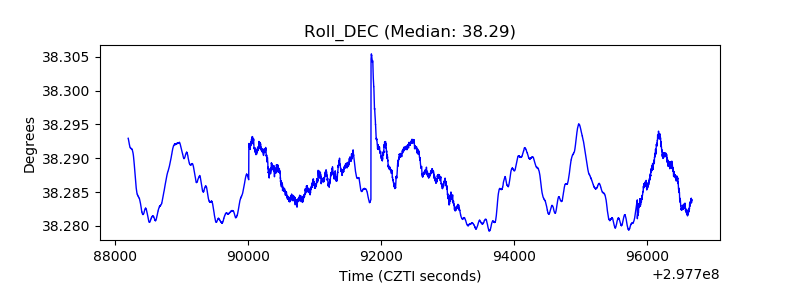 |
| _Roll_RA | 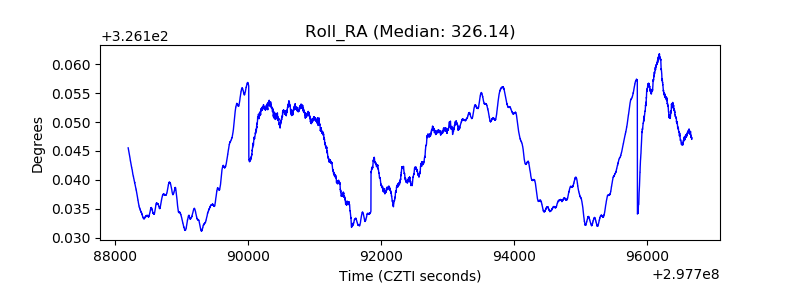 |
| Veto Counter | 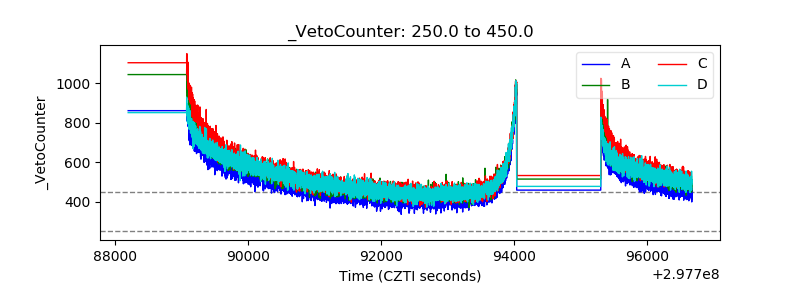 |