| Param | Original file | Final file |
|---|---|---|
| Filename | modeM0/AS1A06_002T02_9000002982_19991cztM0_level2.evt | modeM0/AS1A06_002T02_9000002982_19991cztM0_level2_quad_clean.evt |
| Size (bytes) | 490,553,280 | 92,376,000 |
| Size | 467.8 MB | 88.1 MB |
| Events in quadrant A | 3,837,749 | 592,072 |
| Events in quadrant B | 3,711,603 | 603,569 |
| Events in quadrant C | 3,397,448 | 580,572 |
| Events in quadrant D | 3,477,231 | 576,918 |
| Mode M9 | |||
|---|---|---|---|
| Quadrant | BADHDUFLAG | Total packets | Discarded packets |
| A | 0 | 14 | 0 |
| B | 0 | 15 | 0 |
| C | 0 | 15 | 0 |
| D | 0 | 15 | 0 |
| Mode SS | |||
|---|---|---|---|
| Quadrant | BADHDUFLAG | Total packets | Discarded packets |
| A | 0 | 130 | 0 |
| B | 0 | 130 | 0 |
| C | 0 | 130 | 0 |
| D | 0 | 130 | 0 |
| Mode M0 | |||
|---|---|---|---|
| Quadrant | BADHDUFLAG | Total packets | Discarded packets |
| A | 0 | 15383 | 2 |
| B | 0 | 15329 | 2 |
| C | 0 | 13948 | 2 |
| D | 0 | 14424 | 2 |
| Quadrant | Total seconds | Saturated seconds | Saturation percentage |
|---|---|---|---|
| A | 6366 | 175 | 2.748979% |
| B | 6366 | 127 | 1.994973% |
| C | 6366 | 138 | 2.167766% |
| D | 6366 | 89 | 1.398052% |
Noise dominated data is calculated using 1-second bins in cleaned event files. If a bin has >2000 counts, and if more than 50% of those come from <1% of pixels, then it is considered to be noise-dominated and hence unusable.
| Quadrant | # 1 sec bins | Bins with >0 counts | Bins with >2000 counts | High rate bins dominated by noise | Noise dominated (total time) | Noise dominated (detector-on time) | Marked lightcurve |
|---|---|---|---|---|---|---|---|
| A | 7506 | 6366 | 116 | 116 | 1.55% | 1.82% |  |
| B | 7506 | 6366 | 27 | 27 | 0.36% | 0.42% |  |
| C | 7505 | 6365 | 0 | 0 | 0.00% | 0.00% | 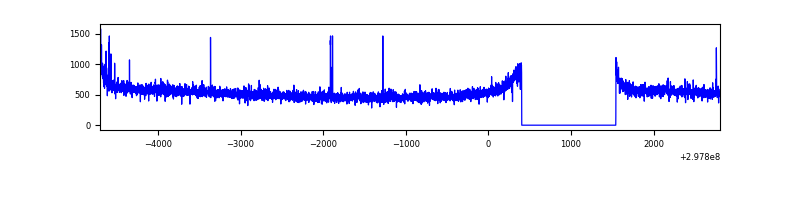 |
| D | 7506 | 6366 | 21 | 21 | 0.28% | 0.33% | 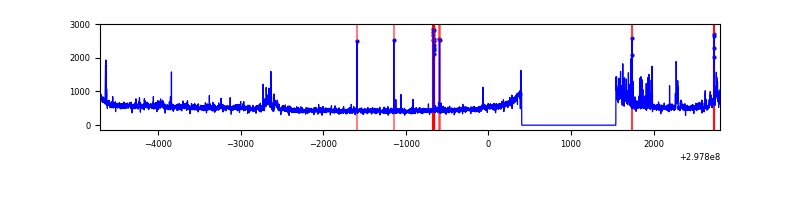 |
Top three noisy pixels from each quadrant. If the there are fewer than three noisy pixels in the level2.evt file, extra rows are filled as -1
| Pixel properties | Quadrant properties | ||||||
|---|---|---|---|---|---|---|---|
| Quadrant | DetID | PixID | Counts | Sigma | Mean | Median | Sigma |
| A | 14 | 238 | 561225 | 3341.11 | 835 | 819 | 167.7 |
| A | 14 | 254 | 59143 | 347.72 | 835 | 819 | 167.7 |
| A | 0 | 226 | 7272 | 38.47 | 835 | 819 | 167.7 |
| B | 0 | 197 | 155907 | 985.37 | 834 | 816 | 157.4 |
| B | 7 | 220 | 130650 | 824.9 | 834 | 816 | 157.4 |
| B | 0 | 190 | 77722 | 488.62 | 834 | 816 | 157.4 |
| C | 14 | 238 | 129005 | 684.87 | 811 | 818 | 187.2 |
| C | 0 | 207 | 61055 | 321.83 | 811 | 818 | 187.2 |
| C | 3 | 233 | 33491 | 174.56 | 811 | 818 | 187.2 |
| D | 1 | 52 | 214390 | 1069.96 | 826 | 805 | 199.6 |
| D | 12 | 227 | 75226 | 372.81 | 826 | 805 | 199.6 |
| D | 2 | 234 | 27070 | 131.58 | 826 | 805 | 199.6 |
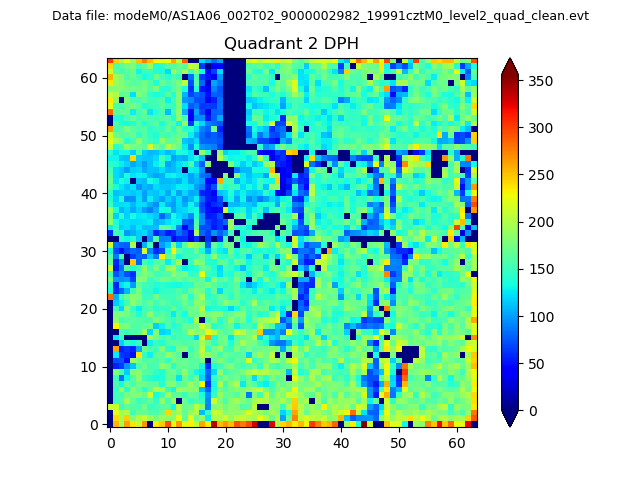
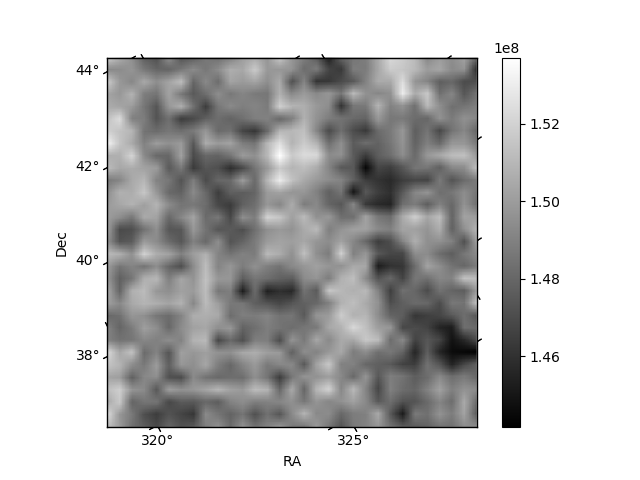
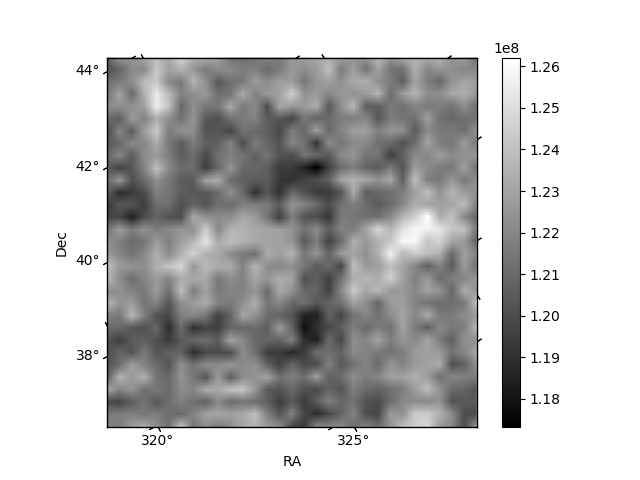
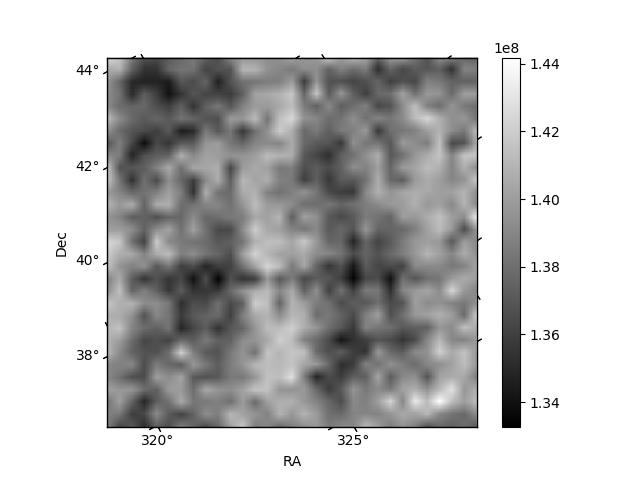
Histogram calculated using DETX and DETY for each event in the final _common_clean file
| Quadrant A | 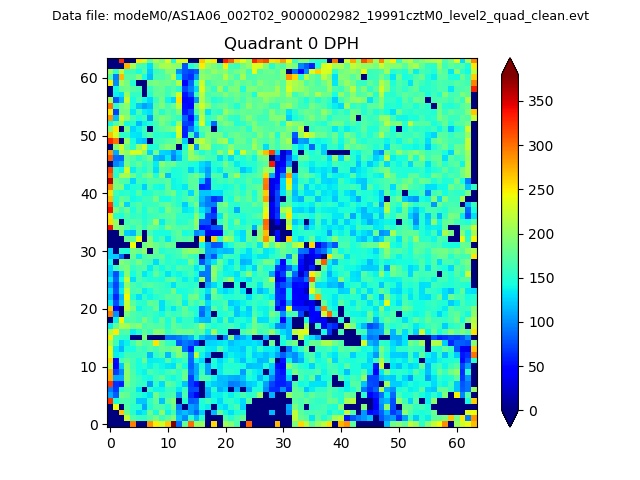 |
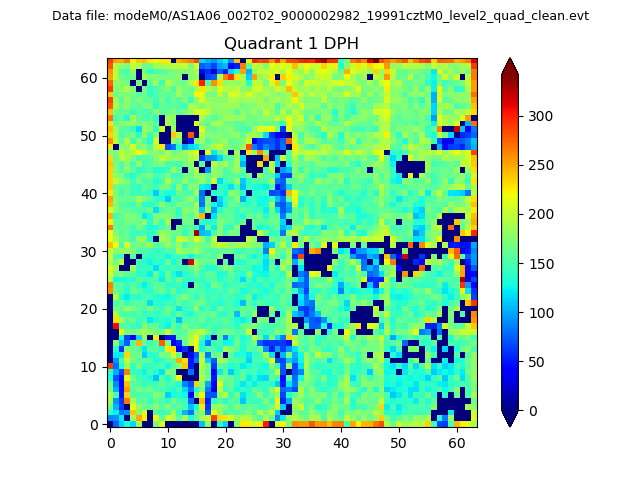 |
Quadrant B |
|---|---|---|---|
| Quadrant D | 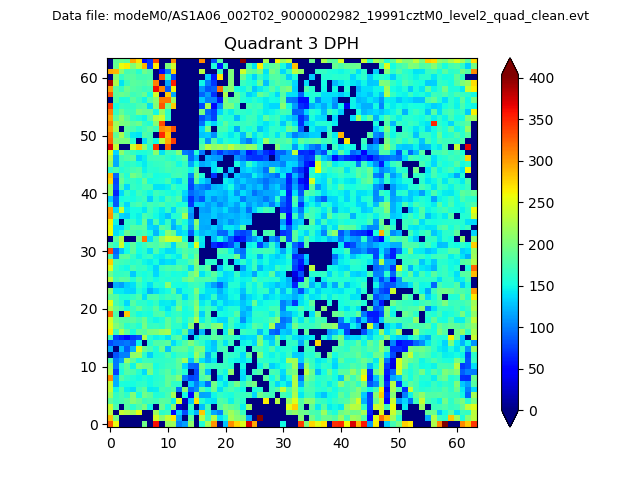 |
 |
Quadrant C |
| Plot type | Count rate plots | Images |
|---|---|---|
| Comparison with Poisson distribution Blue bars denote a histogram of data divided into 1 sec bins. Red curve is a Poisson curve with rate = median count rate of data. |
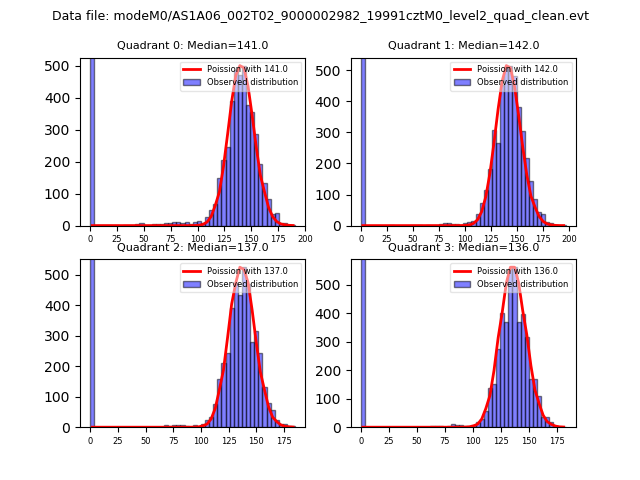 |
 |
| Quadrant-wise count rates Data is divided into 100 sec bins |
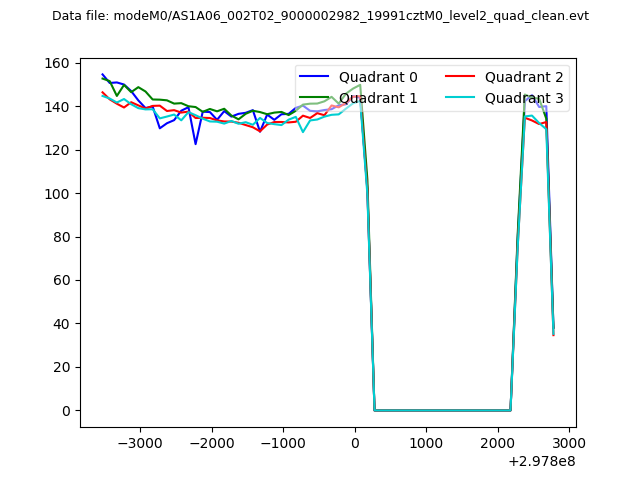 |
|
| Module-wise count rates for Quadrant A Data is divided into 100 sec bins |
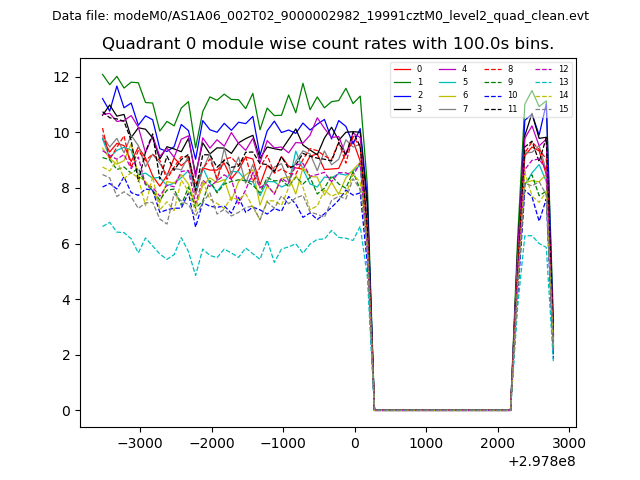 |
 |
| Module-wise count rates for Quadrant B Data is divided into 100 sec bins |
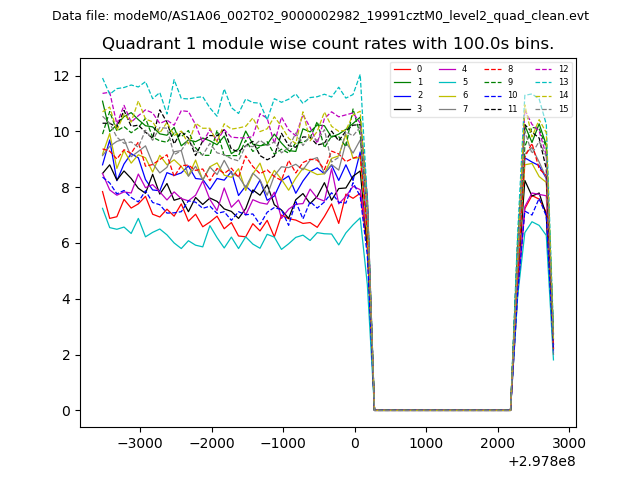 |
 |
| Module-wise count rates for Quadrant C Data is divided into 100 sec bins |
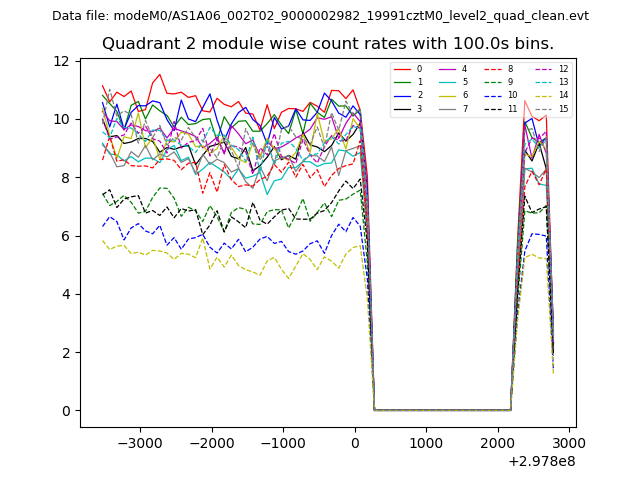 |
 |
| Module-wise count rates for Quadrant D Data is divided into 100 sec bins |
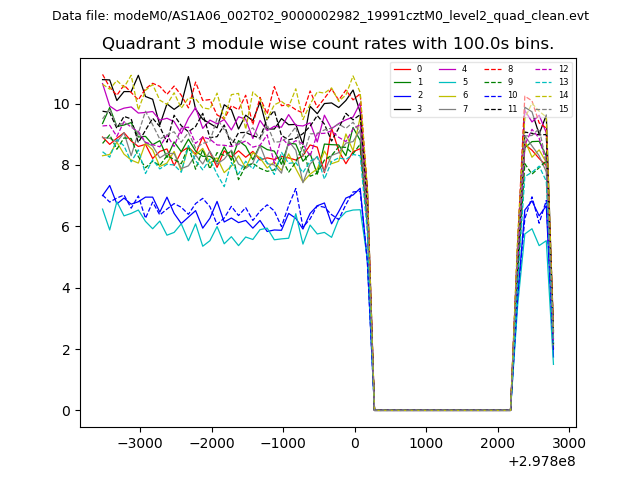 |
 |
| Parameter | Plot |
|---|---|
| CZT HV Monitor | 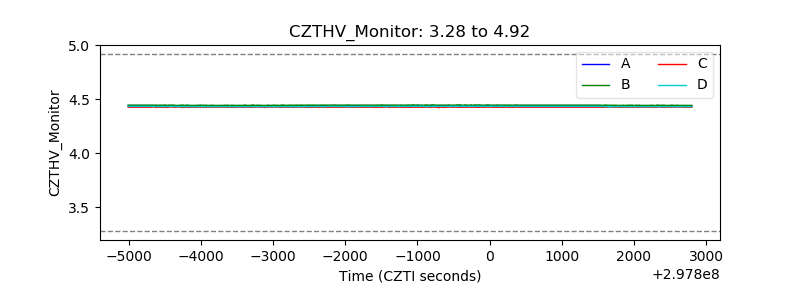 |
| D_VDD |  |
| Temperature 1 | 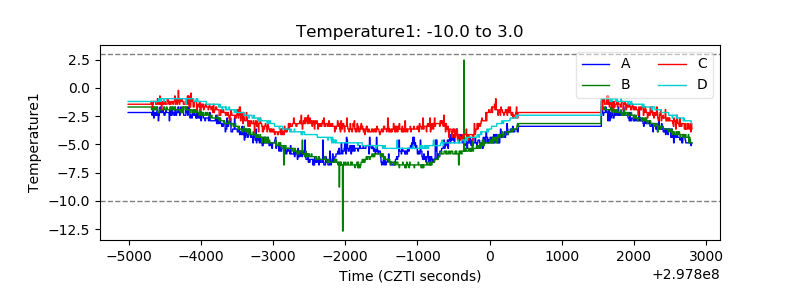 |
| Veto HV Monitor |  |
| Veto LLD | 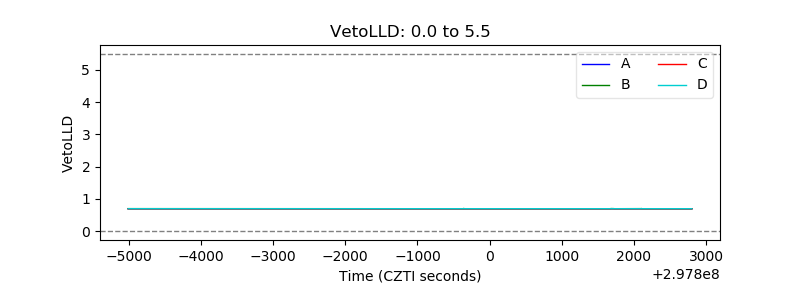 |
| Alpha Counter | 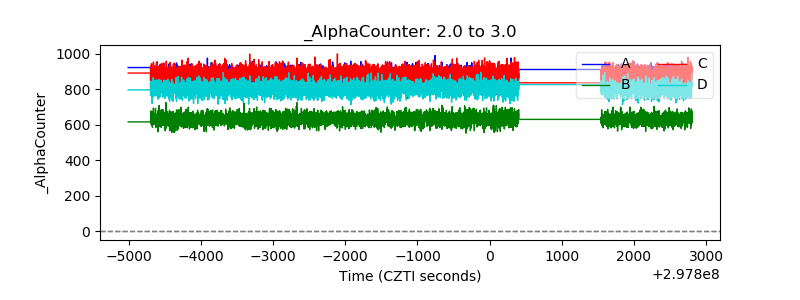 |
| _CPM_Rate | 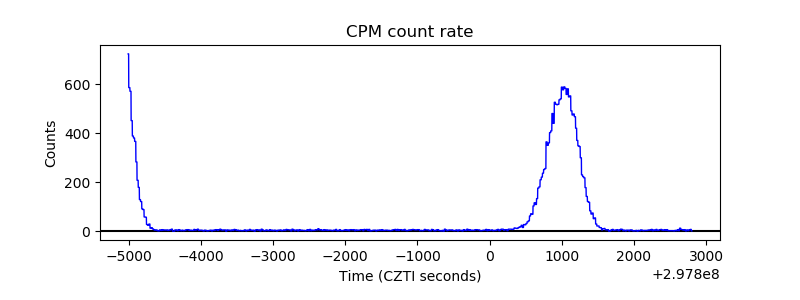 |
| CZT Counter | 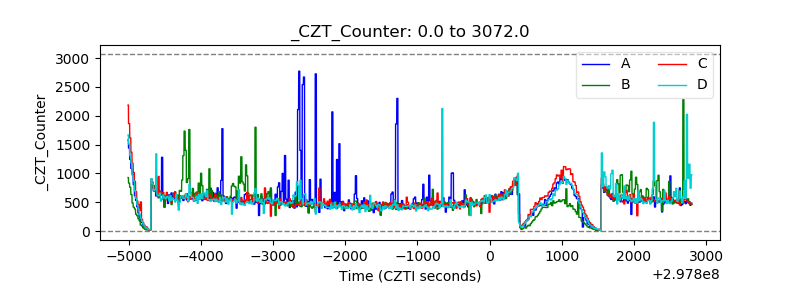 |
| +2.5 Volts monitor |  |
| +5 Volts monitor |  |
| _ROLL_ROT | 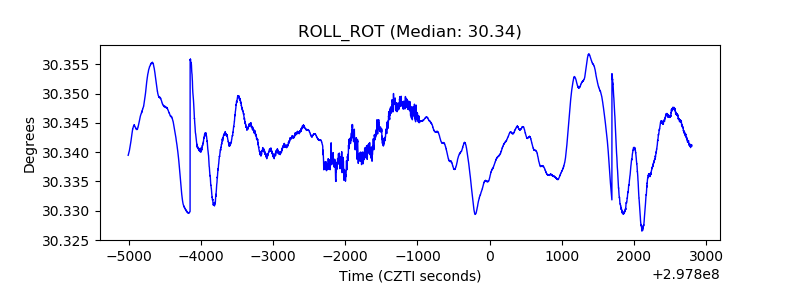 |
| _Roll_DEC | 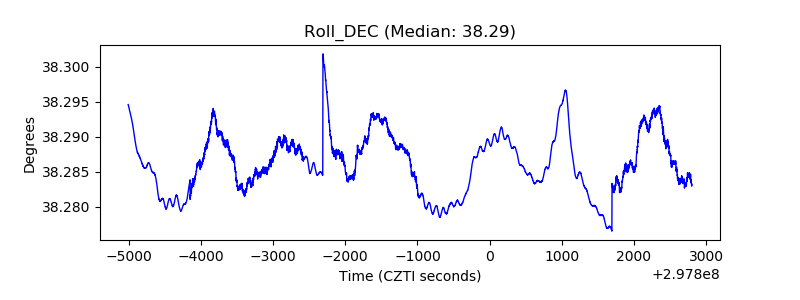 |
| _Roll_RA | 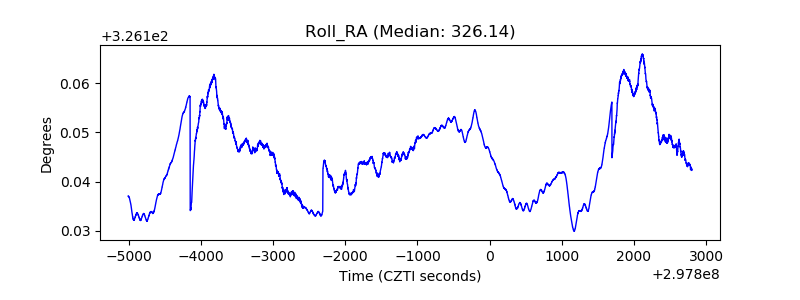 |
| Veto Counter | 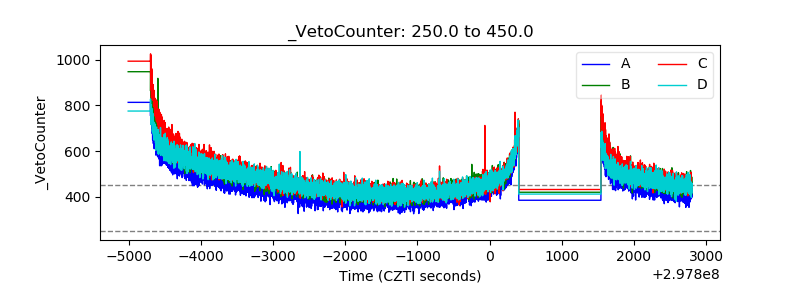 |