| Param | Original file | Final file |
|---|---|---|
| Filename | modeM0/AS1A06_002T02_9000002982_19992cztM0_level2.evt | modeM0/AS1A06_002T02_9000002982_19992cztM0_level2_quad_clean.evt |
| Size (bytes) | 522,112,320 | 100,301,760 |
| Size | 497.9 MB | 95.7 MB |
| Events in quadrant A | 3,706,160 | 647,966 |
| Events in quadrant B | 3,911,323 | 649,756 |
| Events in quadrant C | 3,610,521 | 625,487 |
| Events in quadrant D | 4,101,840 | 619,615 |
| Mode M9 | |||
|---|---|---|---|
| Quadrant | BADHDUFLAG | Total packets | Discarded packets |
| A | 0 | 19 | 0 |
| B | 0 | 19 | 0 |
| C | 0 | 19 | 0 |
| D | 0 | 19 | 0 |
| Mode SS | |||
|---|---|---|---|
| Quadrant | BADHDUFLAG | Total packets | Discarded packets |
| A | 0 | 148 | 0 |
| B | 0 | 148 | 0 |
| C | 0 | 148 | 0 |
| D | 0 | 148 | 0 |
| Mode M0 | |||
|---|---|---|---|
| Quadrant | BADHDUFLAG | Total packets | Discarded packets |
| A | 0 | 15627 | 1 |
| B | 0 | 16360 | 1 |
| C | 0 | 15171 | 1 |
| D | 0 | 16937 | 1 |
| Quadrant | Total seconds | Saturated seconds | Saturation percentage |
|---|---|---|---|
| A | 7104 | 122 | 1.717342% |
| B | 7105 | 162 | 2.280084% |
| C | 7105 | 183 | 2.575651% |
| D | 7105 | 160 | 2.251935% |
Noise dominated data is calculated using 1-second bins in cleaned event files. If a bin has >2000 counts, and if more than 50% of those come from <1% of pixels, then it is considered to be noise-dominated and hence unusable.
| Quadrant | # 1 sec bins | Bins with >0 counts | Bins with >2000 counts | High rate bins dominated by noise | Noise dominated (total time) | Noise dominated (detector-on time) | Marked lightcurve |
|---|---|---|---|---|---|---|---|
| A | 9019 | 7105 | 27 | 27 | 0.30% | 0.38% | 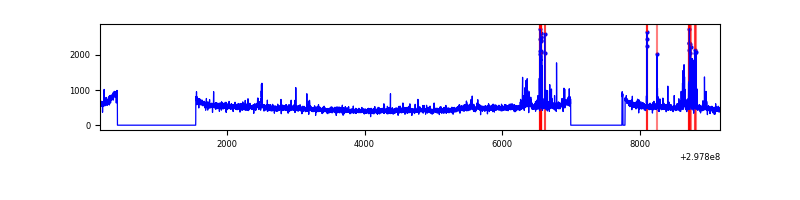 |
| B | 9020 | 7105 | 21 | 21 | 0.23% | 0.30% | 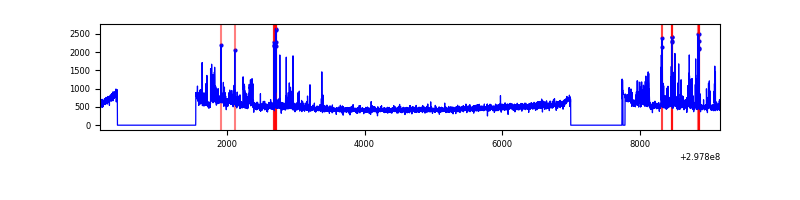 |
| C | 9019 | 7104 | 0 | 0 | 0.00% | 0.00% | 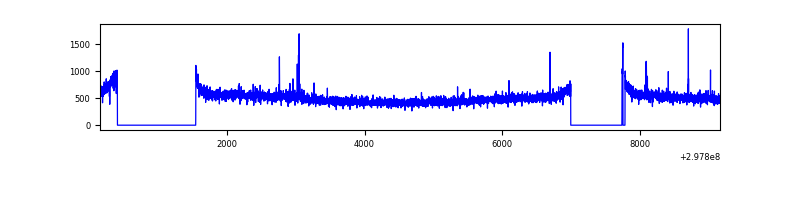 |
| D | 9020 | 7105 | 54 | 54 | 0.60% | 0.76% | 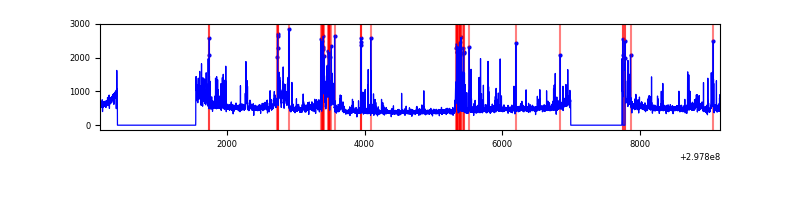 |
Top three noisy pixels from each quadrant. If the there are fewer than three noisy pixels in the level2.evt file, extra rows are filled as -1
| Pixel properties | Quadrant properties | ||||||
|---|---|---|---|---|---|---|---|
| Quadrant | DetID | PixID | Counts | Sigma | Mean | Median | Sigma |
| A | 14 | 238 | 190286 | 1046.41 | 900 | 880 | 181.0 |
| A | 13 | 252 | 50231 | 272.65 | 900 | 880 | 181.0 |
| A | 0 | 226 | 7703 | 37.69 | 900 | 880 | 181.0 |
| B | 0 | 197 | 151406 | 885.11 | 895 | 872 | 170.1 |
| B | 7 | 220 | 112515 | 656.44 | 895 | 872 | 170.1 |
| B | 0 | 190 | 71415 | 414.78 | 895 | 872 | 170.1 |
| C | 14 | 238 | 136423 | 669.98 | 868 | 874 | 202.3 |
| C | 3 | 233 | 45409 | 220.12 | 868 | 874 | 202.3 |
| C | 0 | 207 | 39871 | 192.75 | 868 | 874 | 202.3 |
| D | 12 | 227 | 283287 | 1327.71 | 881 | 858 | 212.7 |
| D | 1 | 52 | 261731 | 1226.37 | 881 | 858 | 212.7 |
| D | 12 | 218 | 137722 | 643.4 | 881 | 858 | 212.7 |
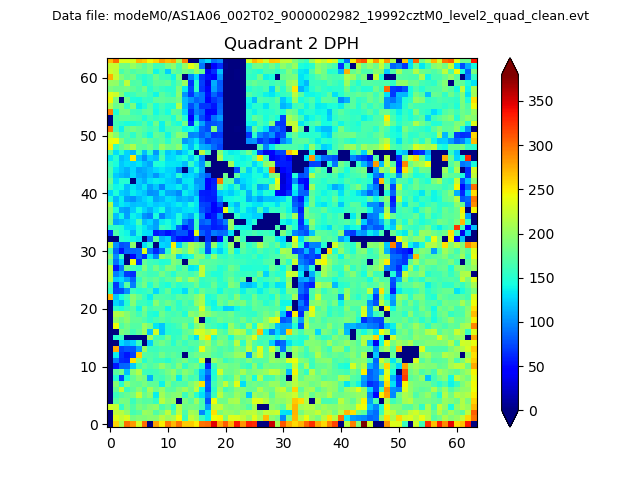
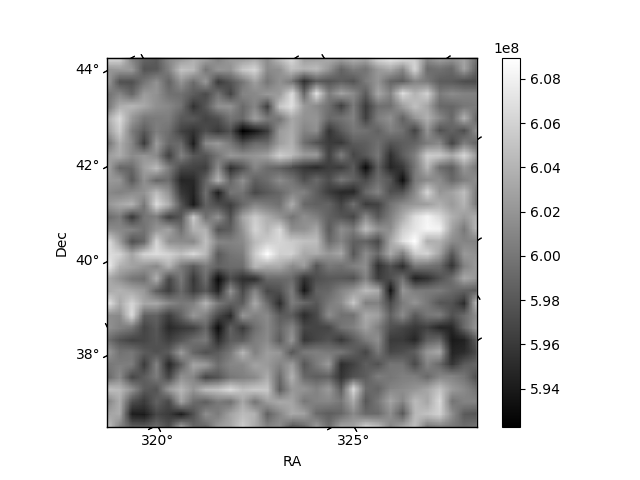
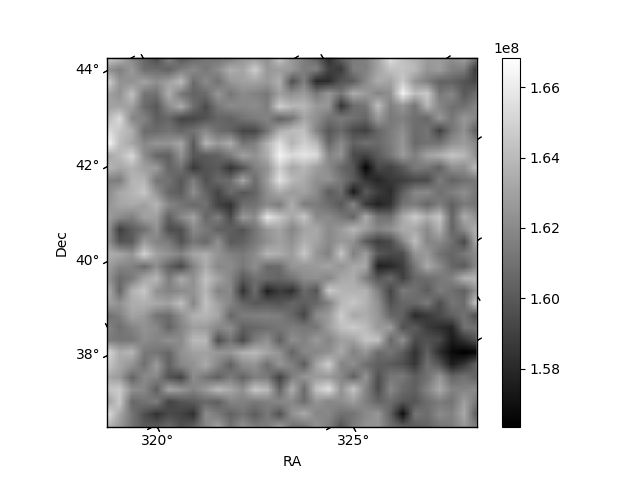
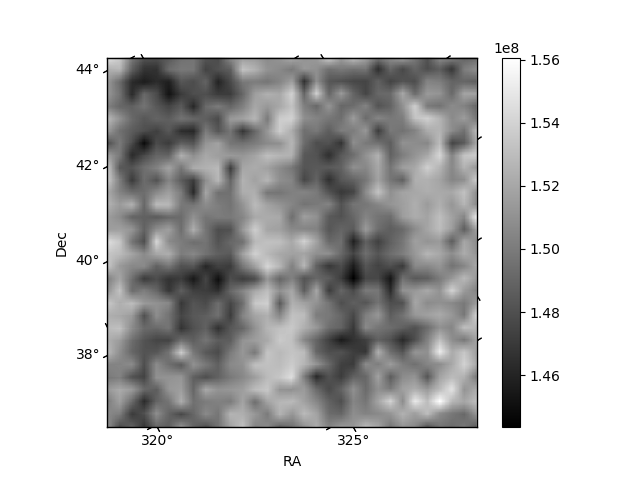
Histogram calculated using DETX and DETY for each event in the final _common_clean file
| Quadrant A | 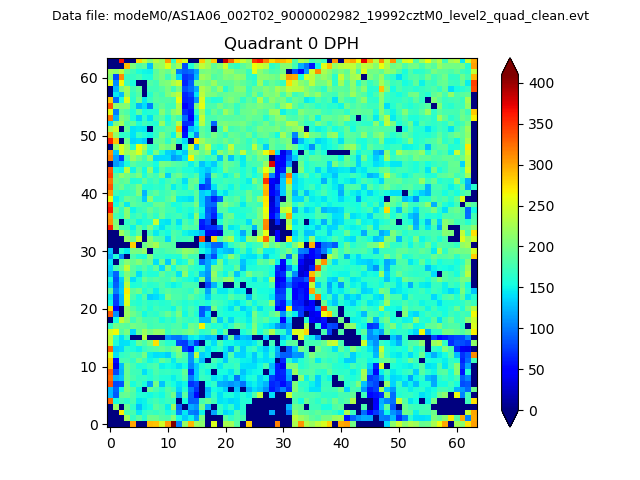 |
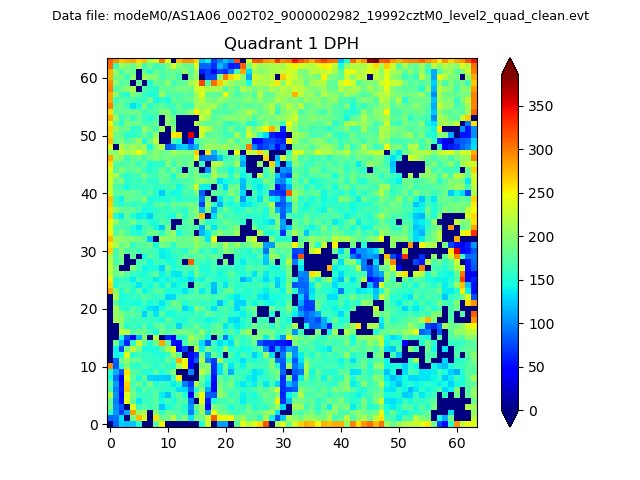 |
Quadrant B |
|---|---|---|---|
| Quadrant D | 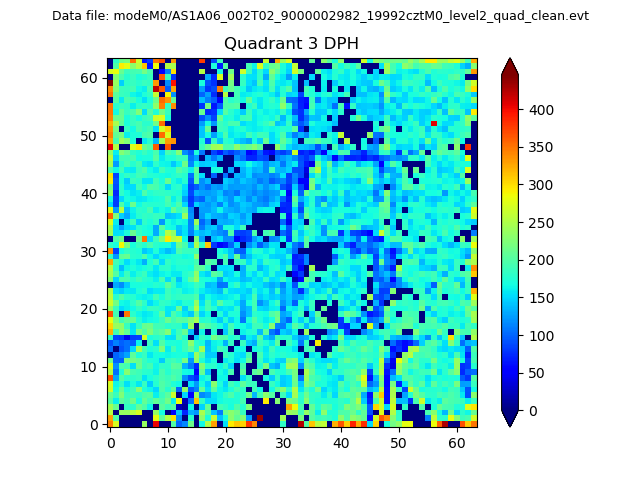 |
 |
Quadrant C |
| Plot type | Count rate plots | Images |
|---|---|---|
| Comparison with Poisson distribution Blue bars denote a histogram of data divided into 1 sec bins. Red curve is a Poisson curve with rate = median count rate of data. |
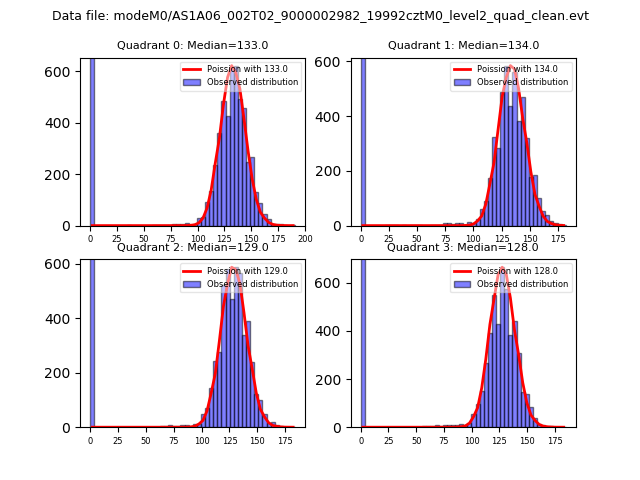 |
 |
| Quadrant-wise count rates Data is divided into 100 sec bins |
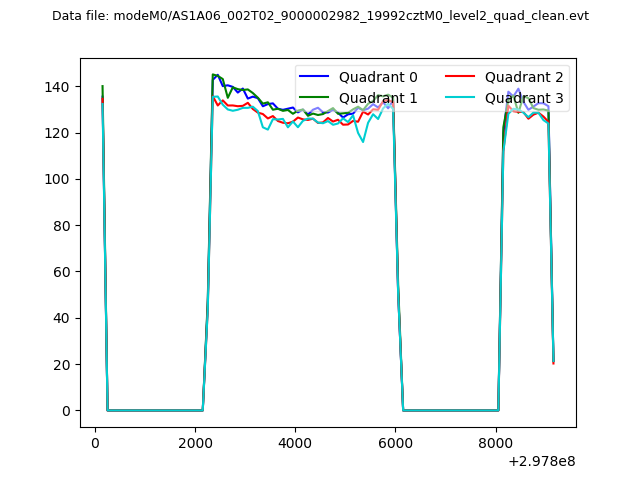 |
|
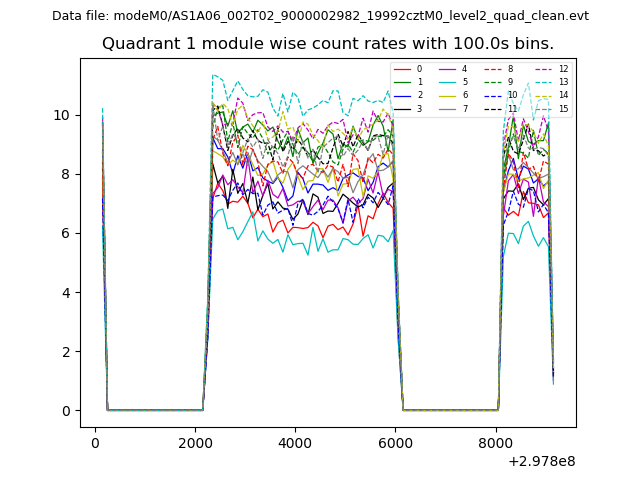
| Module-wise count rates for Quadrant A Data is divided into 100 sec bins |
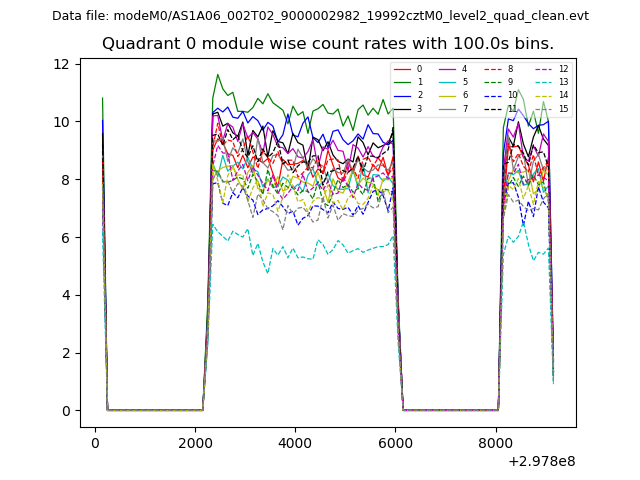 |
 |
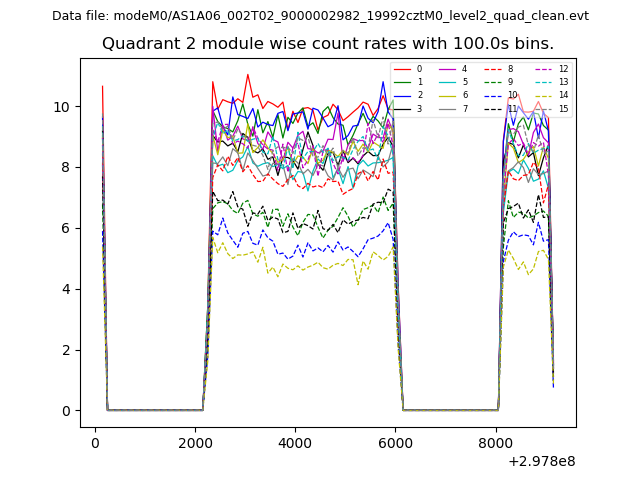
| Module-wise count rates for Quadrant B Data is divided into 100 sec bins |
 |
 |
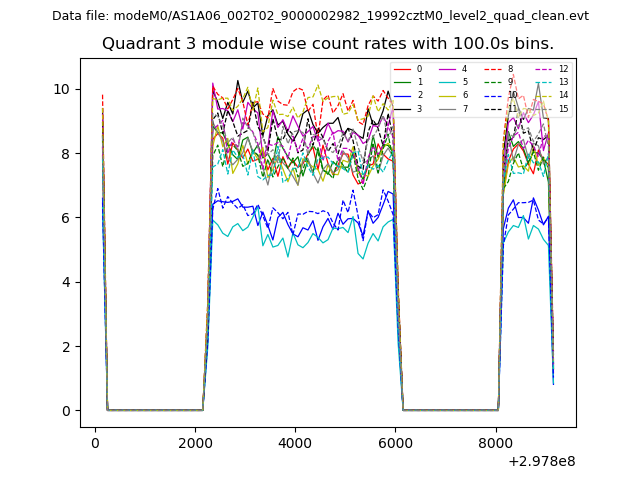
| Module-wise count rates for Quadrant C Data is divided into 100 sec bins |
 |
 |
| Module-wise count rates for Quadrant D Data is divided into 100 sec bins |
 |
 |
| Parameter | Plot |
|---|---|
| CZT HV Monitor | 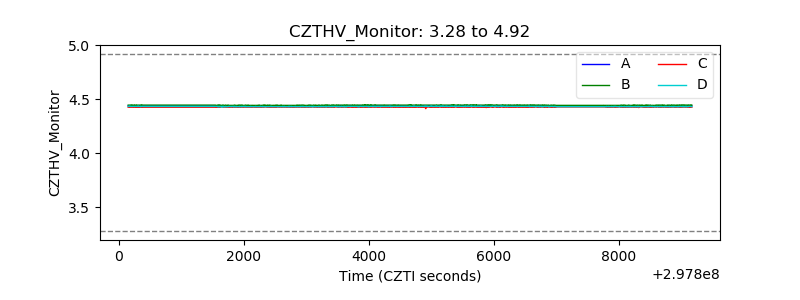 |
| D_VDD |  |
| Temperature 1 | 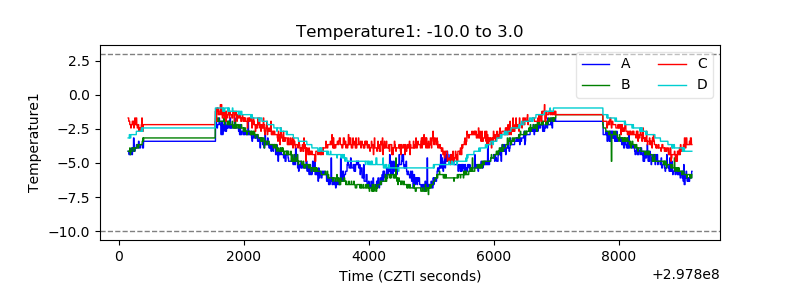 |
| Veto HV Monitor | 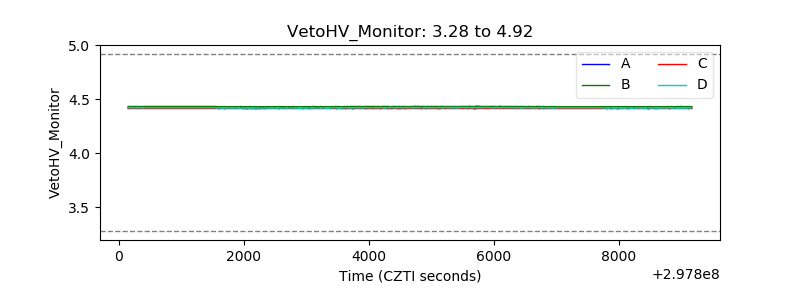 |
| Veto LLD | 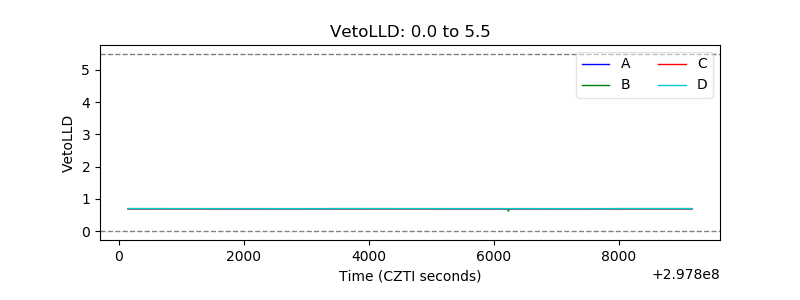 |
| Alpha Counter | 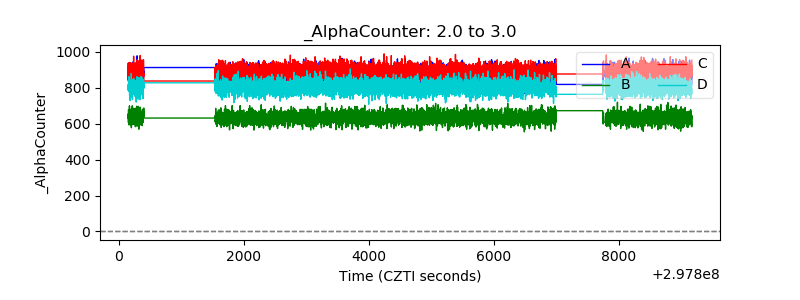 |
| _CPM_Rate | 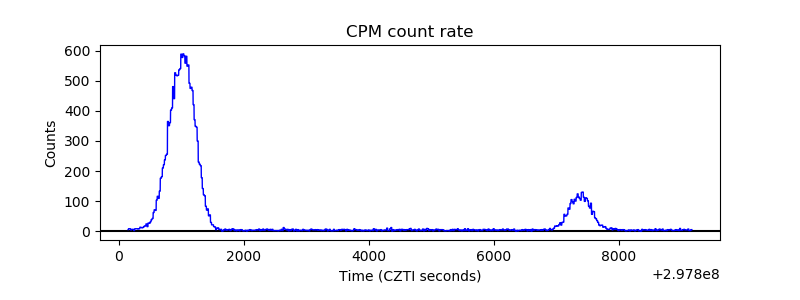 |
| CZT Counter |  |
| +2.5 Volts monitor | 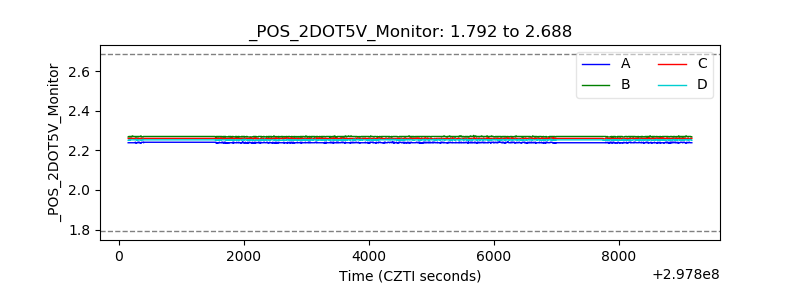 |
| +5 Volts monitor | 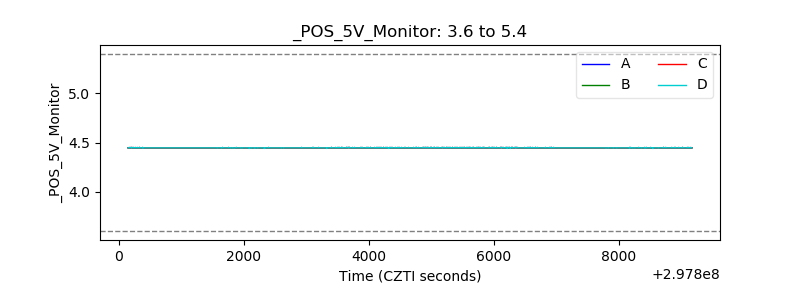 |
| _ROLL_ROT | 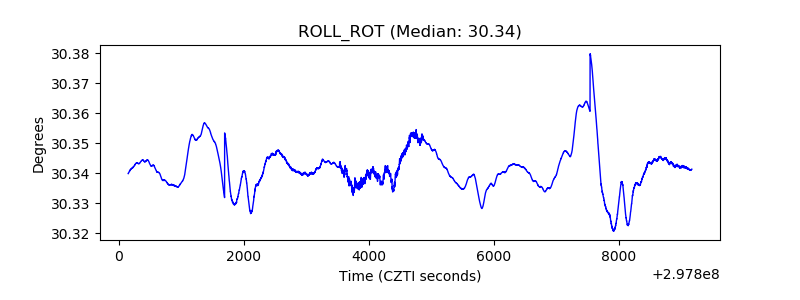 |
| _Roll_DEC | 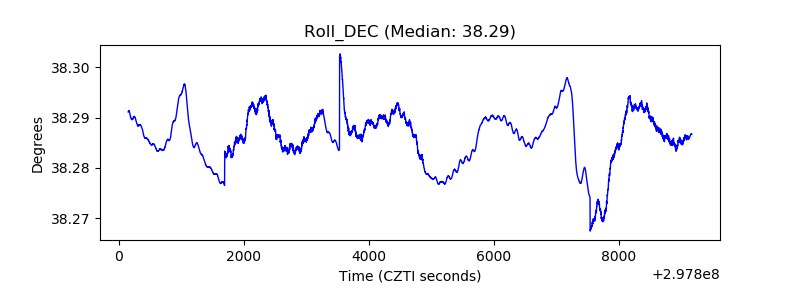 |
| _Roll_RA | 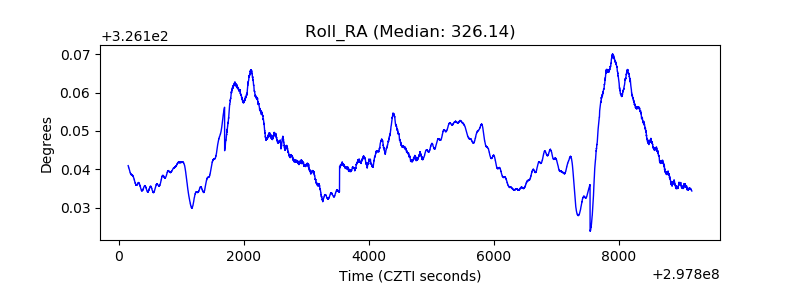 |
| Veto Counter | 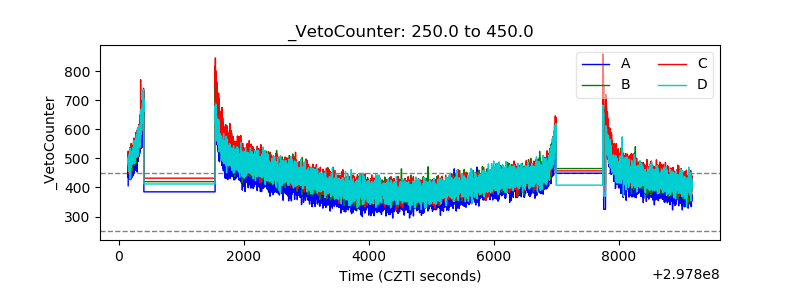 |