| Param | Original file | Final file |
|---|---|---|
| Filename | modeM0/AS1A06_002T02_9000002982_19993cztM0_level2.evt | modeM0/AS1A06_002T02_9000002982_19993cztM0_level2_quad_clean.evt |
| Size (bytes) | 530,568,000 | 102,631,680 |
| Size | 506.0 MB | 97.9 MB |
| Events in quadrant A | 3,715,991 | 662,391 |
| Events in quadrant B | 3,888,905 | 662,919 |
| Events in quadrant C | 3,697,257 | 638,739 |
| Events in quadrant D | 4,271,033 | 636,626 |
| Mode M9 | |||
|---|---|---|---|
| Quadrant | BADHDUFLAG | Total packets | Discarded packets |
| A | 0 | 5 | 0 |
| B | 0 | 6 | 0 |
| C | 0 | 6 | 0 |
| D | 0 | 6 | 0 |
| Mode SS | |||
|---|---|---|---|
| Quadrant | BADHDUFLAG | Total packets | Discarded packets |
| A | 0 | 148 | 0 |
| B | 0 | 148 | 0 |
| C | 0 | 148 | 0 |
| D | 0 | 148 | 0 |
| Mode M0 | |||
|---|---|---|---|
| Quadrant | BADHDUFLAG | Total packets | Discarded packets |
| A | 0 | 15816 | 1 |
| B | 0 | 16389 | 1 |
| C | 0 | 15735 | 1 |
| D | 0 | 17596 | 1 |
| Quadrant | Total seconds | Saturated seconds | Saturation percentage |
|---|---|---|---|
| A | 7298 | 97 | 1.329131% |
| B | 7298 | 171 | 2.343108% |
| C | 7298 | 165 | 2.260893% |
| D | 7298 | 257 | 3.521513% |
Noise dominated data is calculated using 1-second bins in cleaned event files. If a bin has >2000 counts, and if more than 50% of those come from <1% of pixels, then it is considered to be noise-dominated and hence unusable.
| Quadrant | # 1 sec bins | Bins with >0 counts | Bins with >2000 counts | High rate bins dominated by noise | Noise dominated (total time) | Noise dominated (detector-on time) | Marked lightcurve |
|---|---|---|---|---|---|---|---|
| A | 7627 | 7298 | 26 | 26 | 0.34% | 0.36% | 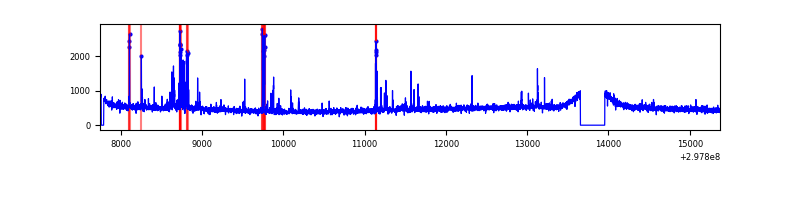 |
| B | 7627 | 7297 | 13 | 13 | 0.17% | 0.18% | 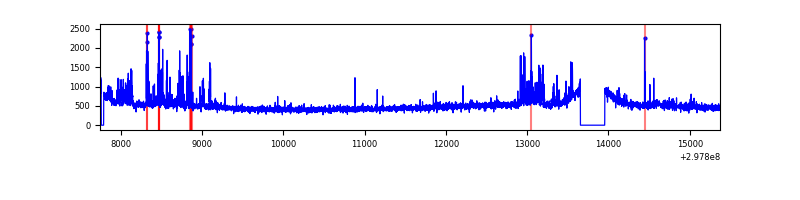 |
| C | 7627 | 7297 | 2 | 2 | 0.03% | 0.03% | 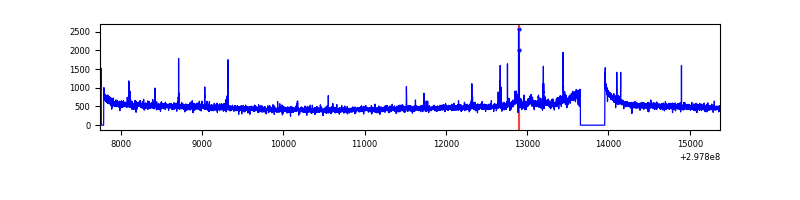 |
| D | 7627 | 7297 | 199 | 199 | 2.61% | 2.73% | 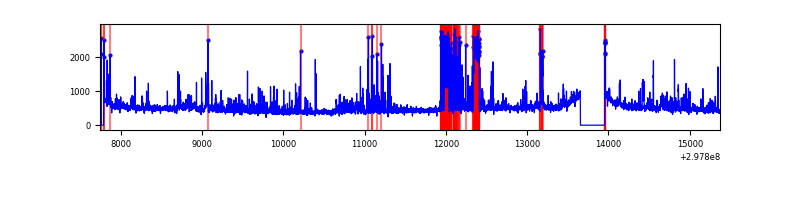 |
Top three noisy pixels from each quadrant. If the there are fewer than three noisy pixels in the level2.evt file, extra rows are filled as -1
| Pixel properties | Quadrant properties | ||||||
|---|---|---|---|---|---|---|---|
| Quadrant | DetID | PixID | Counts | Sigma | Mean | Median | Sigma |
| A | 14 | 238 | 185793 | 1005.8 | 904 | 885 | 183.8 |
| A | 14 | 254 | 39532 | 210.22 | 904 | 885 | 183.8 |
| A | 13 | 252 | 8638 | 42.17 | 904 | 885 | 183.8 |
| B | 7 | 220 | 167973 | 959.77 | 903 | 879 | 174.1 |
| B | 0 | 197 | 87868 | 499.66 | 903 | 879 | 174.1 |
| B | 0 | 245 | 29601 | 164.98 | 903 | 879 | 174.1 |
| C | 14 | 238 | 135399 | 652.45 | 871 | 874 | 206.2 |
| C | 3 | 233 | 121499 | 585.03 | 871 | 874 | 206.2 |
| C | 0 | 207 | 40135 | 190.42 | 871 | 874 | 206.2 |
| D | 1 | 52 | 802963 | 3755.4 | 877 | 849 | 213.6 |
| D | 7 | 96 | 91607 | 424.92 | 877 | 849 | 213.6 |
| D | 2 | 234 | 30712 | 139.81 | 877 | 849 | 213.6 |
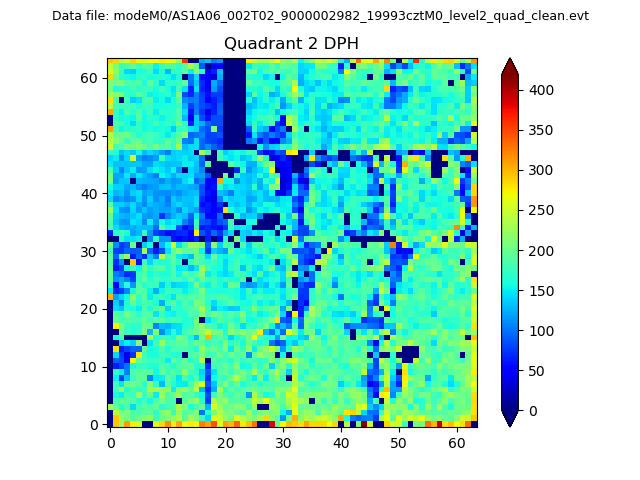
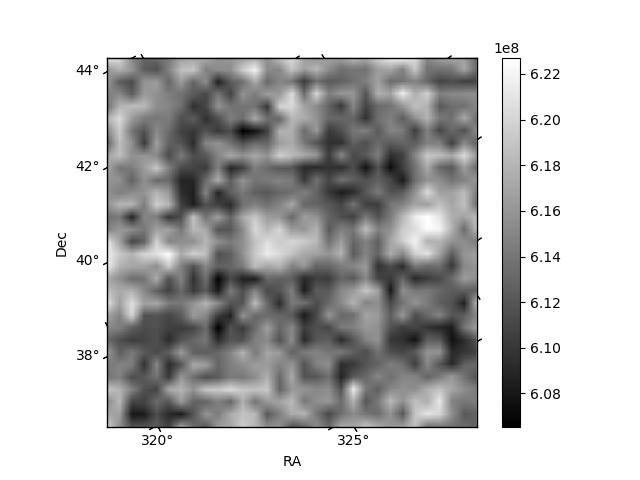
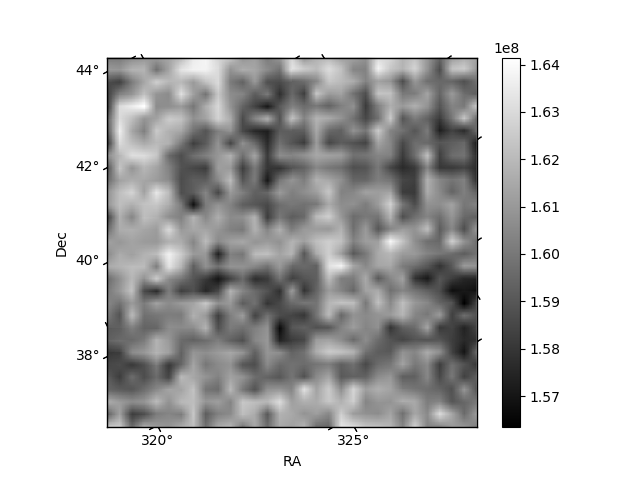
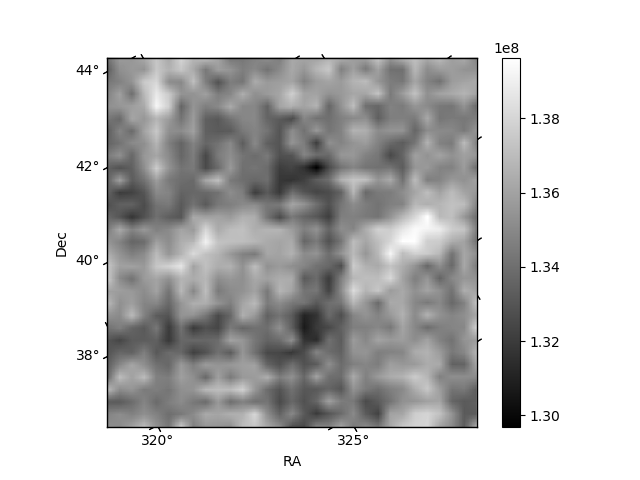
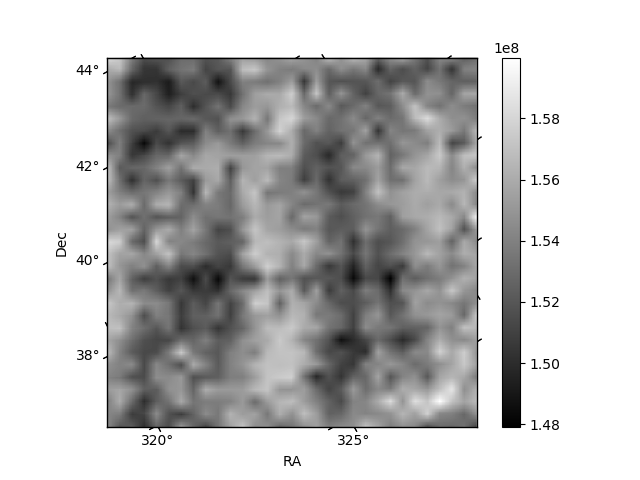
Histogram calculated using DETX and DETY for each event in the final _common_clean file
| Quadrant A | 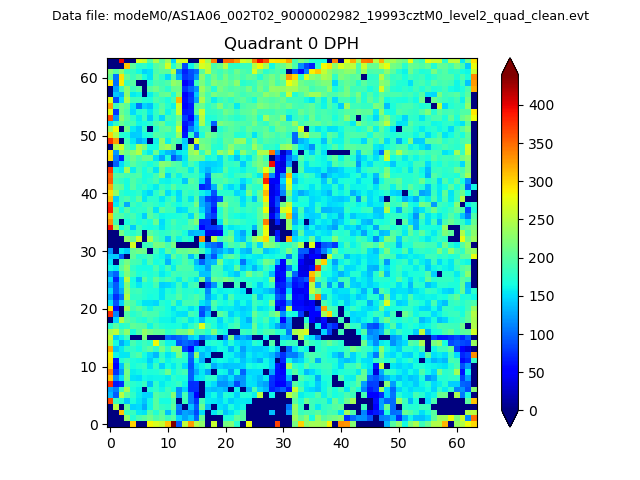 |
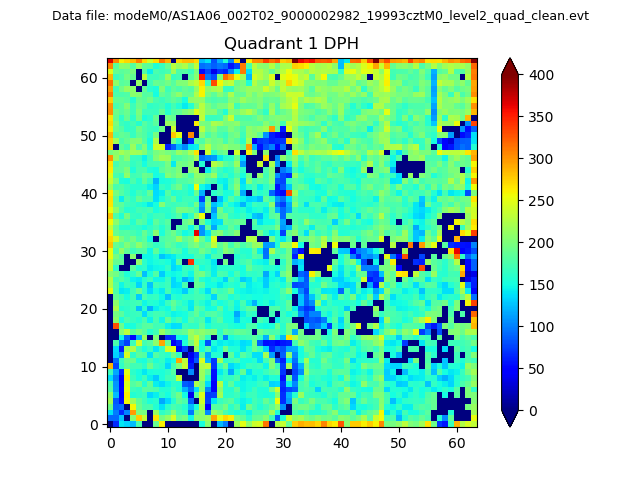 |
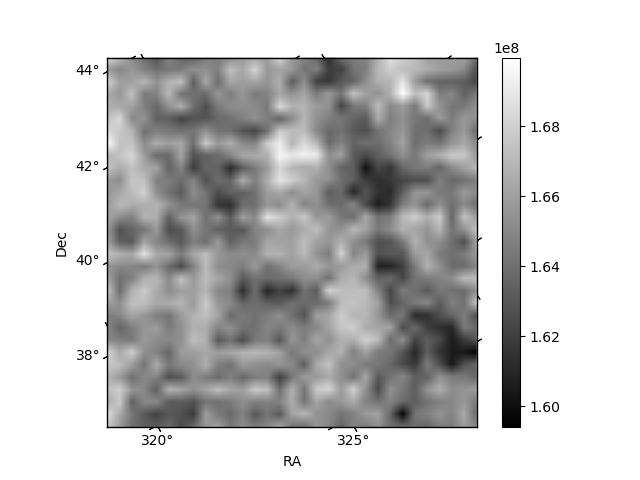
Quadrant B |
|---|---|---|---|
| Quadrant D | 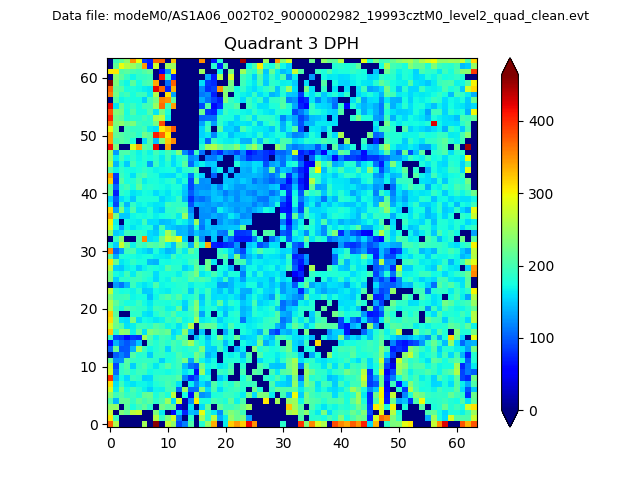 |
 |
Quadrant C |
| Plot type | Count rate plots | Images |
|---|---|---|
| Comparison with Poisson distribution Blue bars denote a histogram of data divided into 1 sec bins. Red curve is a Poisson curve with rate = median count rate of data. |
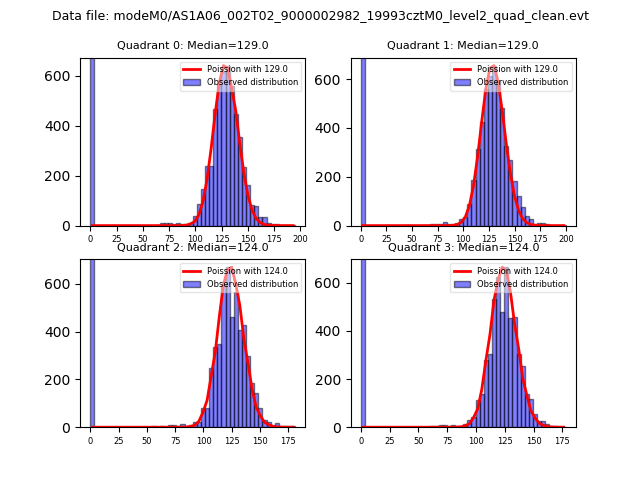 |
 |
| Quadrant-wise count rates Data is divided into 100 sec bins |
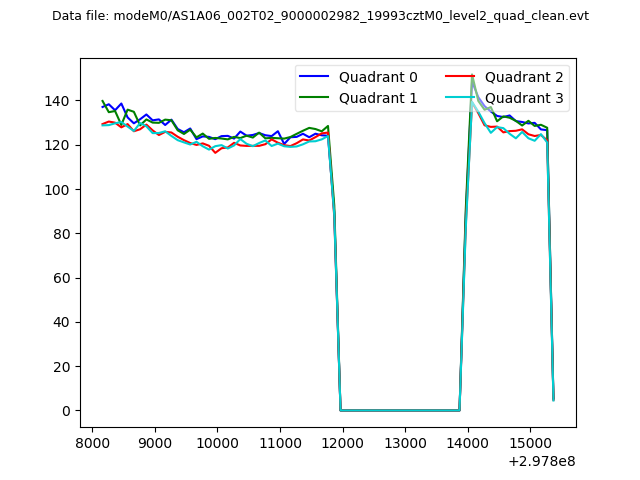 |
|
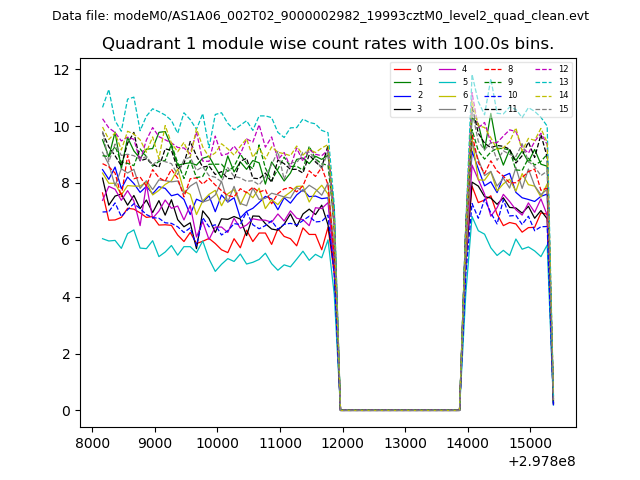
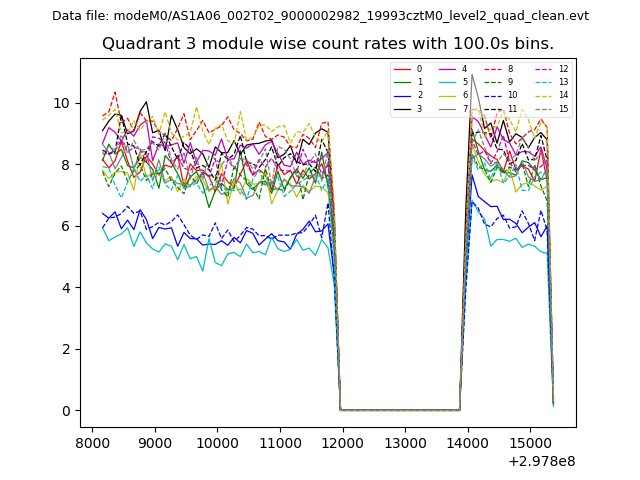
| Module-wise count rates for Quadrant A Data is divided into 100 sec bins |
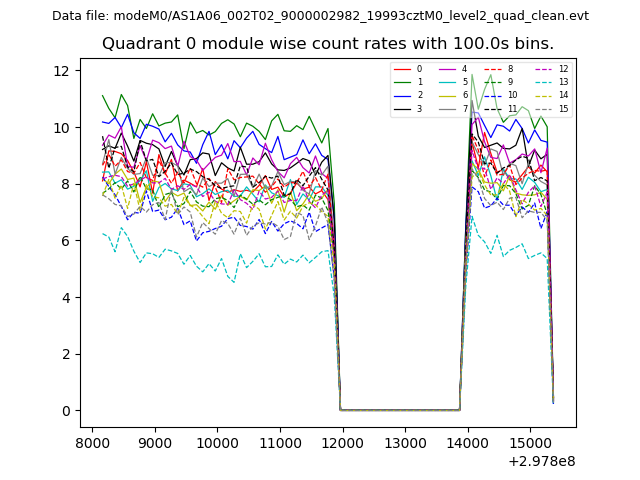 |
 |
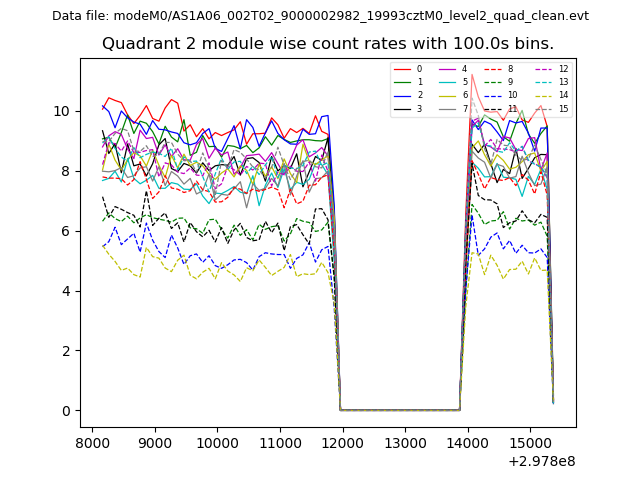
| Module-wise count rates for Quadrant B Data is divided into 100 sec bins |
 |
 |
| Module-wise count rates for Quadrant C Data is divided into 100 sec bins |
 |
 |
| Module-wise count rates for Quadrant D Data is divided into 100 sec bins |
 |
 |
| Parameter | Plot |
|---|---|
| CZT HV Monitor | 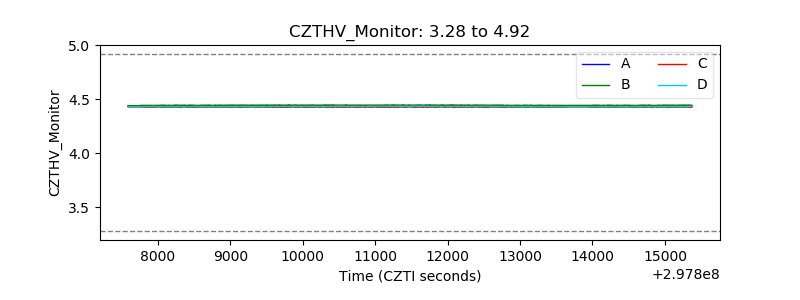 |
| D_VDD | 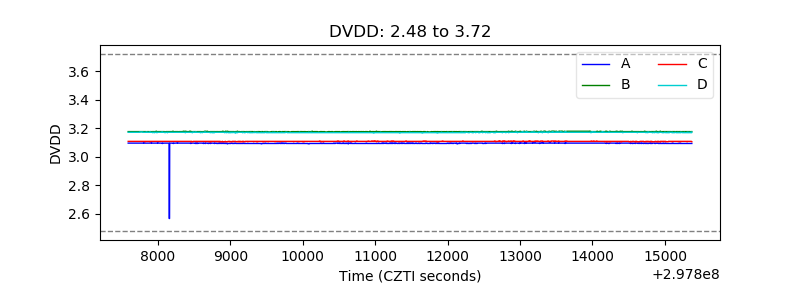 |
| Temperature 1 | 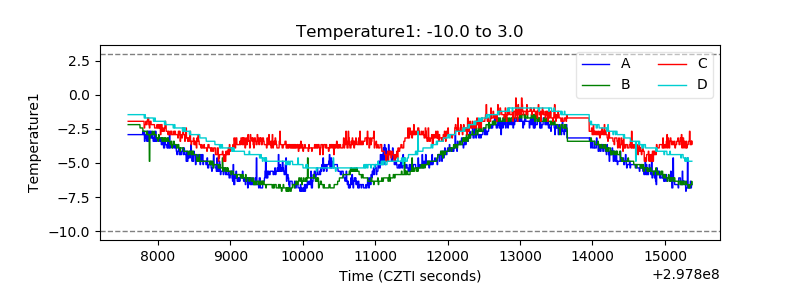 |
| Veto HV Monitor | 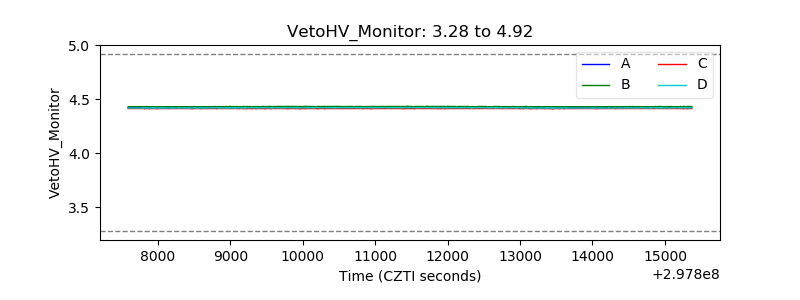 |
| Veto LLD | 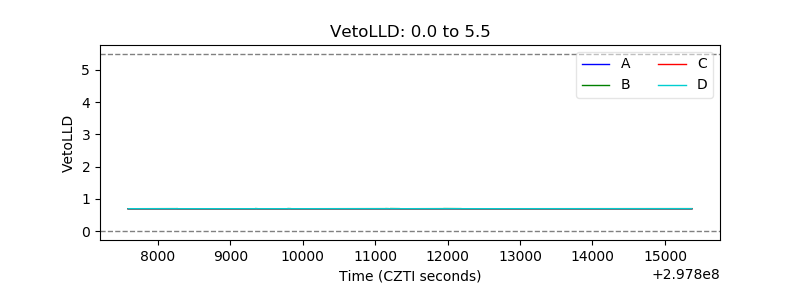 |
| Alpha Counter | 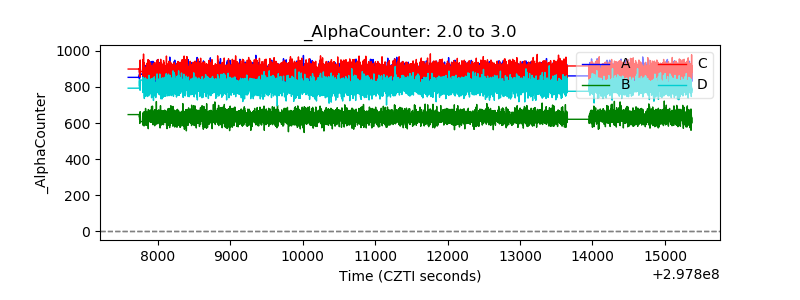 |
| _CPM_Rate | 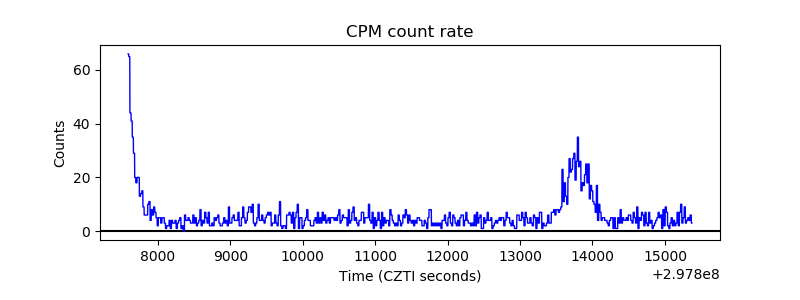 |
| CZT Counter | 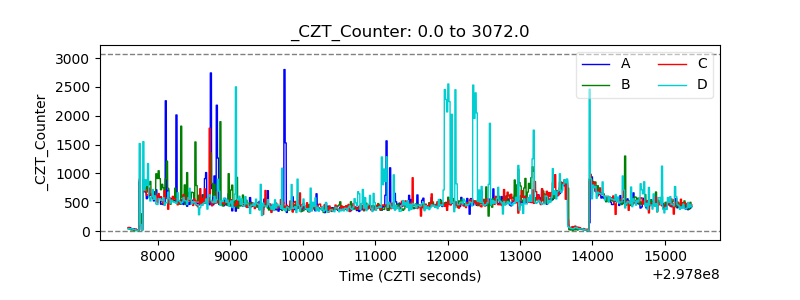 |
| +2.5 Volts monitor | 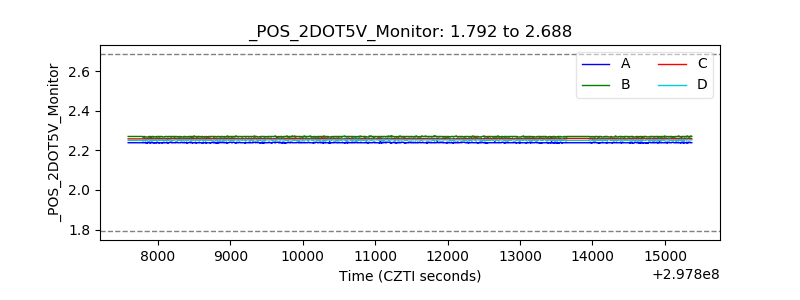 |
| +5 Volts monitor |  |
| _ROLL_ROT | 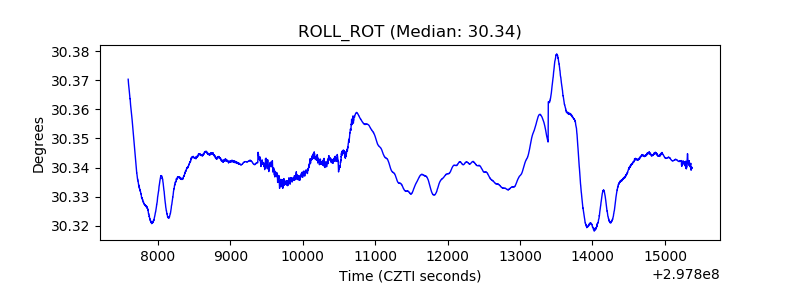 |
| _Roll_DEC | 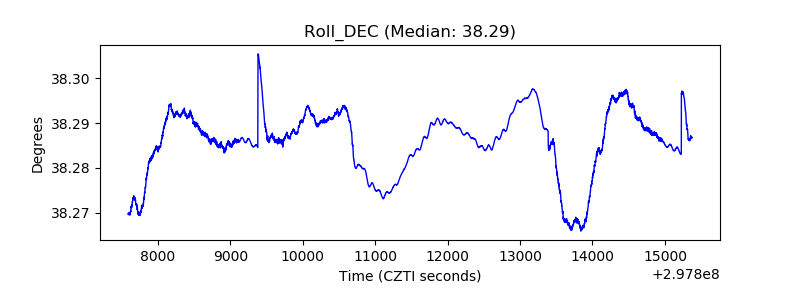 |
| _Roll_RA | 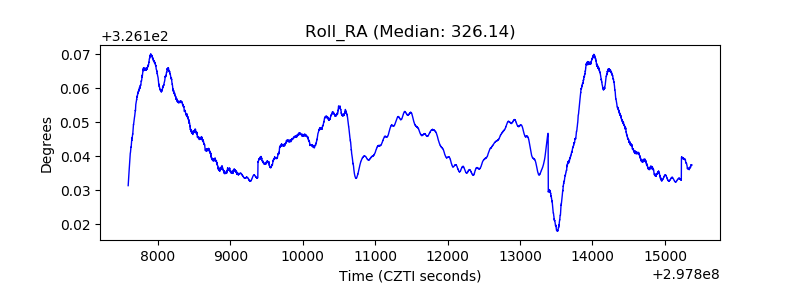 |
| Veto Counter | 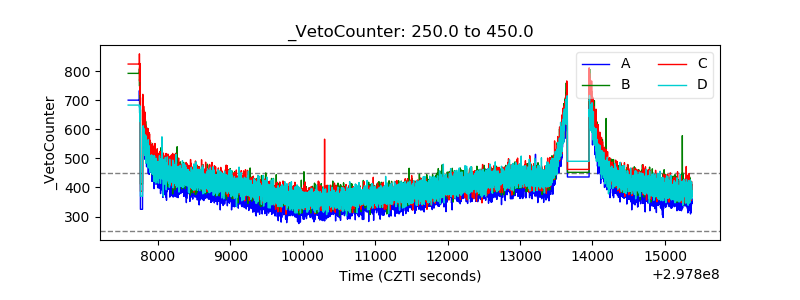 |