| Param | Original file | Final file |
|---|---|---|
| Filename | modeM0/AS1A06_002T02_9000002982_19994cztM0_level2.evt | modeM0/AS1A06_002T02_9000002982_19994cztM0_level2_quad_clean.evt |
| Size (bytes) | 518,333,760 | 108,365,760 |
| Size | 494.3 MB | 103.3 MB |
| Events in quadrant A | 3,627,739 | 699,778 |
| Events in quadrant B | 3,919,295 | 702,946 |
| Events in quadrant C | 3,794,814 | 675,842 |
| Events in quadrant D | 3,839,527 | 674,408 |
| Mode M9 | |||
|---|---|---|---|
| Quadrant | BADHDUFLAG | Total packets | Discarded packets |
| A | 0 | 2 | 0 |
| B | 0 | 2 | 0 |
| C | 0 | 2 | 0 |
| D | 0 | 2 | 0 |
| Mode SS | |||
|---|---|---|---|
| Quadrant | BADHDUFLAG | Total packets | Discarded packets |
| A | 0 | 154 | 0 |
| B | 0 | 154 | 0 |
| C | 0 | 154 | 0 |
| D | 0 | 154 | 0 |
| Mode M0 | |||
|---|---|---|---|
| Quadrant | BADHDUFLAG | Total packets | Discarded packets |
| A | 0 | 15907 | 2 |
| B | 0 | 16839 | 2 |
| C | 0 | 16260 | 3 |
| D | 0 | 16787 | 2 |
| Quadrant | Total seconds | Saturated seconds | Saturation percentage |
|---|---|---|---|
| A | 7603 | 62 | 0.815468% |
| B | 7604 | 174 | 2.288269% |
| C | 7603 | 169 | 2.222807% |
| D | 7603 | 58 | 0.762857% |
Noise dominated data is calculated using 1-second bins in cleaned event files. If a bin has >2000 counts, and if more than 50% of those come from <1% of pixels, then it is considered to be noise-dominated and hence unusable.
| Quadrant | # 1 sec bins | Bins with >0 counts | Bins with >2000 counts | High rate bins dominated by noise | Noise dominated (total time) | Noise dominated (detector-on time) | Marked lightcurve |
|---|---|---|---|---|---|---|---|
| A | 7832 | 7602 | 0 | 0 | 0.00% | 0.00% | 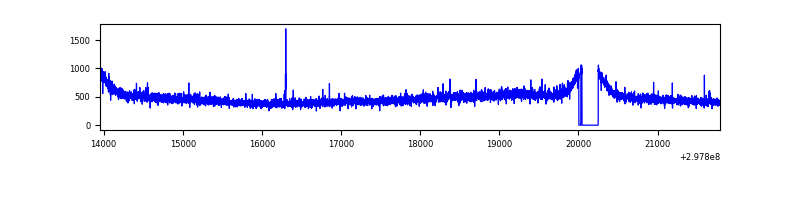 |
| B | 7833 | 7603 | 16 | 16 | 0.20% | 0.21% | 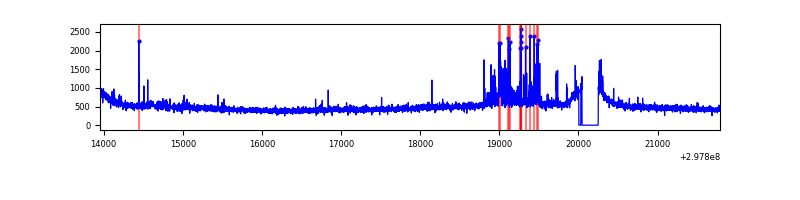 |
| C | 7832 | 7602 | 0 | 0 | 0.00% | 0.00% |  |
| D | 7832 | 7602 | 22 | 22 | 0.28% | 0.29% | 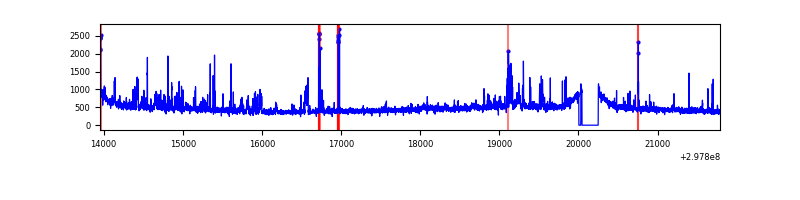 |
Top three noisy pixels from each quadrant. If the there are fewer than three noisy pixels in the level2.evt file, extra rows are filled as -1
| Pixel properties | Quadrant properties | ||||||
|---|---|---|---|---|---|---|---|
| Quadrant | DetID | PixID | Counts | Sigma | Mean | Median | Sigma |
| A | 14 | 238 | 14536 | 71.54 | 935 | 917 | 190.4 |
| A | 0 | 226 | 8191 | 38.21 | 935 | 917 | 190.4 |
| A | 13 | 254 | 8055 | 37.5 | 935 | 917 | 190.4 |
| B | 7 | 220 | 163322 | 911.91 | 930 | 908 | 178.1 |
| B | 0 | 190 | 29790 | 162.16 | 930 | 908 | 178.1 |
| B | 12 | 111 | 21750 | 117.02 | 930 | 908 | 178.1 |
| C | 14 | 238 | 139219 | 648.95 | 899 | 906 | 213.1 |
| C | 3 | 233 | 127903 | 595.86 | 899 | 906 | 213.1 |
| C | 0 | 207 | 9205 | 38.94 | 899 | 906 | 213.1 |
| D | 1 | 52 | 282740 | 1278.0 | 910 | 884 | 220.5 |
| D | 2 | 234 | 36235 | 160.29 | 910 | 884 | 220.5 |
| D | 14 | 50 | 32692 | 144.23 | 910 | 884 | 220.5 |
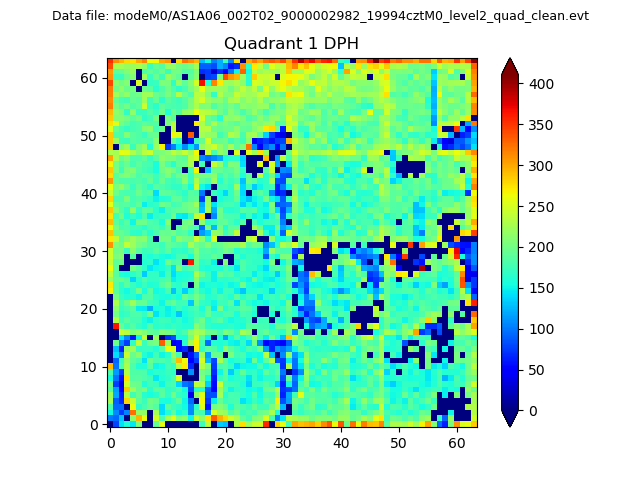
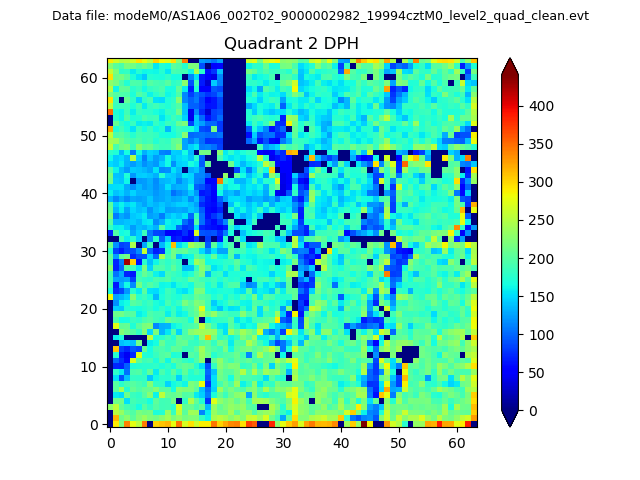
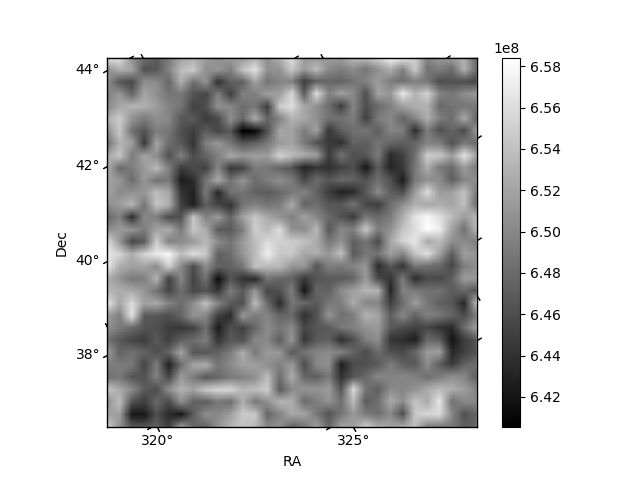
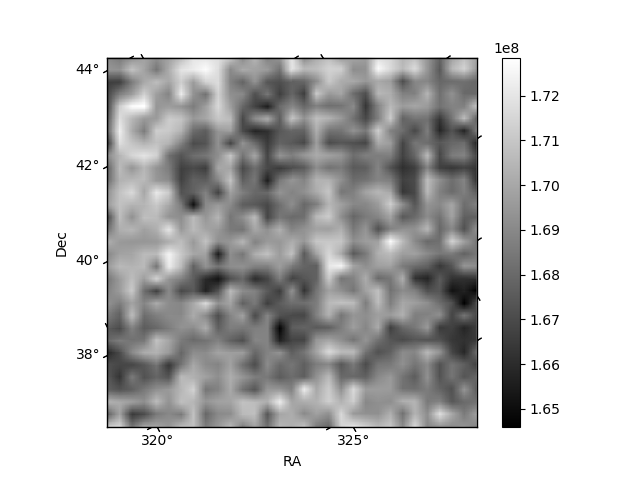
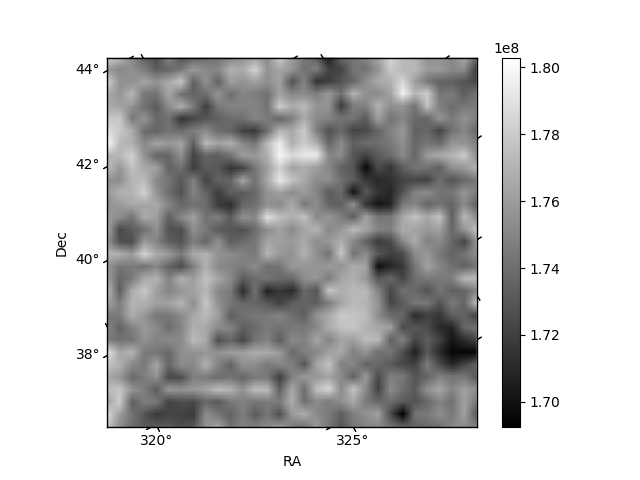
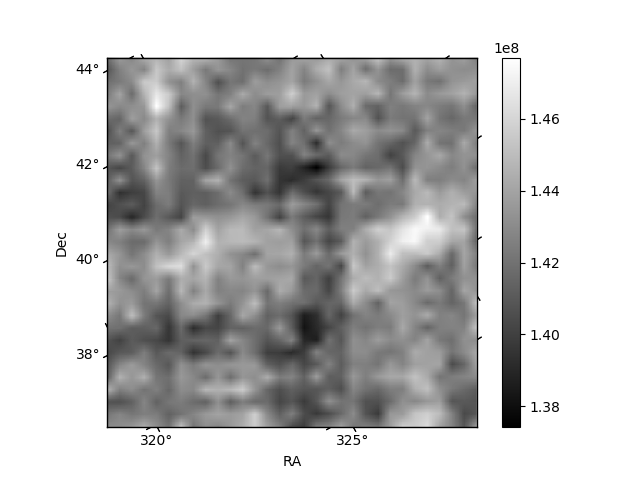
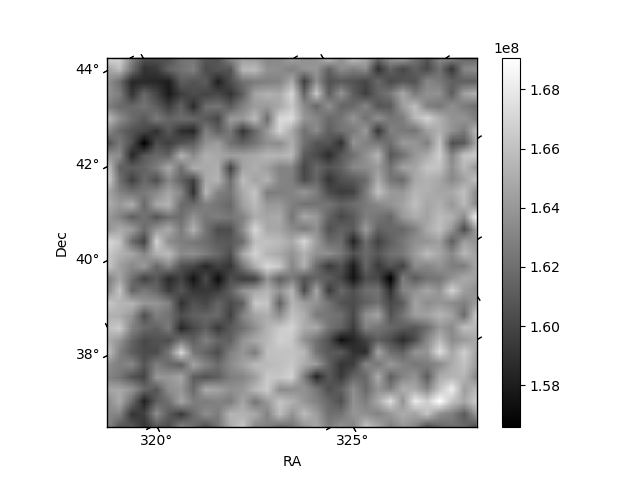
Histogram calculated using DETX and DETY for each event in the final _common_clean file
| Quadrant A | 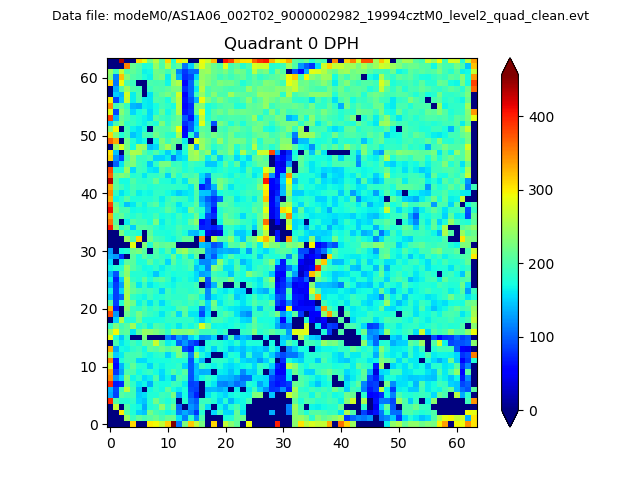 |
 |
Quadrant B |
|---|---|---|---|
| Quadrant D | 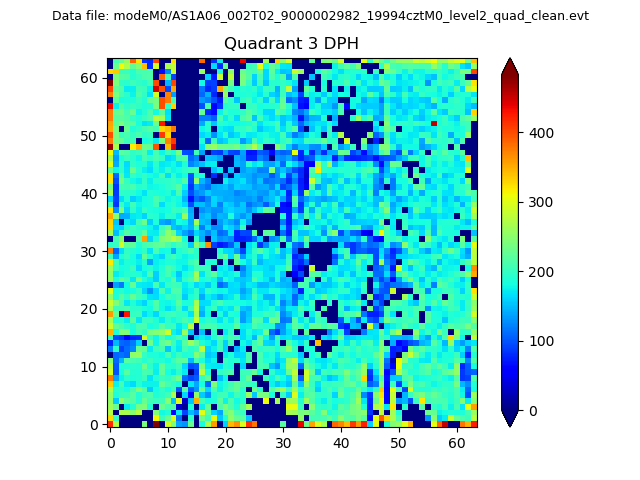 |
 |
Quadrant C |
| Plot type | Count rate plots | Images |
|---|---|---|
| Comparison with Poisson distribution Blue bars denote a histogram of data divided into 1 sec bins. Red curve is a Poisson curve with rate = median count rate of data. |
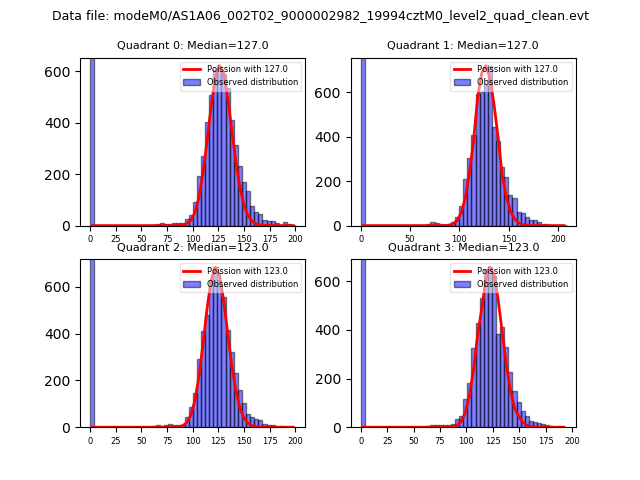 |
 |
| Quadrant-wise count rates Data is divided into 100 sec bins |
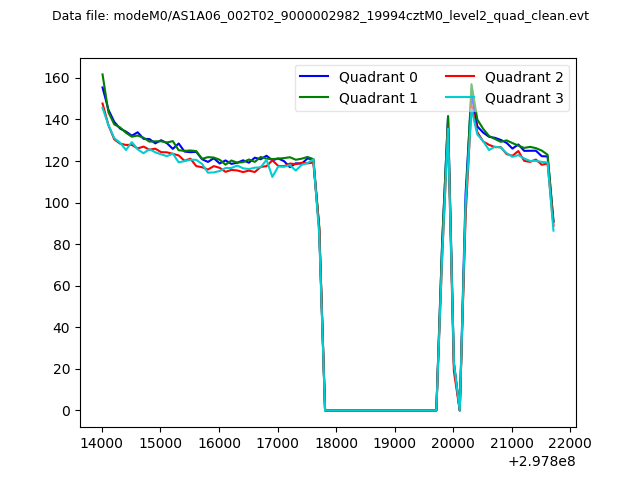 |
|
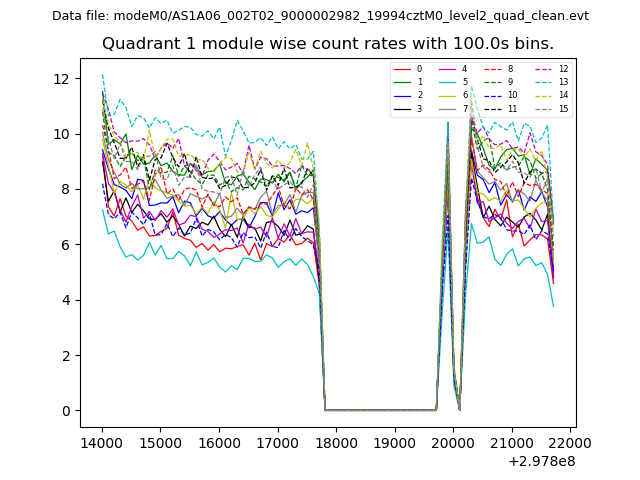
| Module-wise count rates for Quadrant A Data is divided into 100 sec bins |
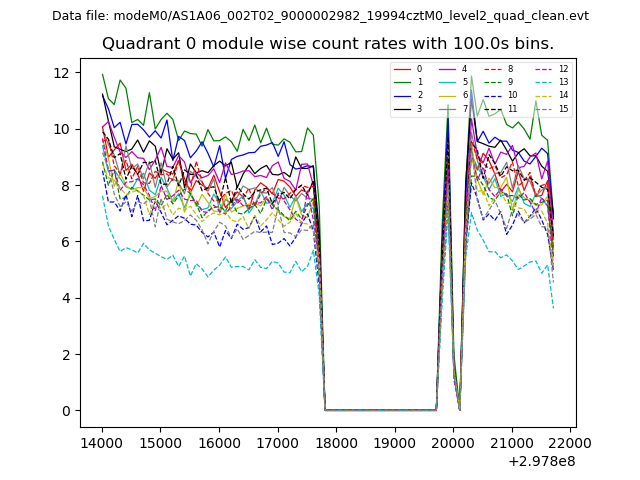 |
 |
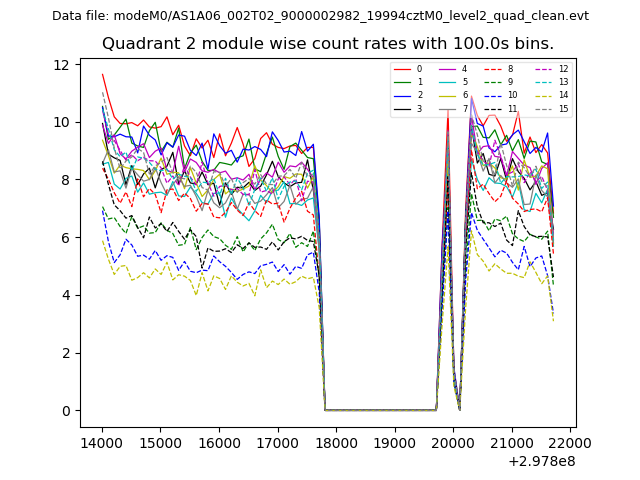
| Module-wise count rates for Quadrant B Data is divided into 100 sec bins |
 |
 |
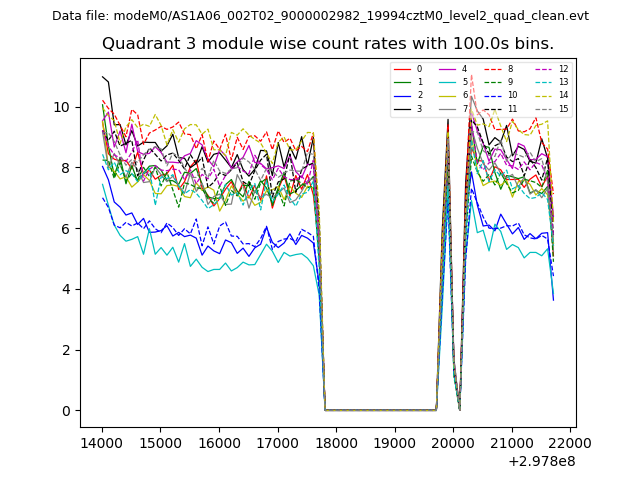
| Module-wise count rates for Quadrant C Data is divided into 100 sec bins |
 |
 |
| Module-wise count rates for Quadrant D Data is divided into 100 sec bins |
 |
 |
| Parameter | Plot |
|---|---|
| CZT HV Monitor | 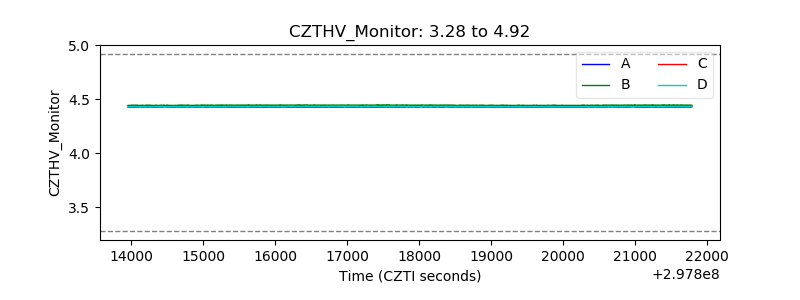 |
| D_VDD | 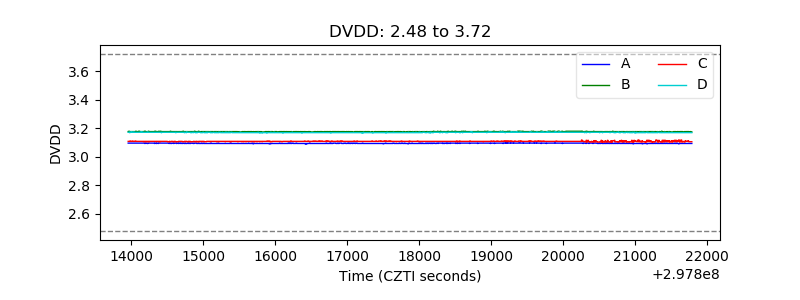 |
| Temperature 1 | 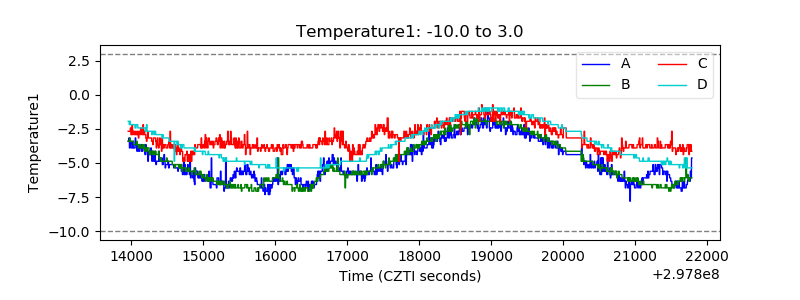 |
| Veto HV Monitor | 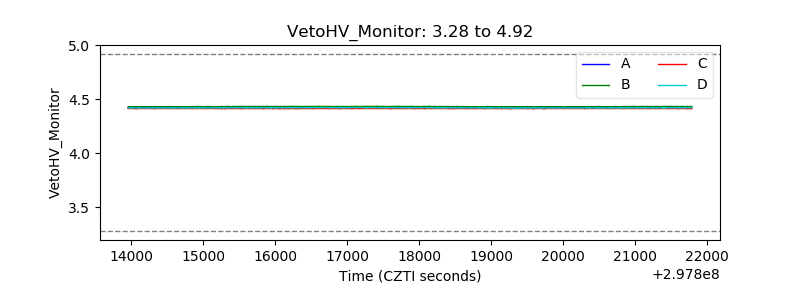 |
| Veto LLD | 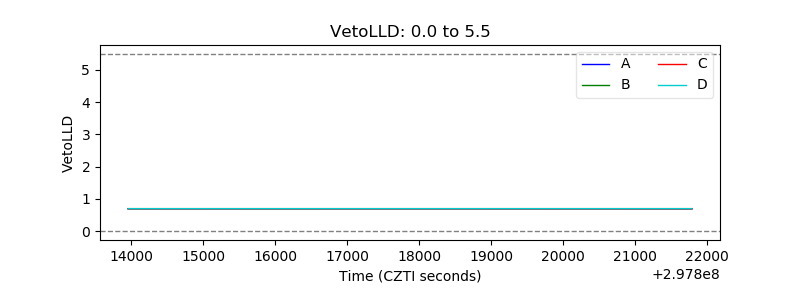 |
| Alpha Counter | 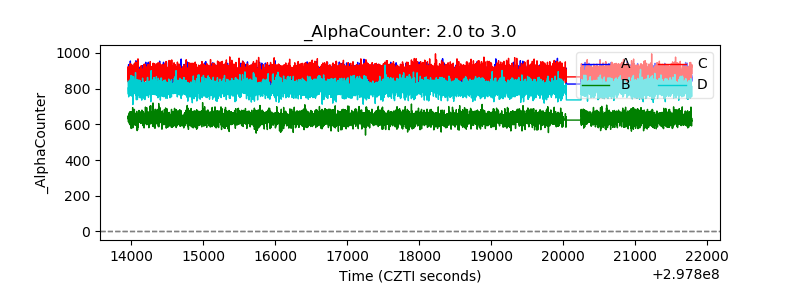 |
| _CPM_Rate | 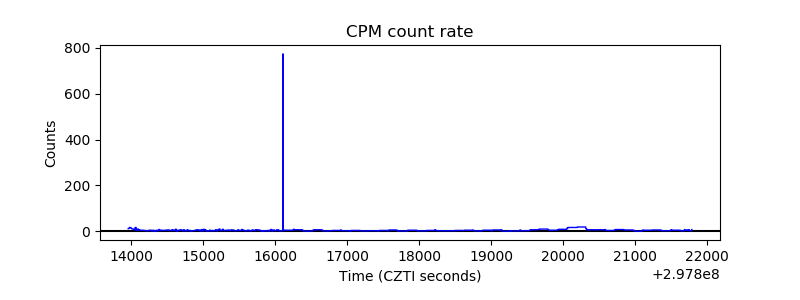 |
| CZT Counter | 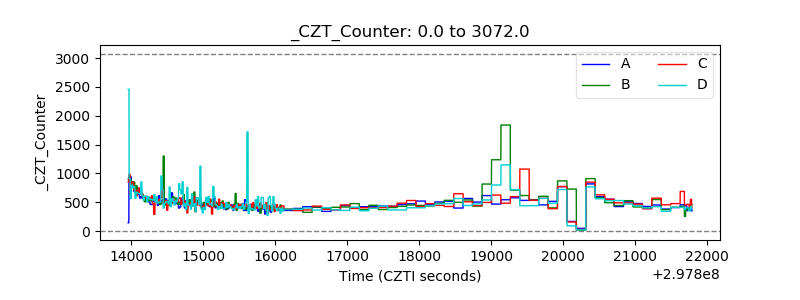 |
| +2.5 Volts monitor |  |
| +5 Volts monitor | 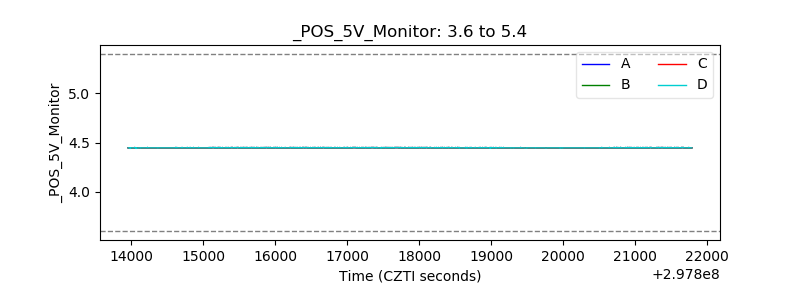 |
| _ROLL_ROT | 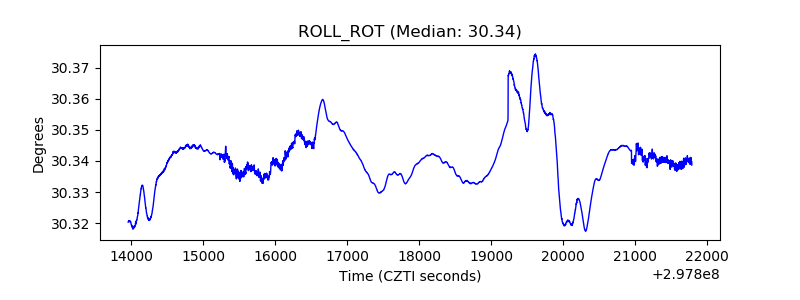 |
| _Roll_DEC | 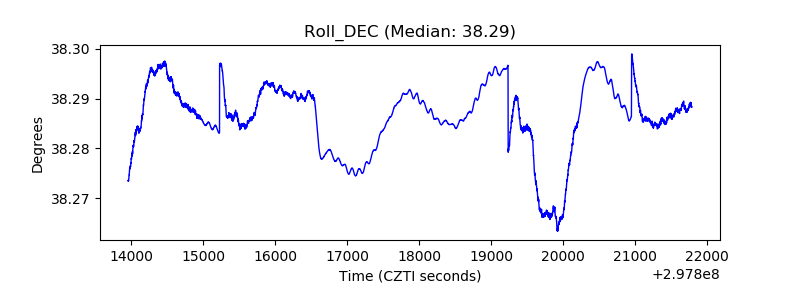 |
| _Roll_RA | 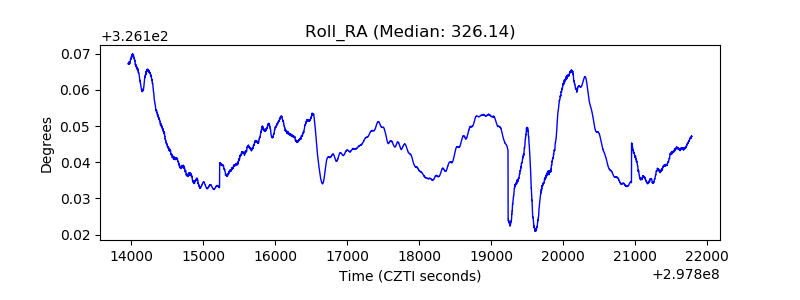 |
| Veto Counter | 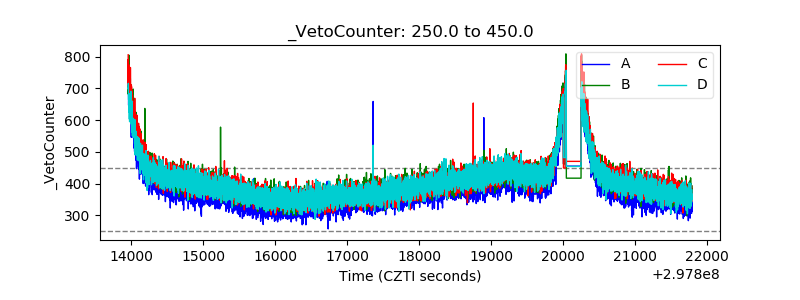 |