| Param | Original file | Final file |
|---|---|---|
| Filename | modeM0/AS1A06_002T02_9000002982_19995cztM0_level2.evt | modeM0/AS1A06_002T02_9000002982_19995cztM0_level2_quad_clean.evt |
| Size (bytes) | 571,582,080 | 110,943,360 |
| Size | 545.1 MB | 105.8 MB |
| Events in quadrant A | 3,924,657 | 713,580 |
| Events in quadrant B | 4,168,353 | 716,906 |
| Events in quadrant C | 4,173,319 | 687,993 |
| Events in quadrant D | 4,489,797 | 673,883 |
| Mode M9 | |||
|---|---|---|---|
| Quadrant | BADHDUFLAG | Total packets | Discarded packets |
| A | 0 | 6 | 0 |
| B | 0 | 6 | 0 |
| C | 0 | 6 | 0 |
| D | 0 | 6 | 0 |
| Mode SS | |||
|---|---|---|---|
| Quadrant | BADHDUFLAG | Total packets | Discarded packets |
| A | 0 | 166 | 0 |
| B | 0 | 166 | 0 |
| C | 0 | 168 | 0 |
| D | 0 | 168 | 0 |
| Mode M0 | |||
|---|---|---|---|
| Quadrant | BADHDUFLAG | Total packets | Discarded packets |
| A | 0 | 17159 | 2 |
| B | 0 | 17949 | 2 |
| C | 0 | 17677 | 2 |
| D | 0 | 19246 | 2 |
| Quadrant | Total seconds | Saturated seconds | Saturation percentage |
|---|---|---|---|
| A | 8165 | 74 | 0.906307% |
| B | 8165 | 176 | 2.155542% |
| C | 8166 | 188 | 2.302229% |
| D | 8166 | 289 | 3.539064% |
Noise dominated data is calculated using 1-second bins in cleaned event files. If a bin has >2000 counts, and if more than 50% of those come from <1% of pixels, then it is considered to be noise-dominated and hence unusable.
| Quadrant | # 1 sec bins | Bins with >0 counts | Bins with >2000 counts | High rate bins dominated by noise | Noise dominated (total time) | Noise dominated (detector-on time) | Marked lightcurve |
|---|---|---|---|---|---|---|---|
| A | 8774 | 8164 | 1 | 1 | 0.01% | 0.01% | 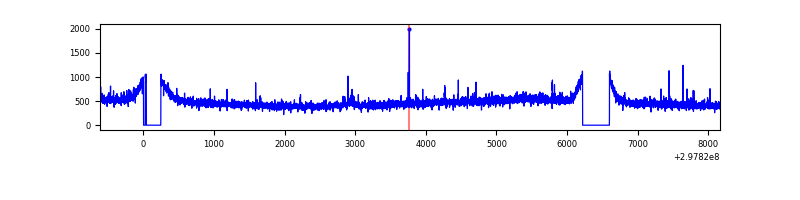 |
| B | 8775 | 8165 | 10 | 10 | 0.11% | 0.12% | 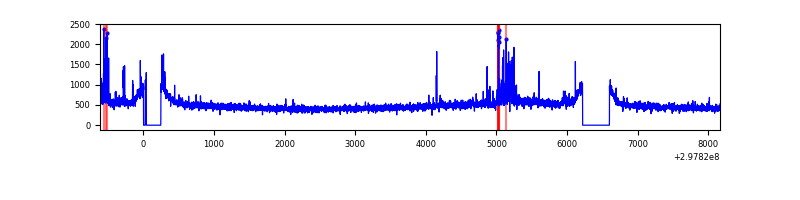 |
| C | 8775 | 8165 | 0 | 0 | 0.00% | 0.00% | 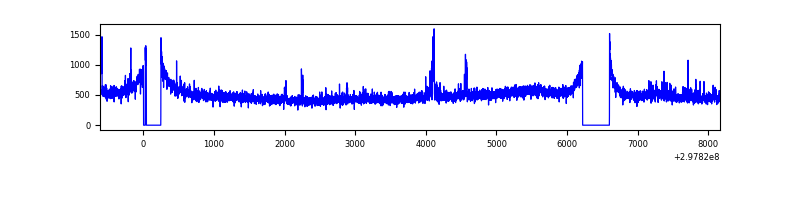 |
| D | 8776 | 8167 | 235 | 235 | 2.68% | 2.88% | 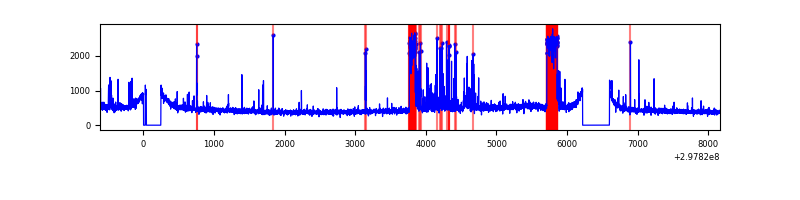 |
Top three noisy pixels from each quadrant. If the there are fewer than three noisy pixels in the level2.evt file, extra rows are filled as -1
| Pixel properties | Quadrant properties | ||||||
|---|---|---|---|---|---|---|---|
| Quadrant | DetID | PixID | Counts | Sigma | Mean | Median | Sigma |
| A | 13 | 252 | 20646 | 97.22 | 1001 | 982 | 202.3 |
| A | 14 | 238 | 14728 | 67.96 | 1001 | 982 | 202.3 |
| A | 14 | 254 | 11688 | 52.93 | 1001 | 982 | 202.3 |
| B | 7 | 220 | 117849 | 605.67 | 998 | 974 | 193.0 |
| B | 15 | 33 | 35092 | 176.81 | 998 | 974 | 193.0 |
| B | 12 | 111 | 23675 | 117.64 | 998 | 974 | 193.0 |
| C | 3 | 233 | 219271 | 964.17 | 961 | 965 | 226.4 |
| C | 14 | 238 | 150234 | 659.26 | 961 | 965 | 226.4 |
| C | 0 | 207 | 17985 | 75.17 | 961 | 965 | 226.4 |
| D | 1 | 52 | 795296 | 3364.97 | 961 | 932 | 236.1 |
| D | 2 | 234 | 37260 | 153.89 | 961 | 932 | 236.1 |
| D | 2 | 120 | 35704 | 147.3 | 961 | 932 | 236.1 |
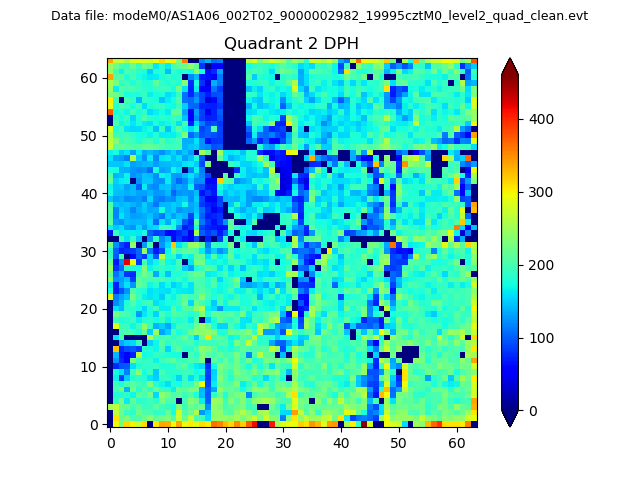
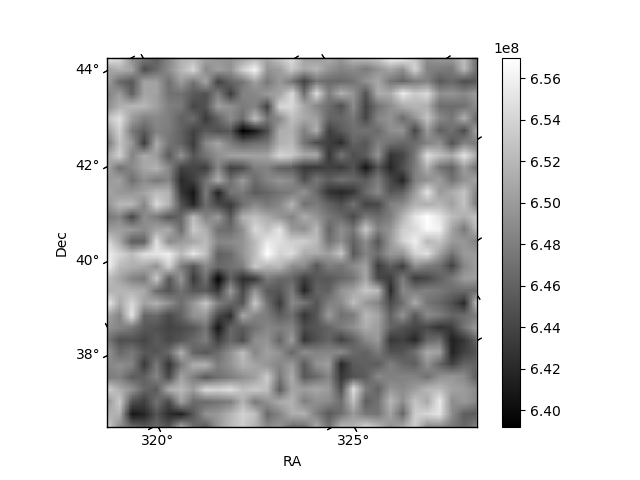
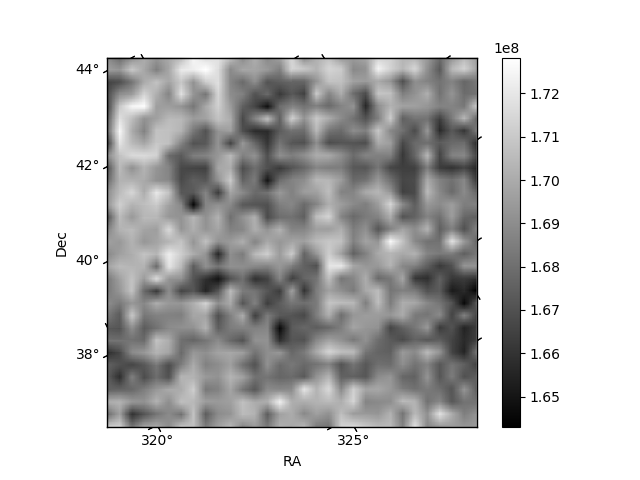
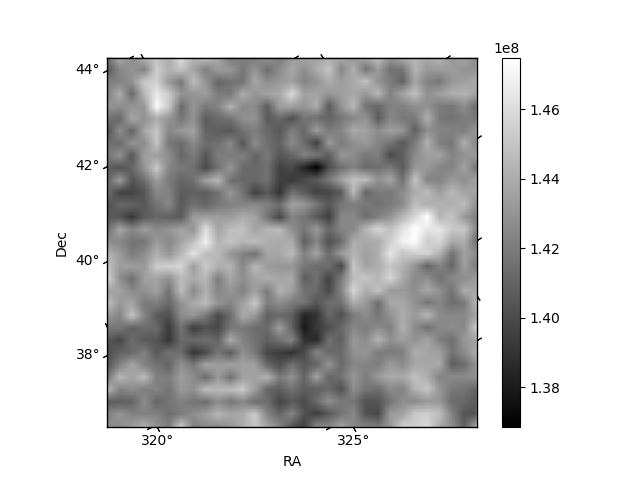
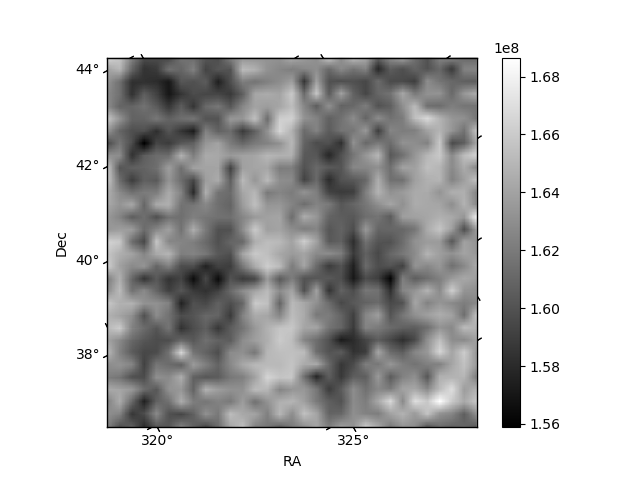
Histogram calculated using DETX and DETY for each event in the final _common_clean file
| Quadrant A | 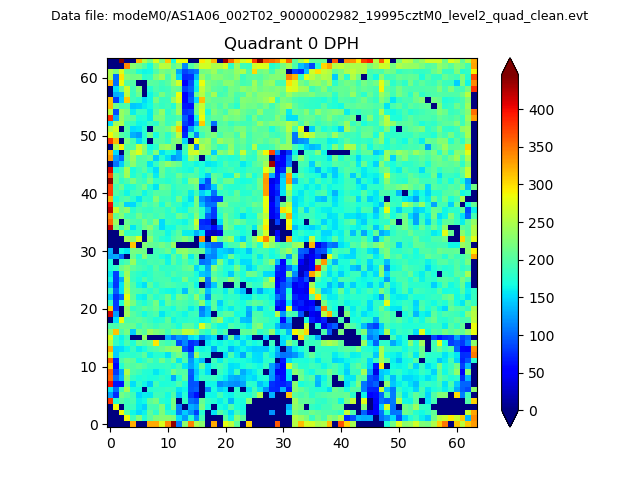 |
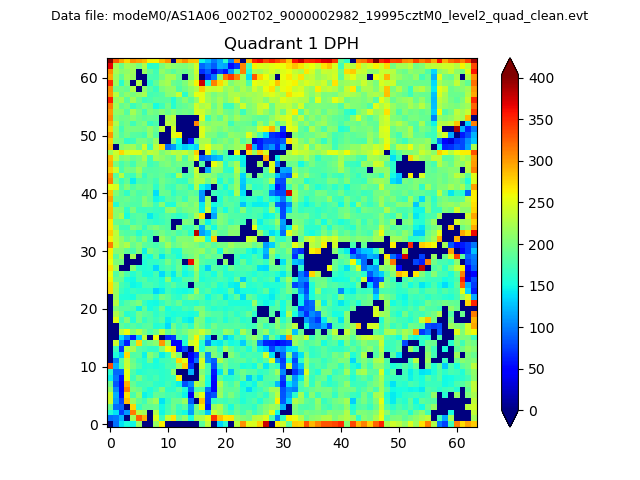 |
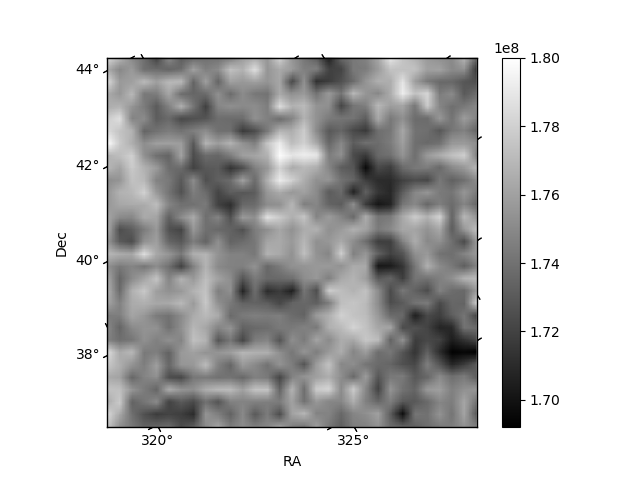
Quadrant B |
|---|---|---|---|
| Quadrant D | 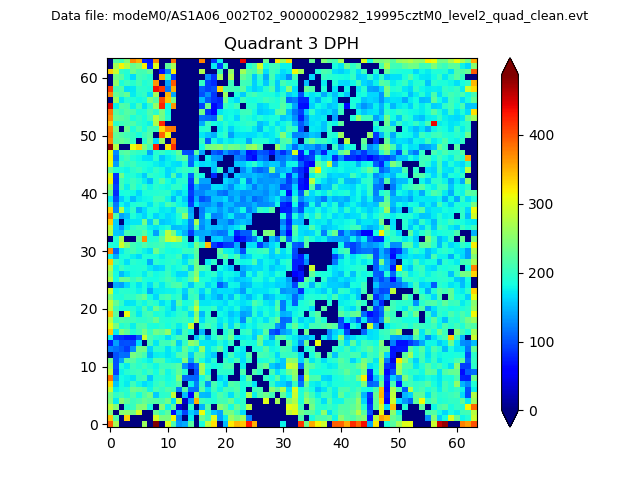 |
 |
Quadrant C |
| Plot type | Count rate plots | Images |
|---|---|---|
| Comparison with Poisson distribution Blue bars denote a histogram of data divided into 1 sec bins. Red curve is a Poisson curve with rate = median count rate of data. |
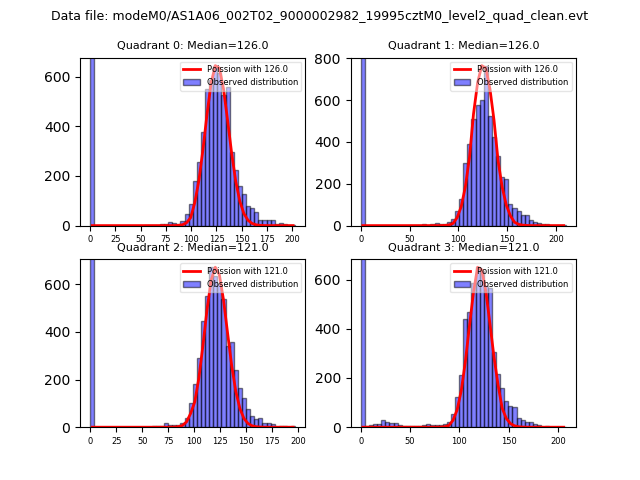 |
 |
| Quadrant-wise count rates Data is divided into 100 sec bins |
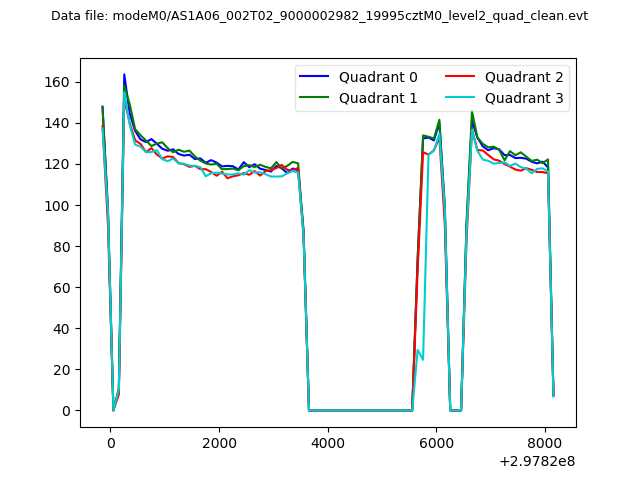 |
|
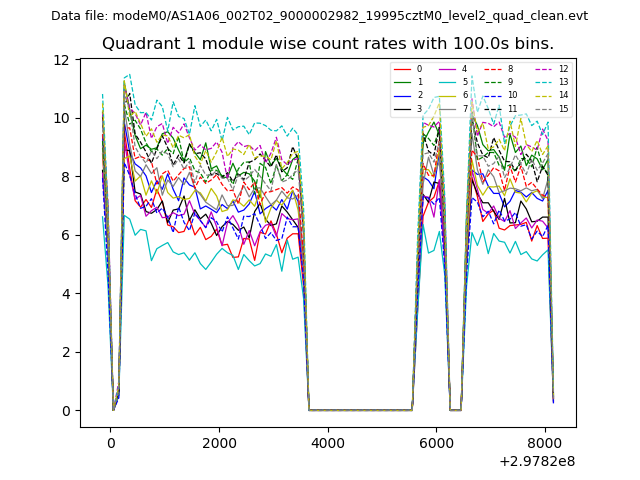
| Module-wise count rates for Quadrant A Data is divided into 100 sec bins |
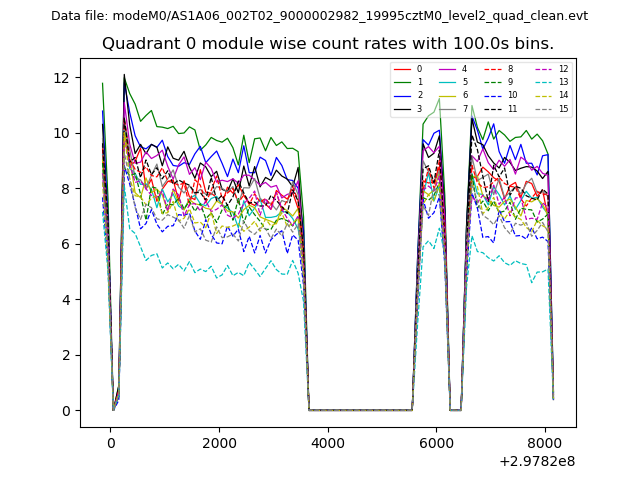 |
 |
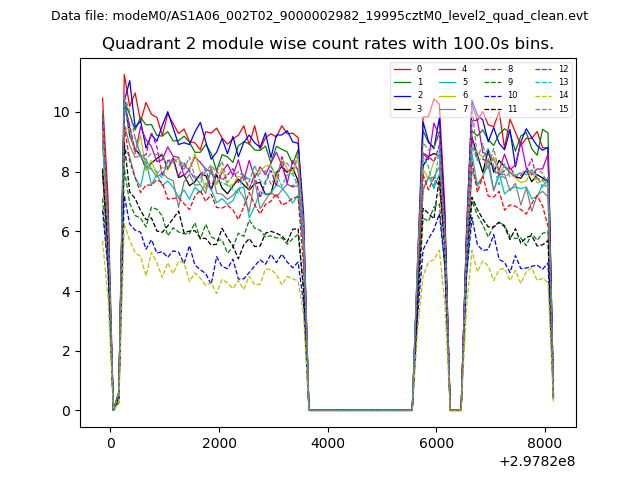
| Module-wise count rates for Quadrant B Data is divided into 100 sec bins |
 |
 |
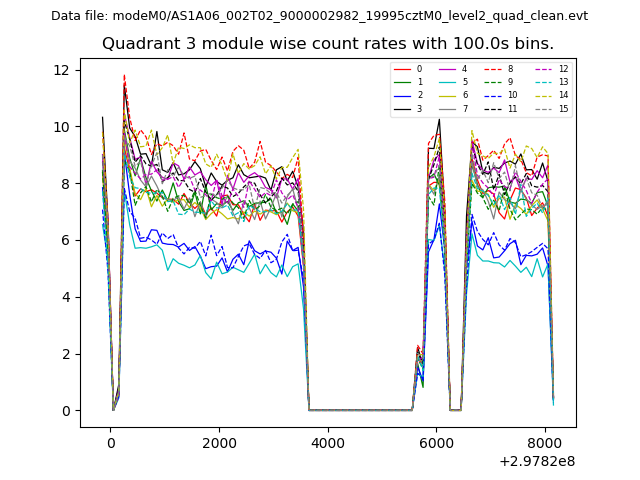
| Module-wise count rates for Quadrant C Data is divided into 100 sec bins |
 |
 |
| Module-wise count rates for Quadrant D Data is divided into 100 sec bins |
 |
 |
| Parameter | Plot |
|---|---|
| CZT HV Monitor | 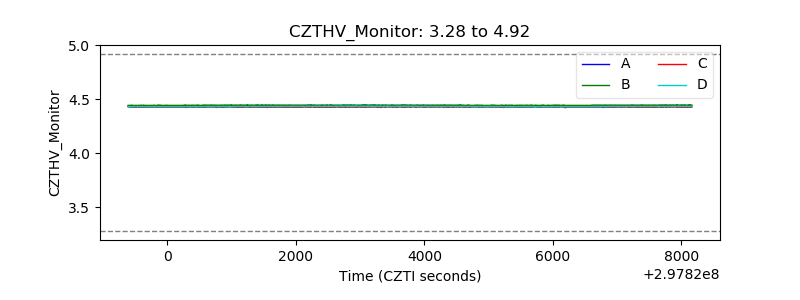 |
| D_VDD | 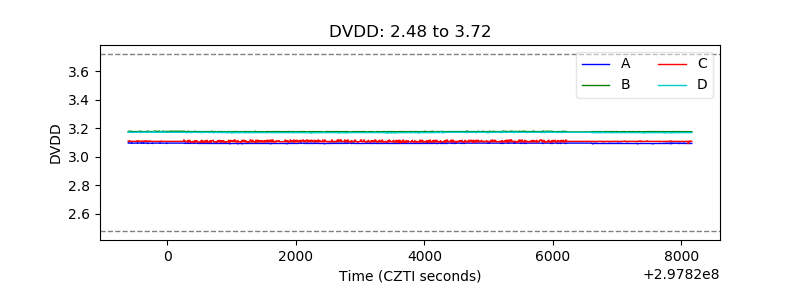 |
| Temperature 1 | 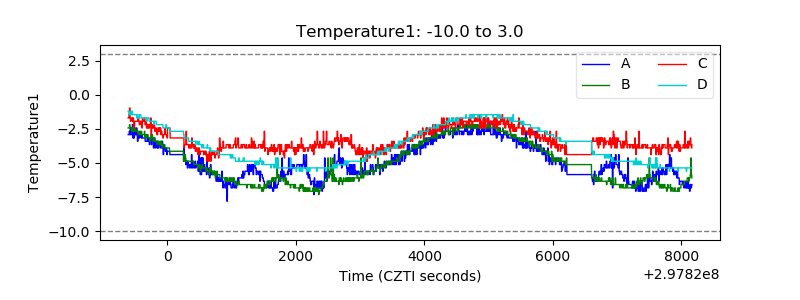 |
| Veto HV Monitor | 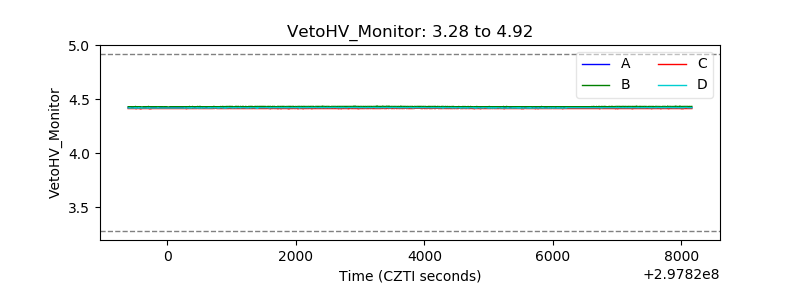 |
| Veto LLD | 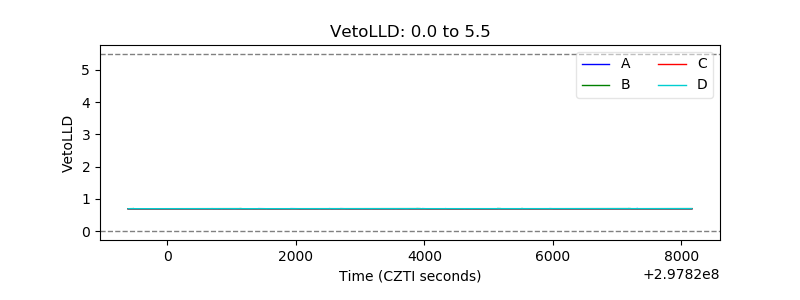 |
| Alpha Counter | 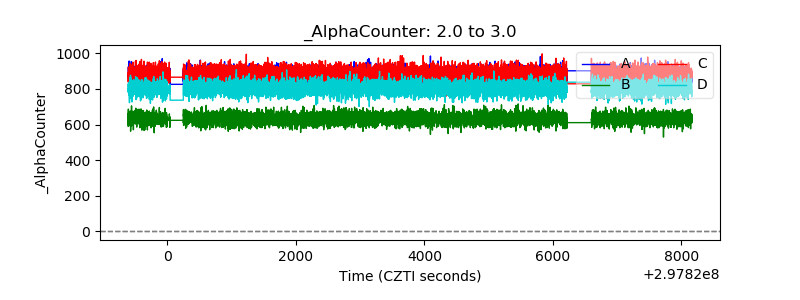 |
| _CPM_Rate | 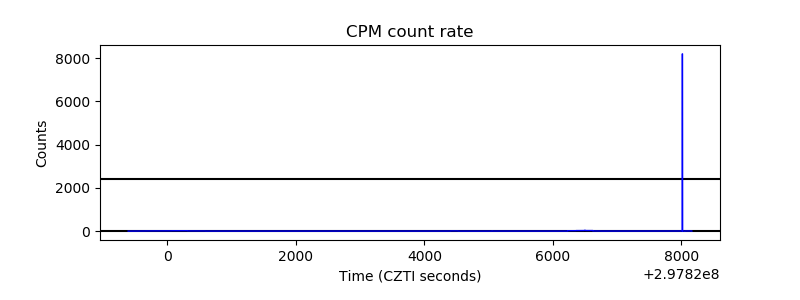 |
| CZT Counter | 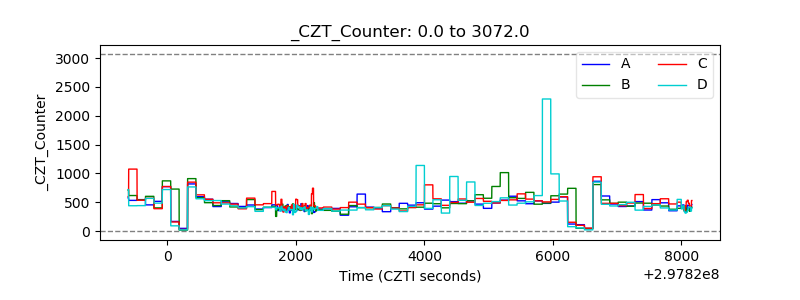 |
| +2.5 Volts monitor |  |
| +5 Volts monitor |  |
| _ROLL_ROT | 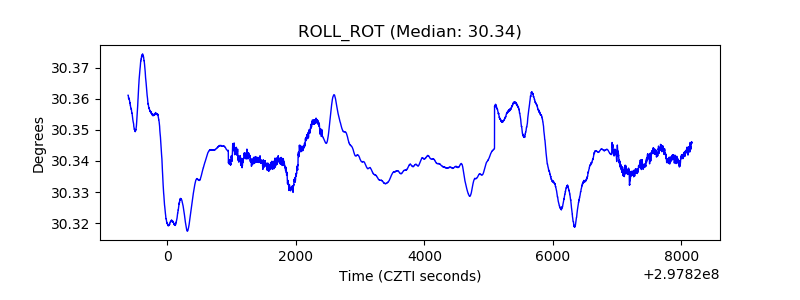 |
| _Roll_DEC |  |
| _Roll_RA | 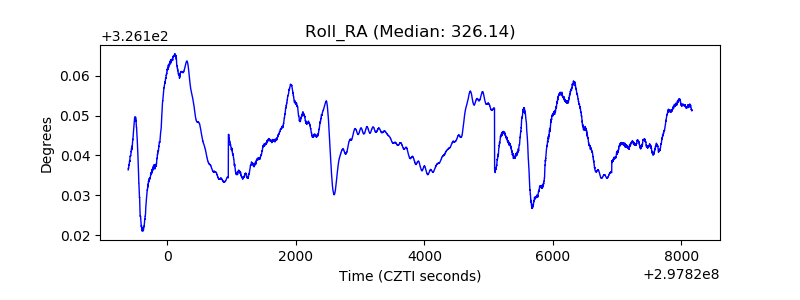 |
| Veto Counter | 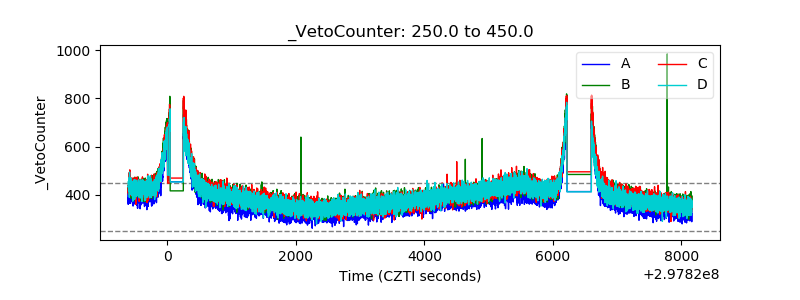 |