| Param | Original file | Final file |
|---|---|---|
| Filename | modeM0/AS1A06_002T02_9000002982_19997cztM0_level2.evt | modeM0/AS1A06_002T02_9000002982_19997cztM0_level2_quad_clean.evt |
| Size (bytes) | 910,221,120 | 179,789,760 |
| Size | 868.1 MB | 171.5 MB |
| Events in quadrant A | 6,348,945 | 1,149,626 |
| Events in quadrant B | 6,501,450 | 1,162,718 |
| Events in quadrant C | 7,162,238 | 1,106,546 |
| Events in quadrant D | 6,653,658 | 1,108,018 |
| Mode M9 | |||
|---|---|---|---|
| Quadrant | BADHDUFLAG | Total packets | Discarded packets |
| A | 0 | 17 | 0 |
| B | 0 | 17 | 0 |
| C | 0 | 17 | 0 |
| D | 0 | 17 | 0 |
| Mode SS | |||
|---|---|---|---|
| Quadrant | BADHDUFLAG | Total packets | Discarded packets |
| A | 0 | 272 | 0 |
| B | 0 | 272 | 0 |
| C | 0 | 272 | 0 |
| D | 0 | 272 | 0 |
| Mode M0 | |||
|---|---|---|---|
| Quadrant | BADHDUFLAG | Total packets | Discarded packets |
| A | 0 | 27802 | 3 |
| B | 0 | 28125 | 3 |
| C | 0 | 29971 | 3 |
| D | 0 | 29171 | 3 |
| Quadrant | Total seconds | Saturated seconds | Saturation percentage |
|---|---|---|---|
| A | 13289 | 124 | 0.933103% |
| B | 13290 | 170 | 1.279157% |
| C | 13290 | 369 | 2.776524% |
| D | 13290 | 170 | 1.279157% |
Noise dominated data is calculated using 1-second bins in cleaned event files. If a bin has >2000 counts, and if more than 50% of those come from <1% of pixels, then it is considered to be noise-dominated and hence unusable.
| Quadrant | # 1 sec bins | Bins with >0 counts | Bins with >2000 counts | High rate bins dominated by noise | Noise dominated (total time) | Noise dominated (detector-on time) | Marked lightcurve |
|---|---|---|---|---|---|---|---|
| A | 14973 | 13290 | 22 | 22 | 0.15% | 0.17% | 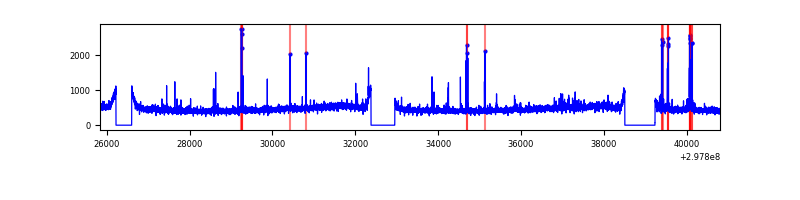 |
| B | 14975 | 13292 | 29 | 29 | 0.19% | 0.22% | 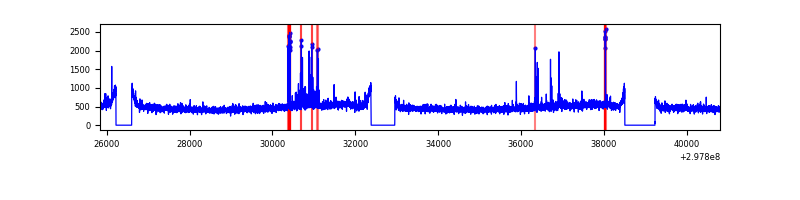 |
| C | 14975 | 13292 | 70 | 70 | 0.47% | 0.53% |  |
| D | 14975 | 13293 | 108 | 108 | 0.72% | 0.81% | 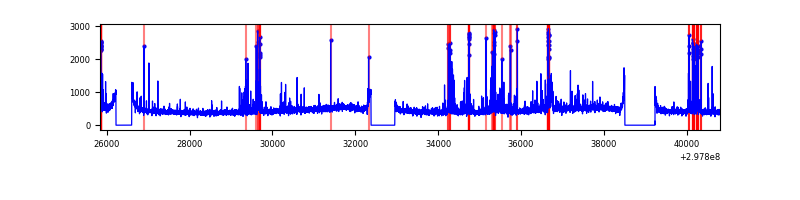 |
Top three noisy pixels from each quadrant. If the there are fewer than three noisy pixels in the level2.evt file, extra rows are filled as -1
| Pixel properties | Quadrant properties | ||||||
|---|---|---|---|---|---|---|---|
| Quadrant | DetID | PixID | Counts | Sigma | Mean | Median | Sigma |
| A | 14 | 238 | 107260 | 330.03 | 1588 | 1551 | 320.3 |
| A | 14 | 254 | 72262 | 220.77 | 1588 | 1551 | 320.3 |
| A | 5 | 16 | 44667 | 134.61 | 1588 | 1551 | 320.3 |
| B | 7 | 220 | 98117 | 319.01 | 1584 | 1543 | 302.7 |
| B | 15 | 33 | 63494 | 204.64 | 1584 | 1543 | 302.7 |
| B | 12 | 111 | 37897 | 120.09 | 1584 | 1543 | 302.7 |
| C | 3 | 233 | 797843 | 2228.05 | 1513 | 1520 | 357.4 |
| C | 14 | 238 | 234779 | 652.64 | 1513 | 1520 | 357.4 |
| C | 0 | 207 | 219125 | 608.84 | 1513 | 1520 | 357.4 |
| D | 12 | 218 | 341273 | 904.19 | 1541 | 1495 | 375.8 |
| D | 1 | 52 | 272588 | 721.41 | 1541 | 1495 | 375.8 |
| D | 7 | 96 | 107144 | 281.14 | 1541 | 1495 | 375.8 |
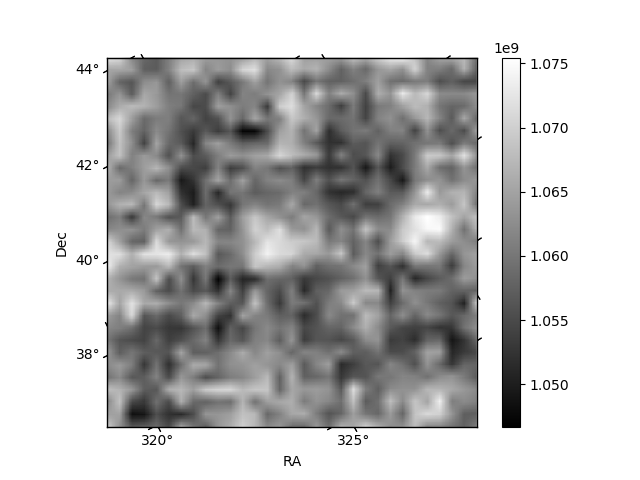
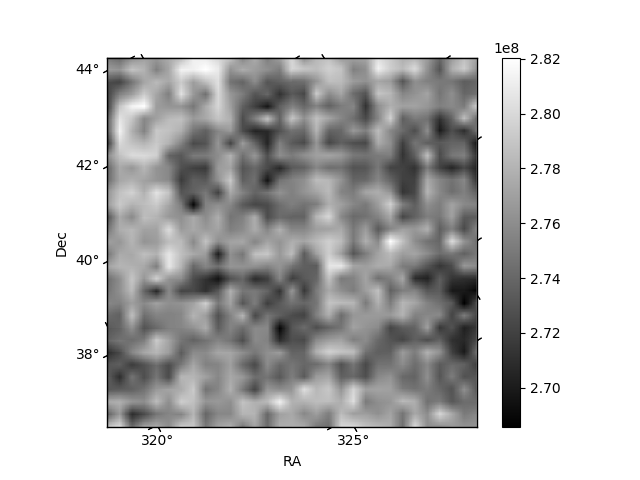
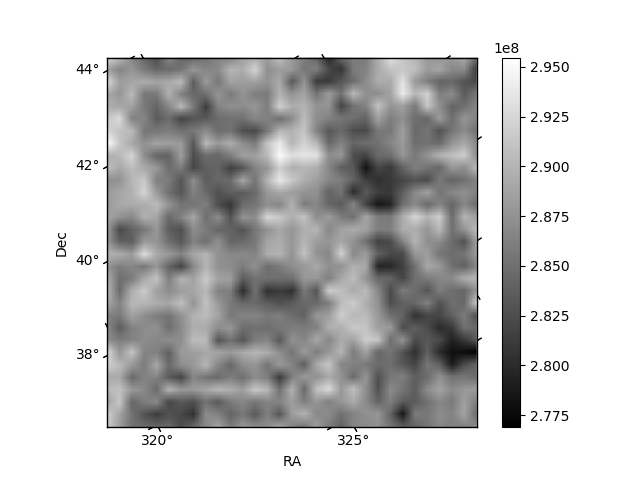
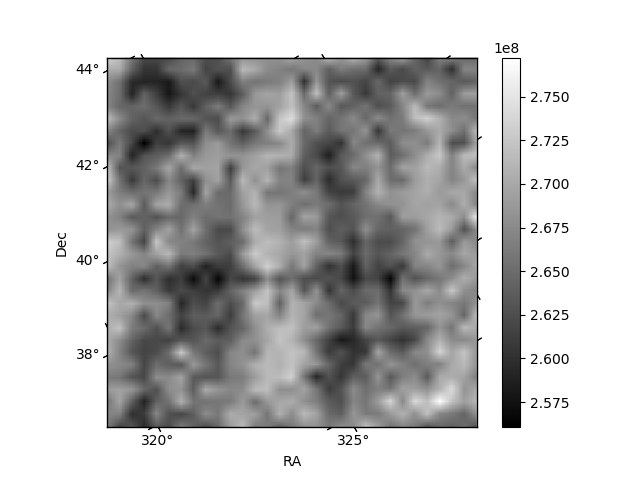
Histogram calculated using DETX and DETY for each event in the final _common_clean file
| Quadrant A | 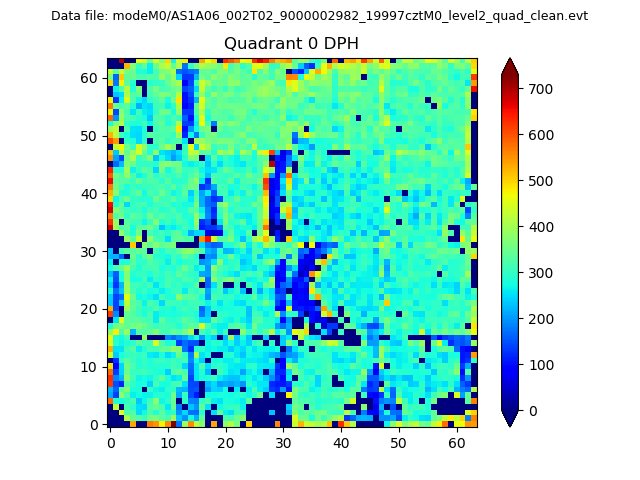 |
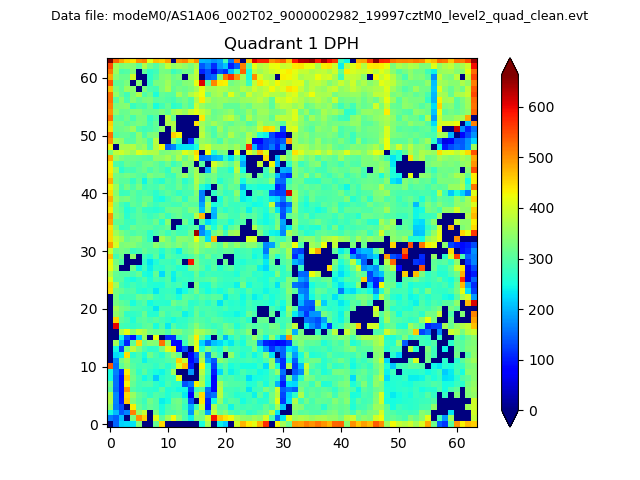 |
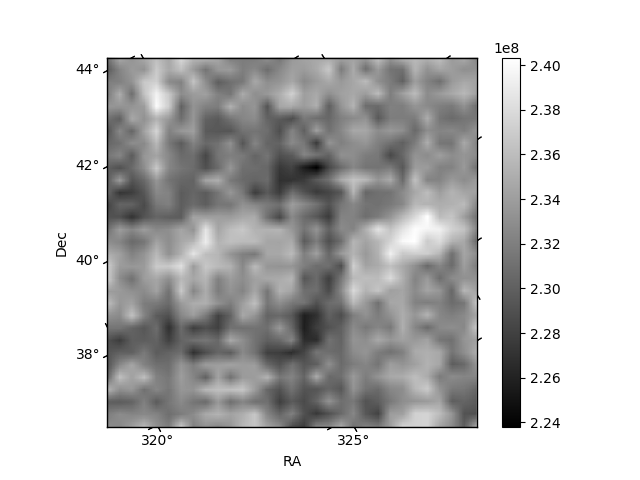
Quadrant B |
|---|---|---|---|
| Quadrant D | 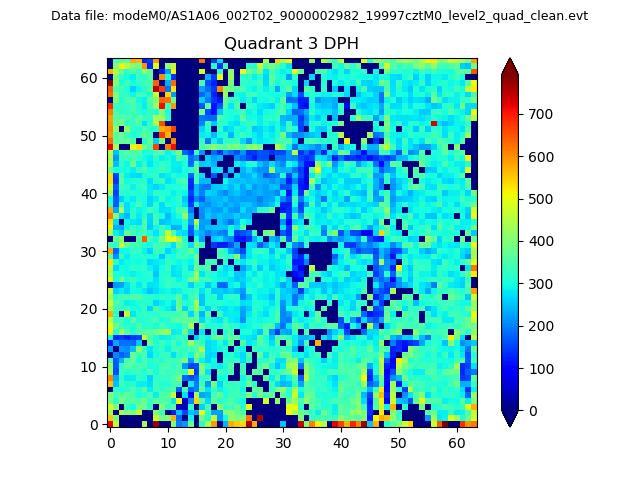 |
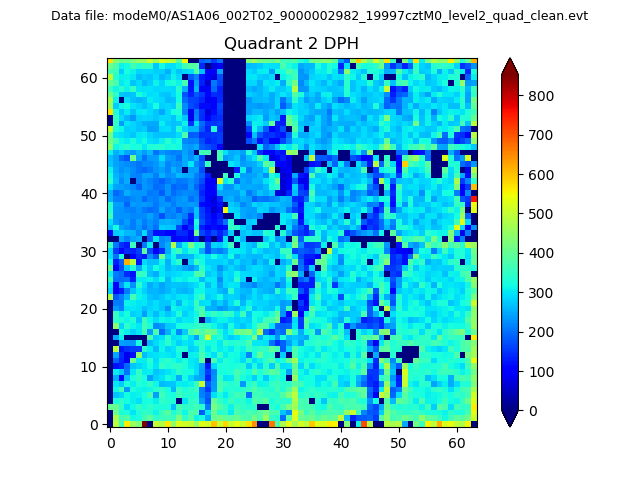 |
Quadrant C |
| Plot type | Count rate plots | Images |
|---|---|---|
| Comparison with Poisson distribution Blue bars denote a histogram of data divided into 1 sec bins. Red curve is a Poisson curve with rate = median count rate of data. |
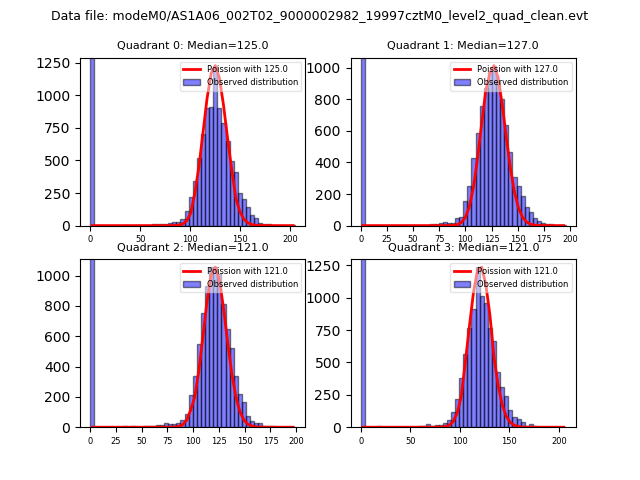 |
 |
| Quadrant-wise count rates Data is divided into 100 sec bins |
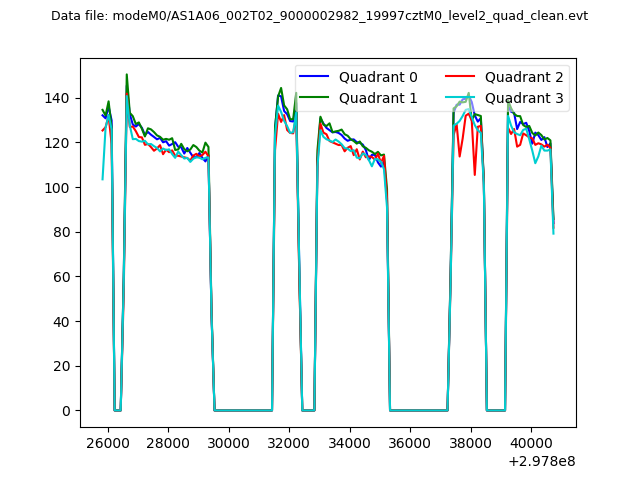 |
|
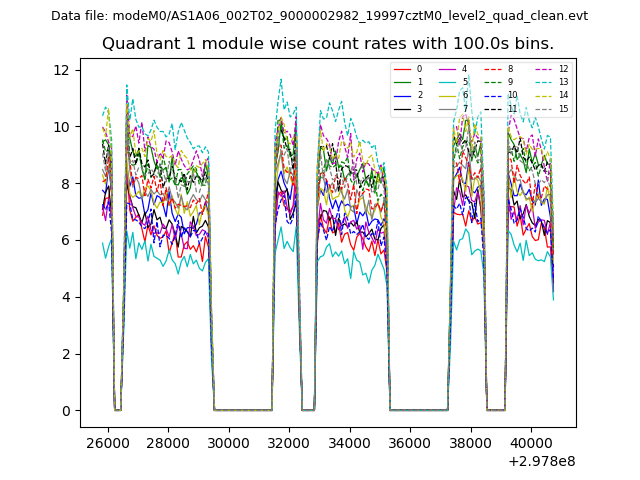
| Module-wise count rates for Quadrant A Data is divided into 100 sec bins |
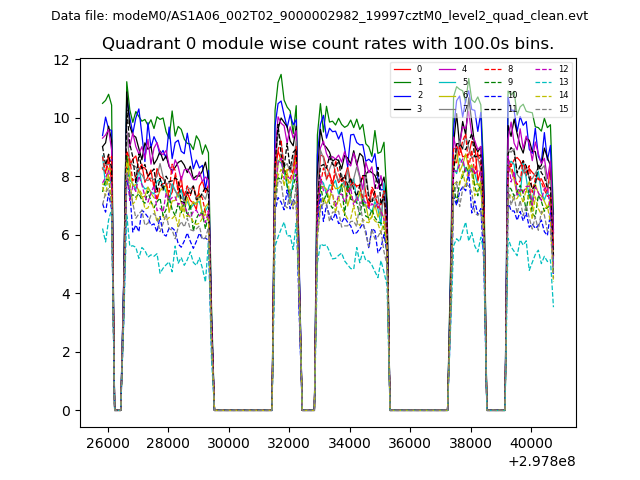 |
 |
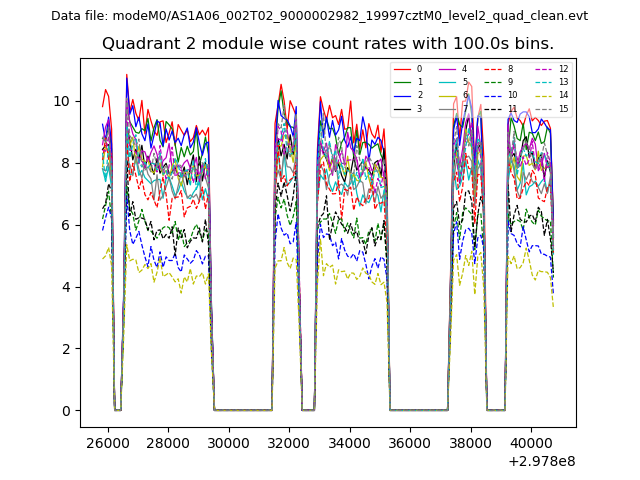
| Module-wise count rates for Quadrant B Data is divided into 100 sec bins |
 |
 |
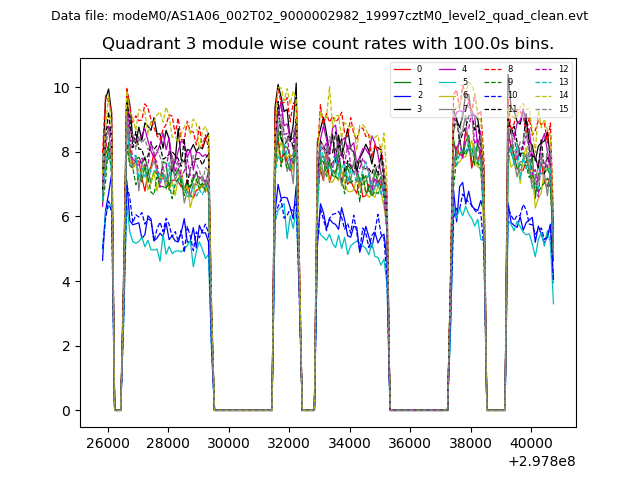
| Module-wise count rates for Quadrant C Data is divided into 100 sec bins |
 |
 |
| Module-wise count rates for Quadrant D Data is divided into 100 sec bins |
 |
 |
| Parameter | Plot |
|---|---|
| CZT HV Monitor | 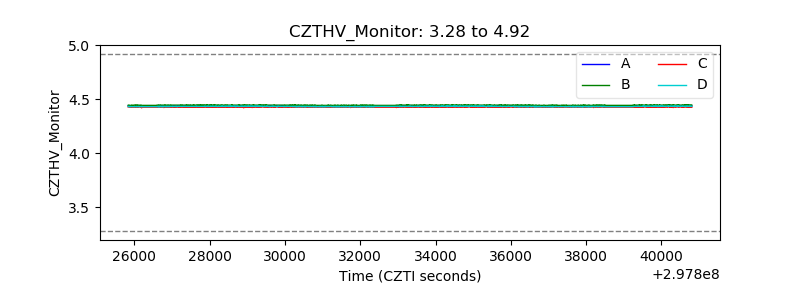 |
| D_VDD | 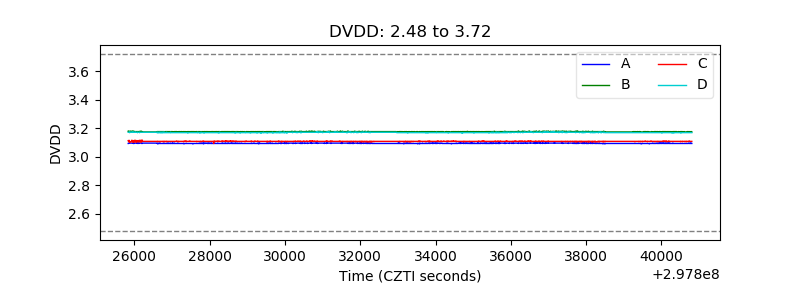 |
| Temperature 1 | 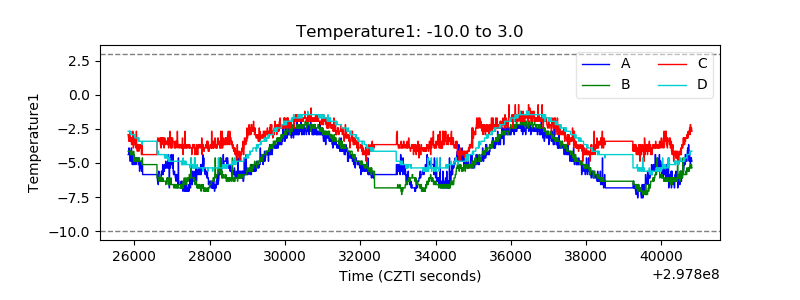 |
| Veto HV Monitor |  |
| Veto LLD | 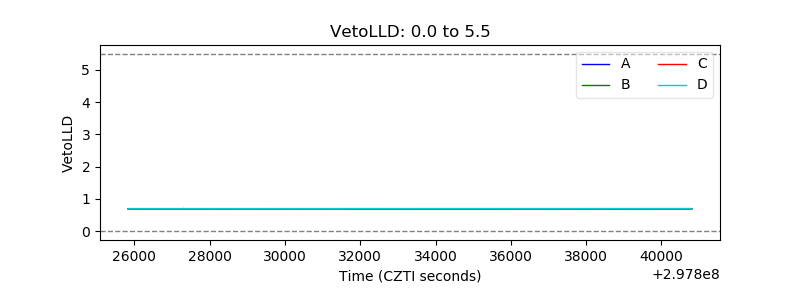 |
| Alpha Counter | 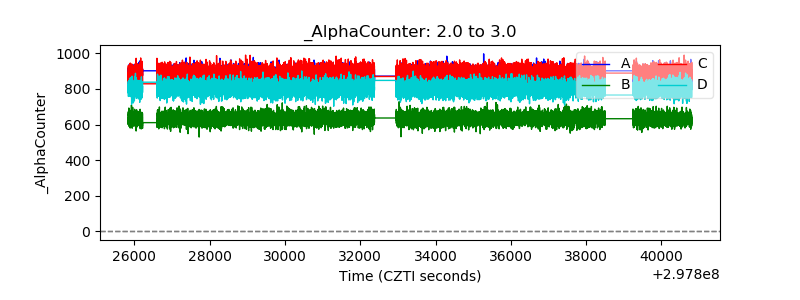 |
| _CPM_Rate | 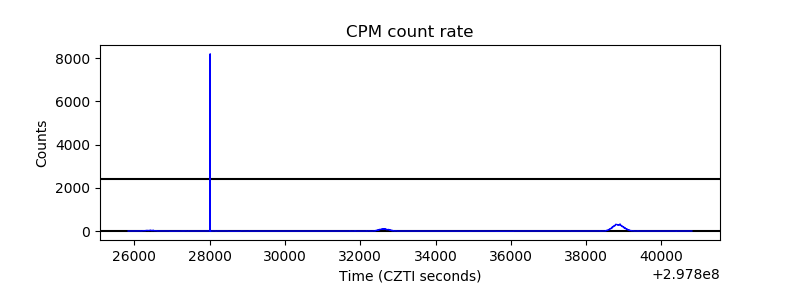 |
| CZT Counter | 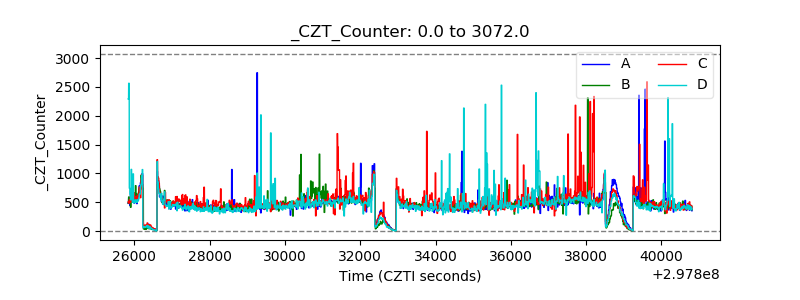 |
| +2.5 Volts monitor |  |
| +5 Volts monitor |  |
| _ROLL_ROT | 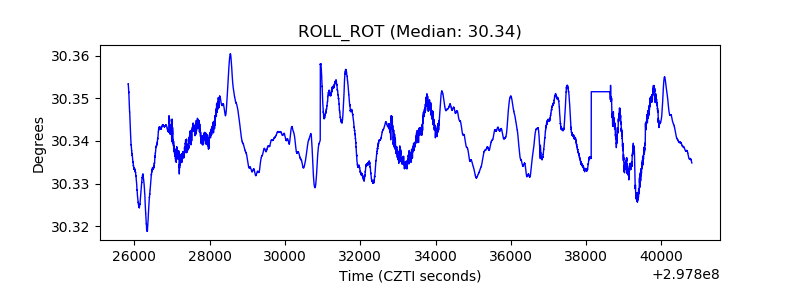 |
| _Roll_DEC | 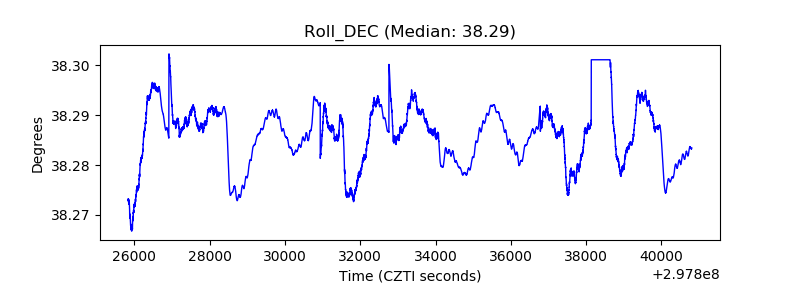 |
| _Roll_RA | 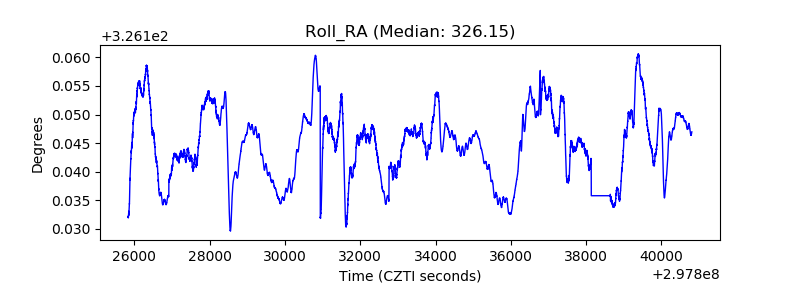 |
| Veto Counter | 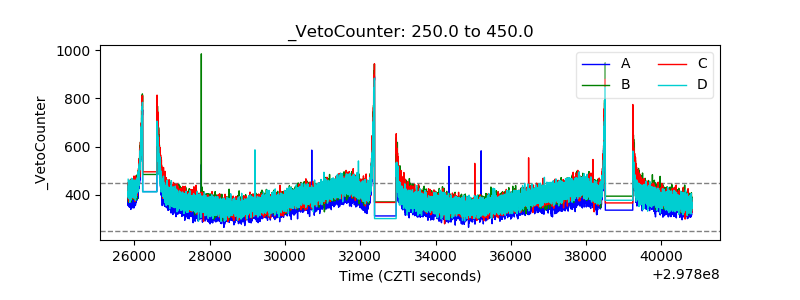 |