| Param | Original file | Final file |
|---|---|---|
| Filename | modeM0/AS1A06_002T02_9000002982_19998cztM0_level2.evt | modeM0/AS1A06_002T02_9000002982_19998cztM0_level2_quad_clean.evt |
| Size (bytes) | 463,029,120 | 88,217,280 |
| Size | 441.6 MB | 84.1 MB |
| Events in quadrant A | 3,239,897 | 564,569 |
| Events in quadrant B | 3,105,835 | 570,531 |
| Events in quadrant C | 3,624,482 | 544,561 |
| Events in quadrant D | 3,615,425 | 542,757 |
| Mode M9 | |||
|---|---|---|---|
| Quadrant | BADHDUFLAG | Total packets | Discarded packets |
| A | 0 | 9 | 0 |
| B | 0 | 9 | 0 |
| C | 0 | 9 | 0 |
| D | 0 | 9 | 0 |
| Mode SS | |||
|---|---|---|---|
| Quadrant | BADHDUFLAG | Total packets | Discarded packets |
| A | 0 | 130 | 0 |
| B | 0 | 130 | 0 |
| C | 0 | 130 | 0 |
| D | 0 | 130 | 0 |
| Mode M0 | |||
|---|---|---|---|
| Quadrant | BADHDUFLAG | Total packets | Discarded packets |
| A | 0 | 13832 | 1 |
| B | 0 | 13314 | 2 |
| C | 0 | 14929 | 1 |
| D | 0 | 15241 | 1 |
| Quadrant | Total seconds | Saturated seconds | Saturation percentage |
|---|---|---|---|
| A | 6439 | 92 | 1.428793% |
| B | 6439 | 74 | 1.149247% |
| C | 6439 | 109 | 1.692809% |
| D | 6439 | 187 | 2.904178% |
Noise dominated data is calculated using 1-second bins in cleaned event files. If a bin has >2000 counts, and if more than 50% of those come from <1% of pixels, then it is considered to be noise-dominated and hence unusable.
| Quadrant | # 1 sec bins | Bins with >0 counts | Bins with >2000 counts | High rate bins dominated by noise | Noise dominated (total time) | Noise dominated (detector-on time) | Marked lightcurve |
|---|---|---|---|---|---|---|---|
| A | 7334 | 6440 | 28 | 28 | 0.38% | 0.43% | 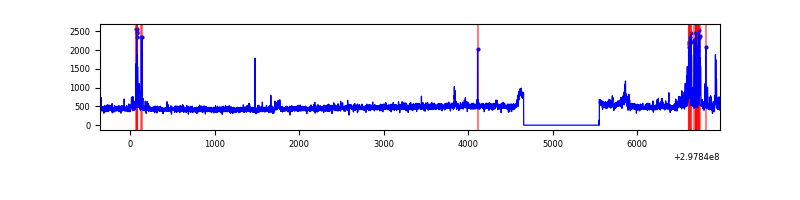 |
| B | 7334 | 6440 | 11 | 11 | 0.15% | 0.17% | 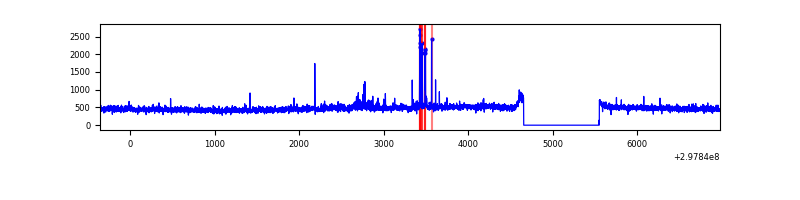 |
| C | 7334 | 6440 | 14 | 14 | 0.19% | 0.22% | 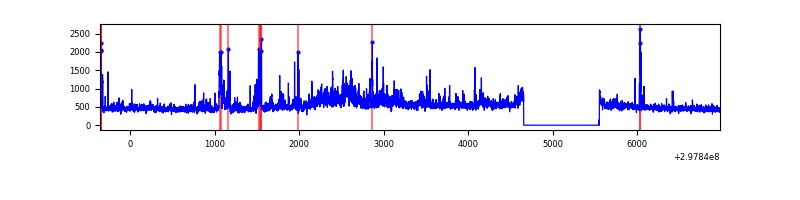 |
| D | 7334 | 6440 | 126 | 126 | 1.72% | 1.96% | 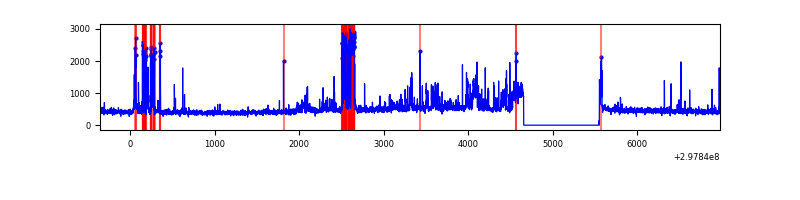 |
Top three noisy pixels from each quadrant. If the there are fewer than three noisy pixels in the level2.evt file, extra rows are filled as -1
| Pixel properties | Quadrant properties | ||||||
|---|---|---|---|---|---|---|---|
| Quadrant | DetID | PixID | Counts | Sigma | Mean | Median | Sigma |
| A | 14 | 238 | 179411 | 1149.46 | 768 | 752 | 155.4 |
| A | 13 | 252 | 79870 | 509.03 | 768 | 752 | 155.4 |
| A | 14 | 254 | 23292 | 145.02 | 768 | 752 | 155.4 |
| B | 7 | 220 | 74530 | 500.62 | 764 | 745 | 147.4 |
| B | 12 | 111 | 17963 | 116.82 | 764 | 745 | 147.4 |
| B | 11 | 111 | 15729 | 101.66 | 764 | 745 | 147.4 |
| C | 0 | 207 | 328480 | 1915.83 | 730 | 733 | 171.1 |
| C | 3 | 233 | 304441 | 1775.31 | 730 | 733 | 171.1 |
| C | 14 | 238 | 113255 | 657.74 | 730 | 733 | 171.1 |
| D | 1 | 52 | 598863 | 3340.16 | 733 | 711 | 179.1 |
| D | 12 | 218 | 142482 | 791.67 | 733 | 711 | 179.1 |
| D | 7 | 238 | 65206 | 360.15 | 733 | 711 | 179.1 |
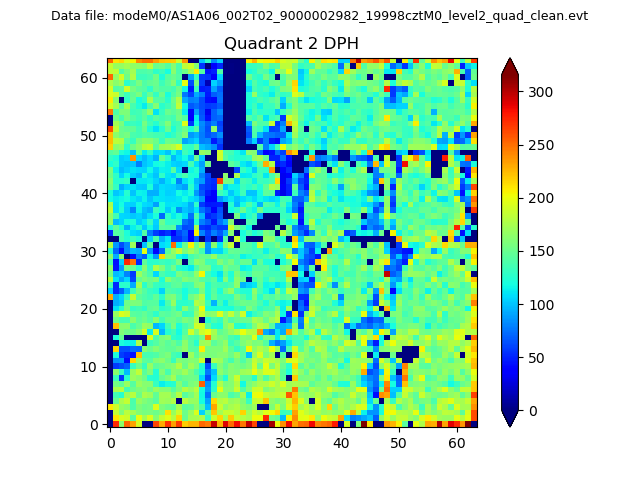
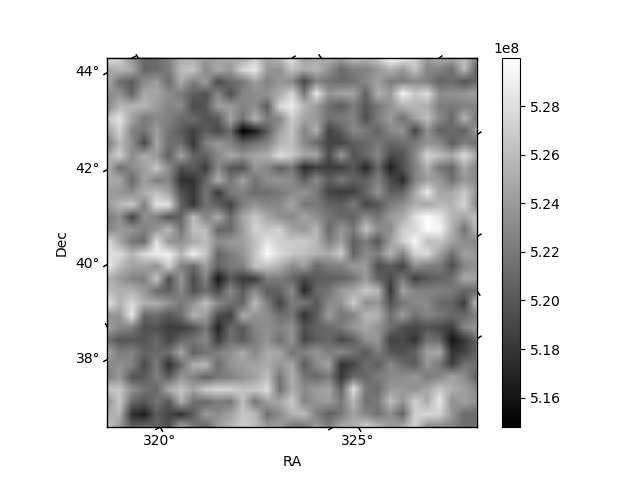
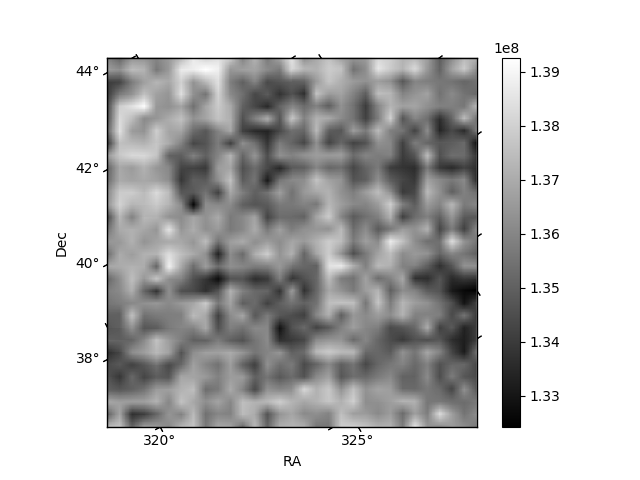
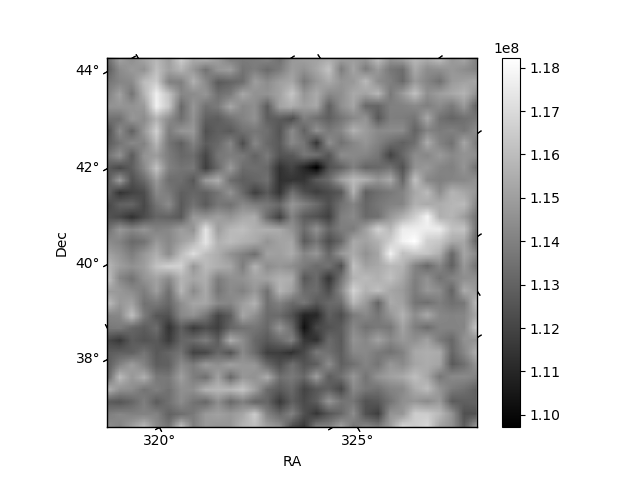
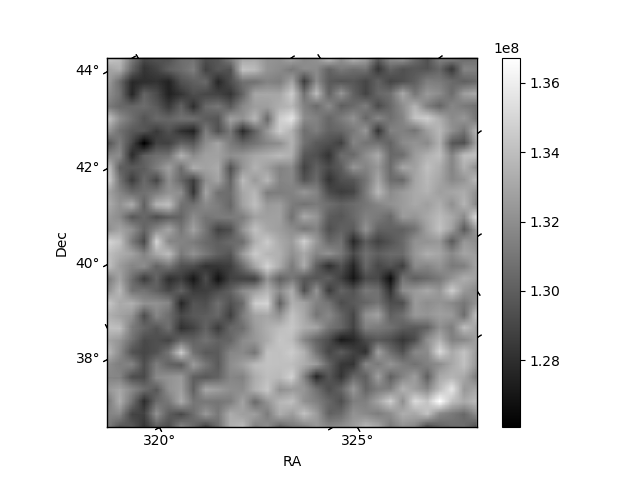
Histogram calculated using DETX and DETY for each event in the final _common_clean file
| Quadrant A | 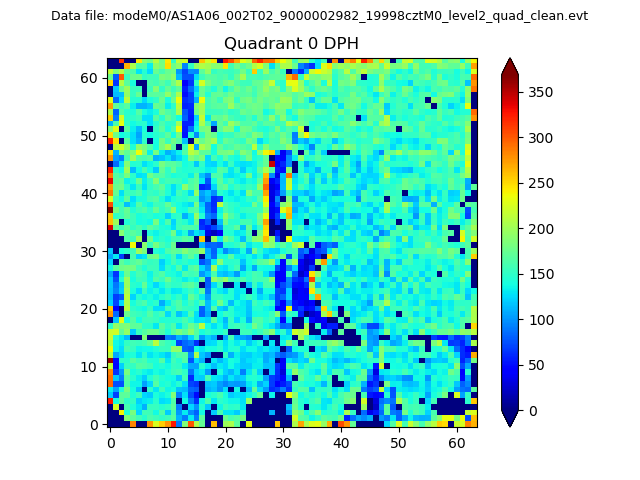 |
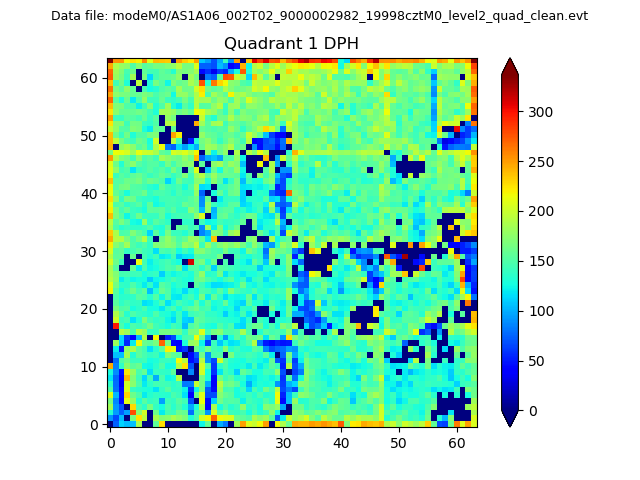 |
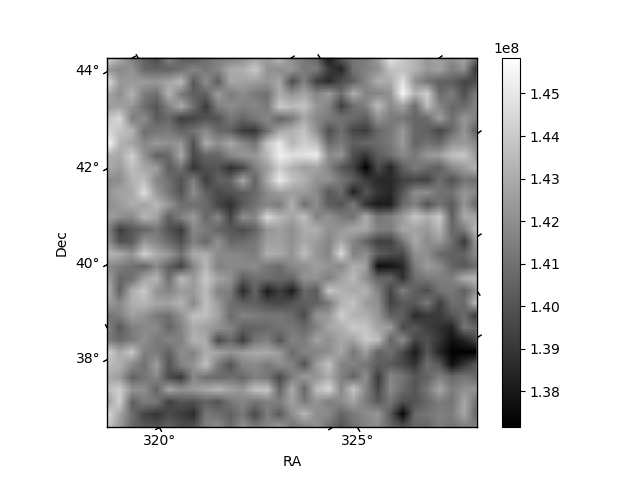
Quadrant B |
|---|---|---|---|
| Quadrant D | 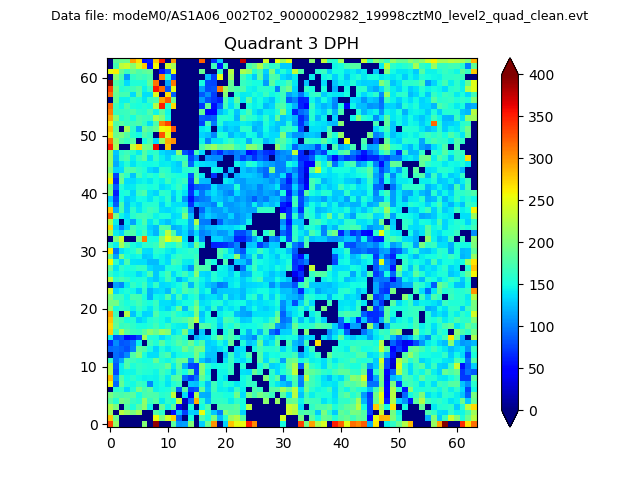 |
 |
Quadrant C |
| Plot type | Count rate plots | Images |
|---|---|---|
| Comparison with Poisson distribution Blue bars denote a histogram of data divided into 1 sec bins. Red curve is a Poisson curve with rate = median count rate of data. |
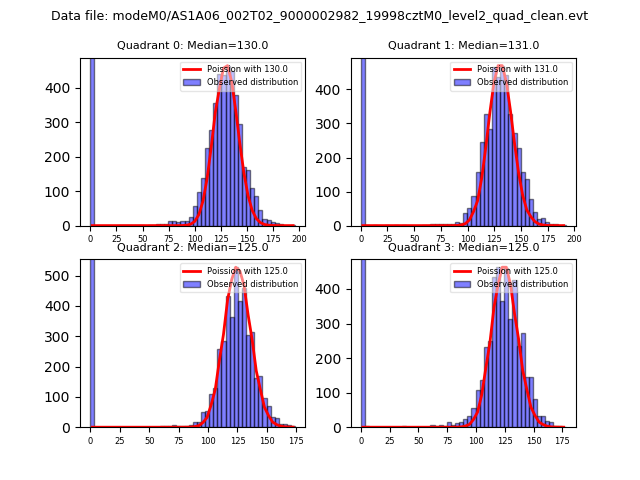 |
 |
| Quadrant-wise count rates Data is divided into 100 sec bins |
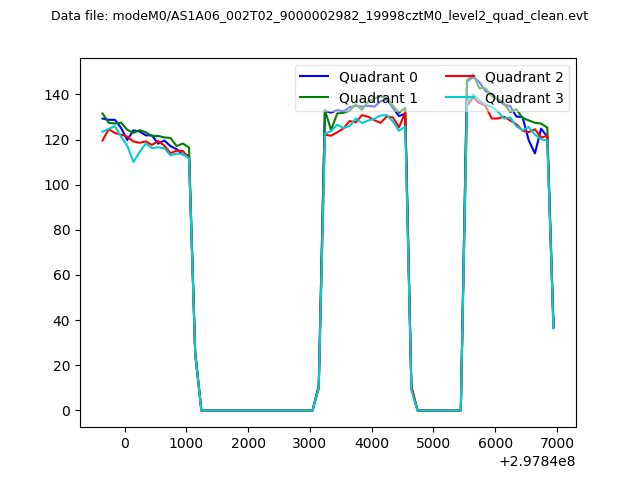 |
|
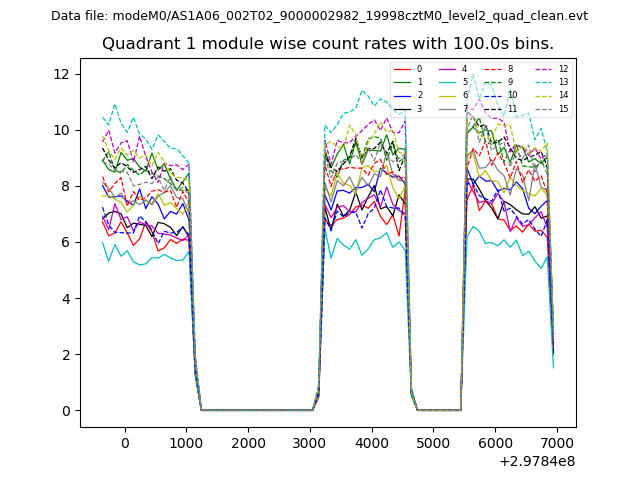
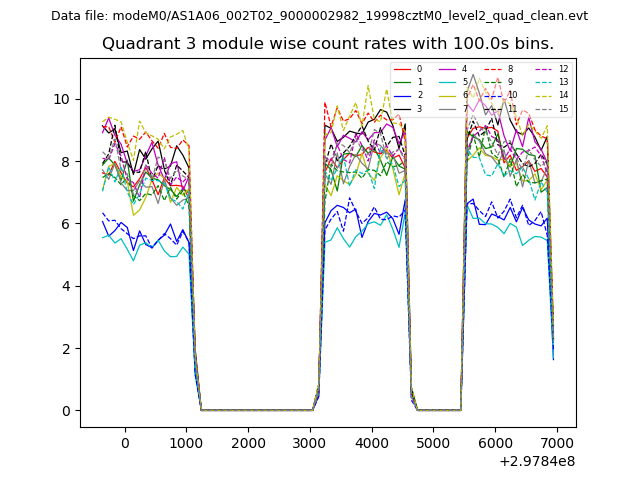
| Module-wise count rates for Quadrant A Data is divided into 100 sec bins |
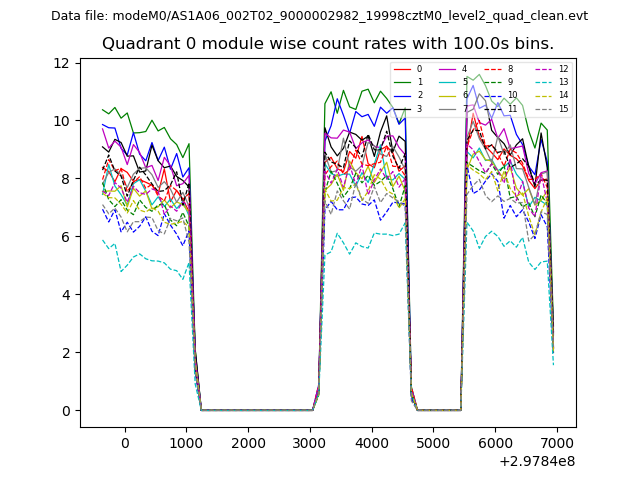 |
 |
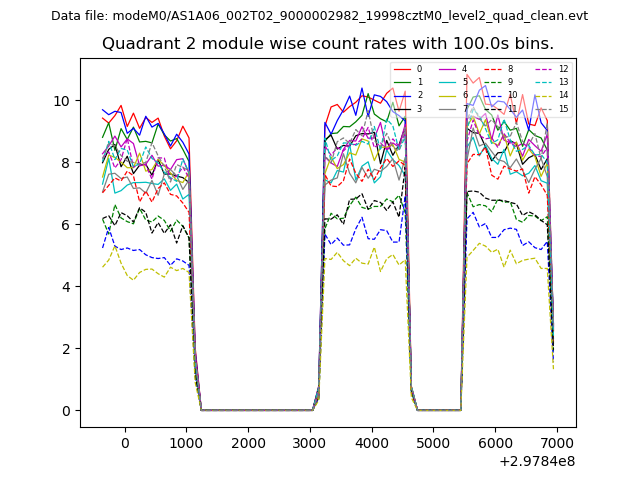
| Module-wise count rates for Quadrant B Data is divided into 100 sec bins |
 |
 |
| Module-wise count rates for Quadrant C Data is divided into 100 sec bins |
 |
 |
| Module-wise count rates for Quadrant D Data is divided into 100 sec bins |
 |
 |
| Parameter | Plot |
|---|---|
| CZT HV Monitor | 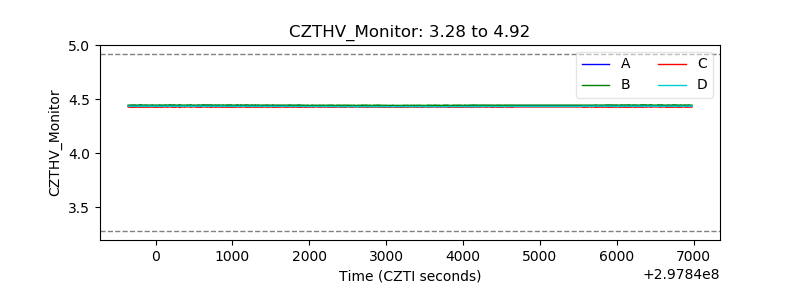 |
| D_VDD | 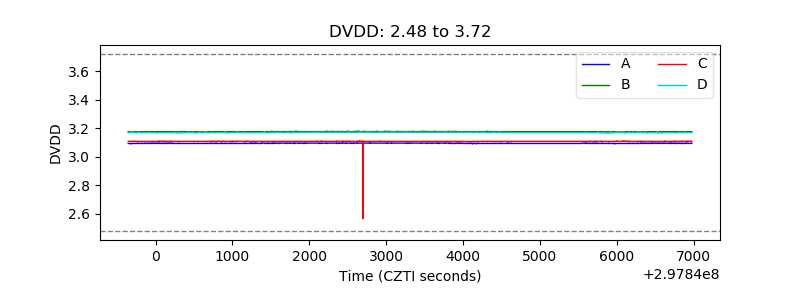 |
| Temperature 1 | 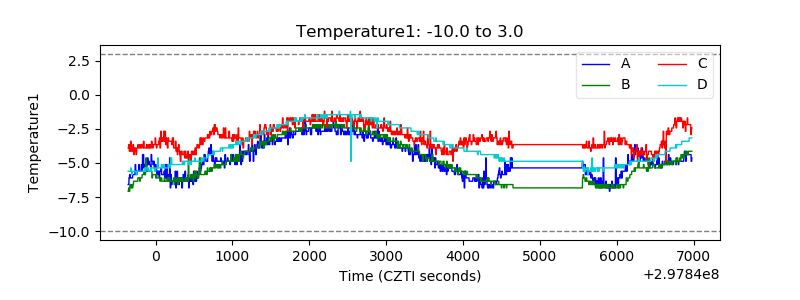 |
| Veto HV Monitor | 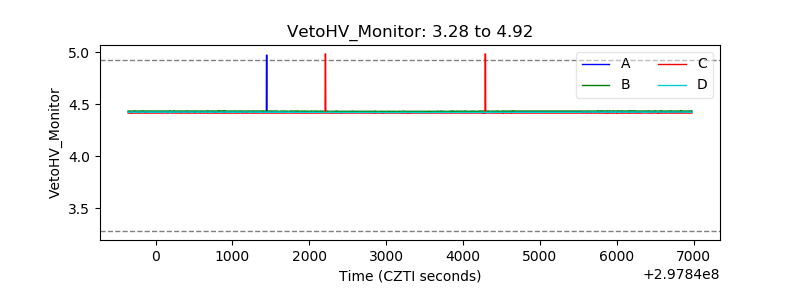 |
| Veto LLD | 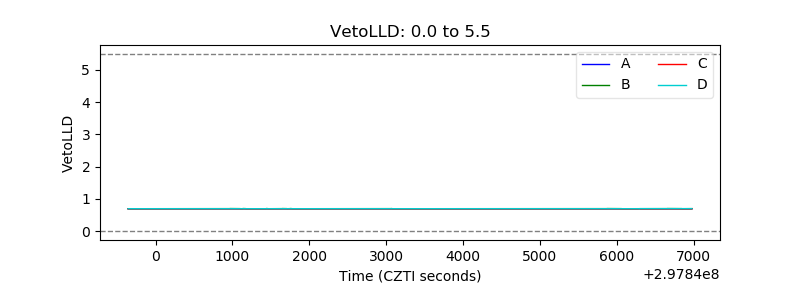 |
| Alpha Counter | 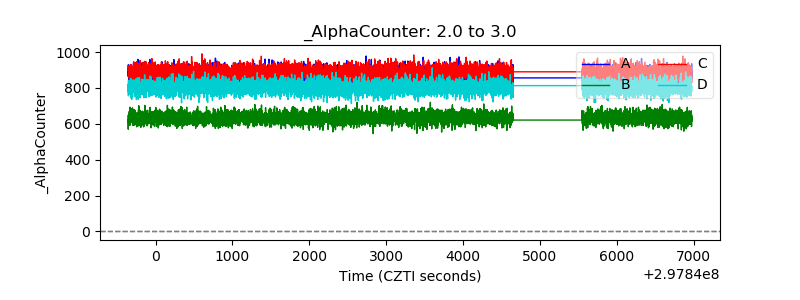 |
| _CPM_Rate | 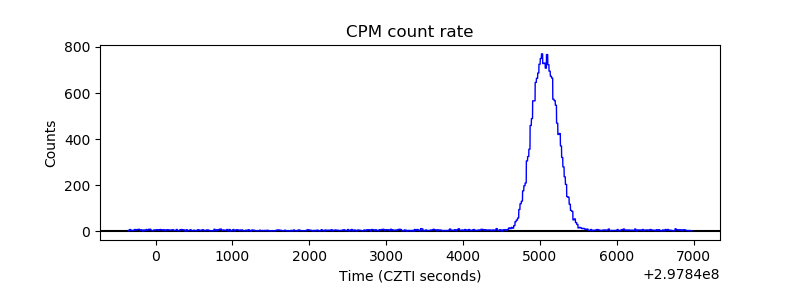 |
| CZT Counter | 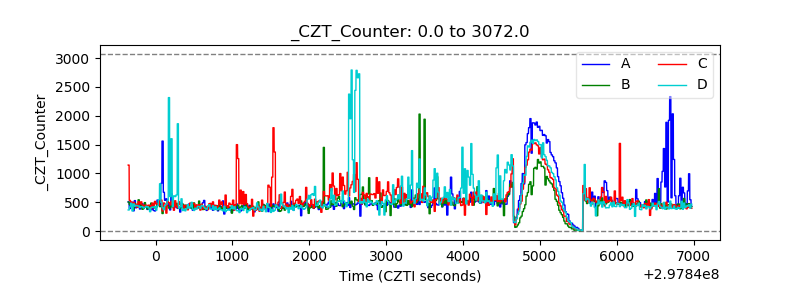 |
| +2.5 Volts monitor |  |
| +5 Volts monitor |  |
| _ROLL_ROT | 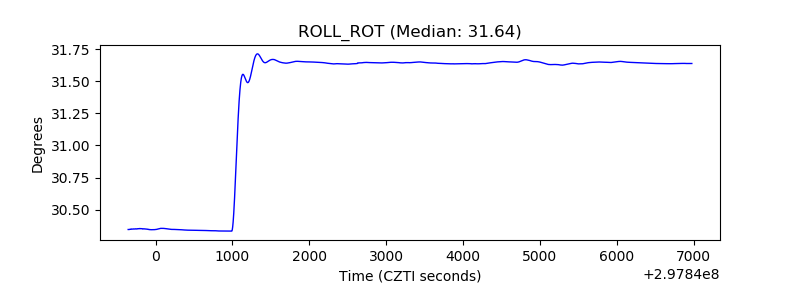 |
| _Roll_DEC | 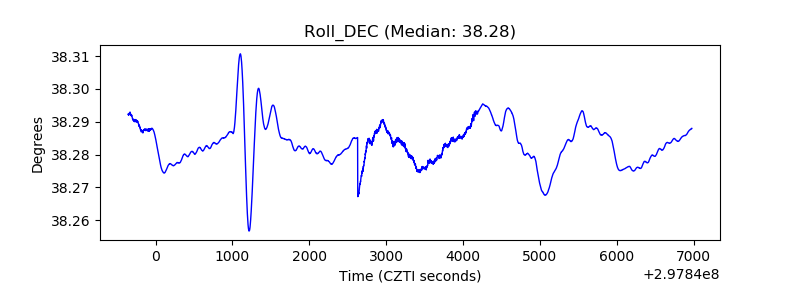 |
| _Roll_RA | 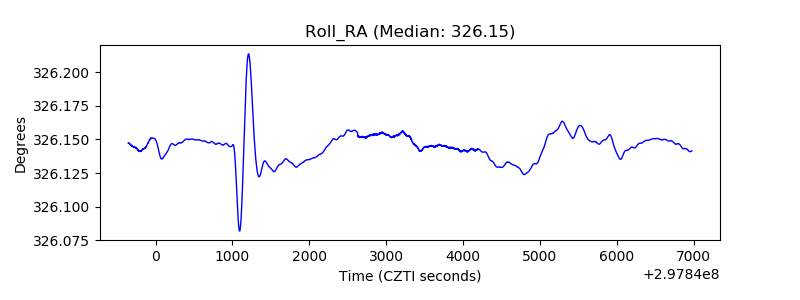 |
| Veto Counter | 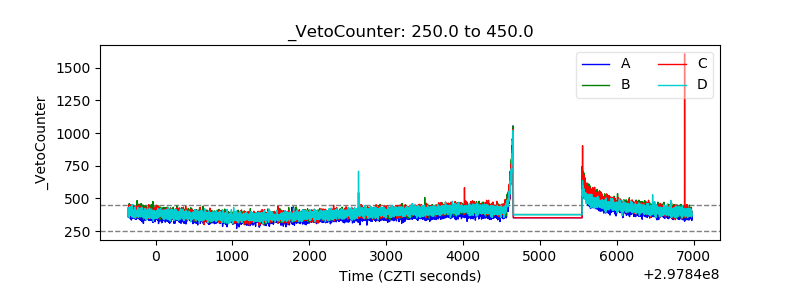 |