| Param | Original file | Final file |
|---|---|---|
| Filename | modeM0/AS1A06_002T02_9000002982_19999cztM0_level2.evt | modeM0/AS1A06_002T02_9000002982_19999cztM0_level2_quad_clean.evt |
| Size (bytes) | 480,654,720 | 82,762,560 |
| Size | 458.4 MB | 78.9 MB |
| Events in quadrant A | 3,609,622 | 524,692 |
| Events in quadrant B | 3,235,867 | 532,877 |
| Events in quadrant C | 3,357,217 | 504,551 |
| Events in quadrant D | 3,919,486 | 497,641 |
| Mode M9 | |||
|---|---|---|---|
| Quadrant | BADHDUFLAG | Total packets | Discarded packets |
| A | 0 | 11 | 0 |
| B | 0 | 11 | 0 |
| C | 0 | 11 | 0 |
| D | 0 | 11 | 0 |
| Mode SS | |||
|---|---|---|---|
| Quadrant | BADHDUFLAG | Total packets | Discarded packets |
| A | 0 | 128 | 0 |
| B | 0 | 128 | 0 |
| C | 0 | 128 | 0 |
| D | 0 | 128 | 0 |
| Mode M0 | |||
|---|---|---|---|
| Quadrant | BADHDUFLAG | Total packets | Discarded packets |
| A | 0 | 14664 | 1 |
| B | 0 | 13455 | 1 |
| C | 0 | 13912 | 1 |
| D | 0 | 15823 | 1 |
| Quadrant | Total seconds | Saturated seconds | Saturation percentage |
|---|---|---|---|
| A | 6405 | 140 | 2.185792% |
| B | 6405 | 40 | 0.624512% |
| C | 6405 | 69 | 1.077283% |
| D | 6405 | 255 | 3.981265% |
Noise dominated data is calculated using 1-second bins in cleaned event files. If a bin has >2000 counts, and if more than 50% of those come from <1% of pixels, then it is considered to be noise-dominated and hence unusable.
| Quadrant | # 1 sec bins | Bins with >0 counts | Bins with >2000 counts | High rate bins dominated by noise | Noise dominated (total time) | Noise dominated (detector-on time) | Marked lightcurve |
|---|---|---|---|---|---|---|---|
| A | 7475 | 6406 | 90 | 90 | 1.20% | 1.40% | 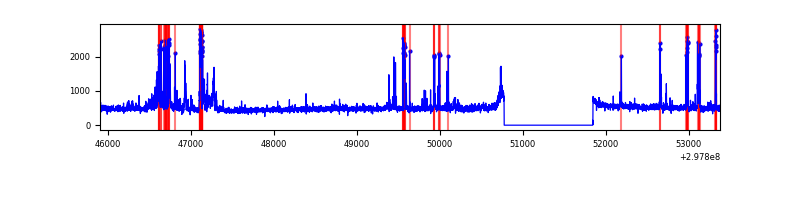 |
| B | 7475 | 6406 | 8 | 8 | 0.11% | 0.12% | 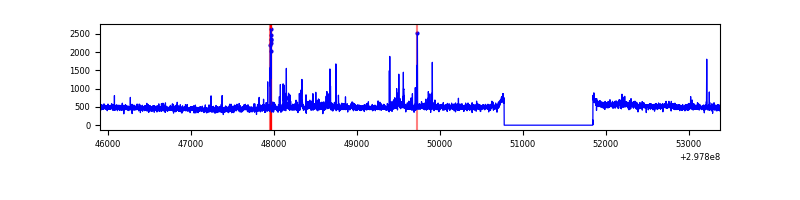 |
| C | 7475 | 6406 | 9 | 9 | 0.12% | 0.14% | 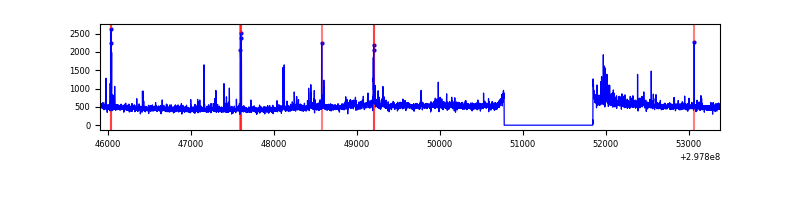 |
| D | 7475 | 6406 | 169 | 169 | 2.26% | 2.64% | 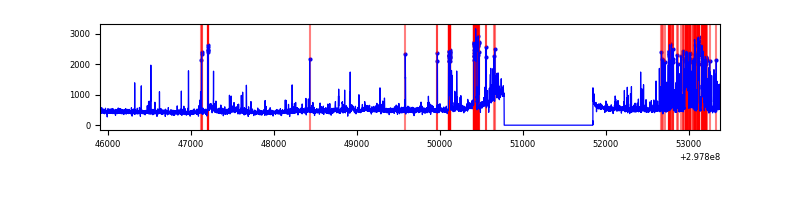 |
Top three noisy pixels from each quadrant. If the there are fewer than three noisy pixels in the level2.evt file, extra rows are filled as -1
| Pixel properties | Quadrant properties | ||||||
|---|---|---|---|---|---|---|---|
| Quadrant | DetID | PixID | Counts | Sigma | Mean | Median | Sigma |
| A | 14 | 238 | 311308 | 1989.05 | 786 | 772 | 156.1 |
| A | 13 | 252 | 136115 | 866.9 | 786 | 772 | 156.1 |
| A | 5 | 16 | 72659 | 460.45 | 786 | 772 | 156.1 |
| B | 7 | 220 | 45254 | 296.78 | 780 | 759 | 149.9 |
| B | 0 | 214 | 31372 | 204.18 | 780 | 759 | 149.9 |
| B | 0 | 245 | 26237 | 169.93 | 780 | 759 | 149.9 |
| C | 3 | 233 | 145394 | 835.19 | 744 | 749 | 173.2 |
| C | 14 | 238 | 117465 | 673.93 | 744 | 749 | 173.2 |
| C | 0 | 207 | 111540 | 639.72 | 744 | 749 | 173.2 |
| D | 12 | 218 | 404918 | 2233.67 | 749 | 727 | 181.0 |
| D | 1 | 52 | 390074 | 2151.64 | 749 | 727 | 181.0 |
| D | 7 | 238 | 184972 | 1018.19 | 749 | 727 | 181.0 |
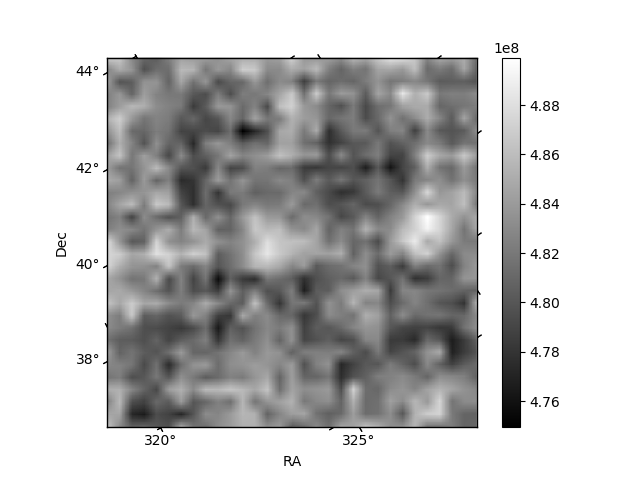
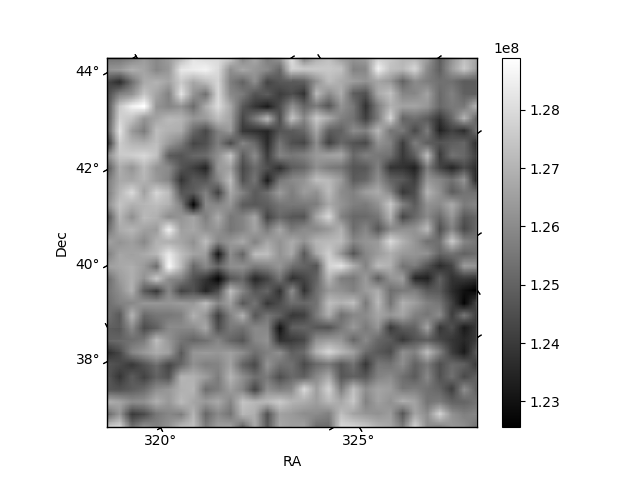
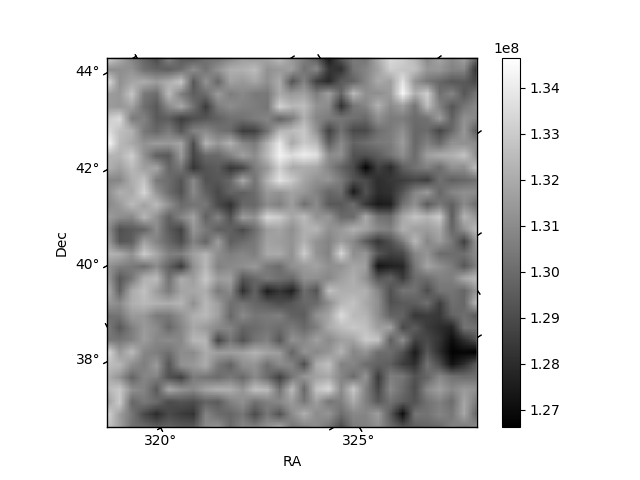
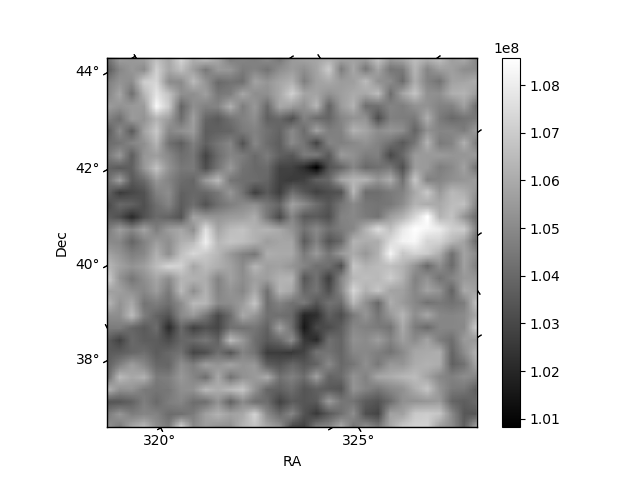
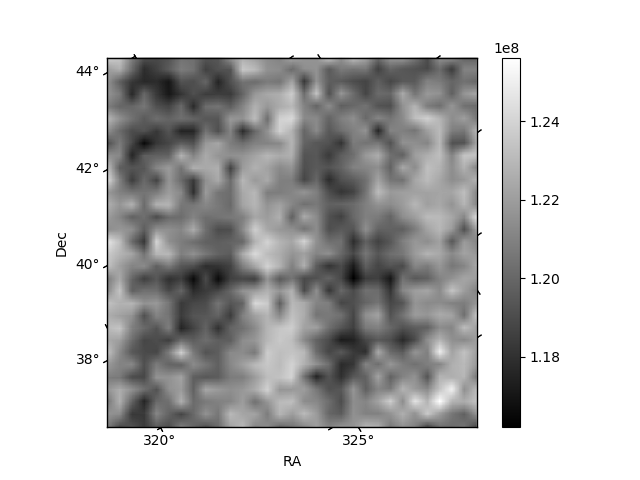
Histogram calculated using DETX and DETY for each event in the final _common_clean file
| Quadrant A | 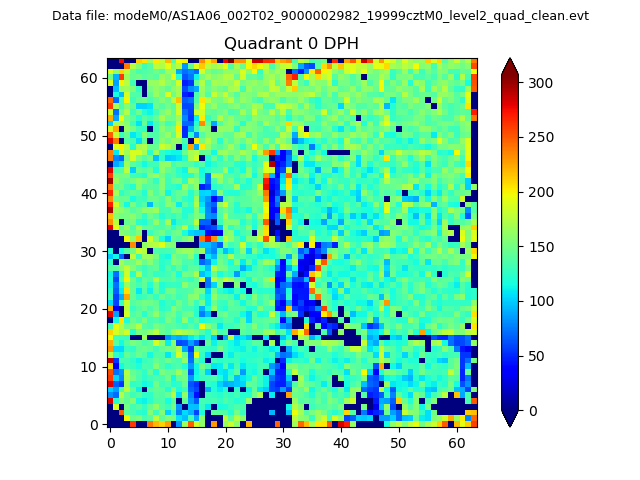 |
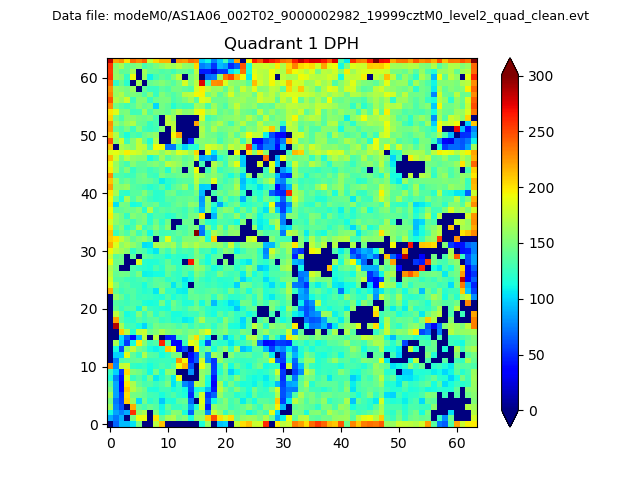 |
Quadrant B |
|---|---|---|---|
| Quadrant D | 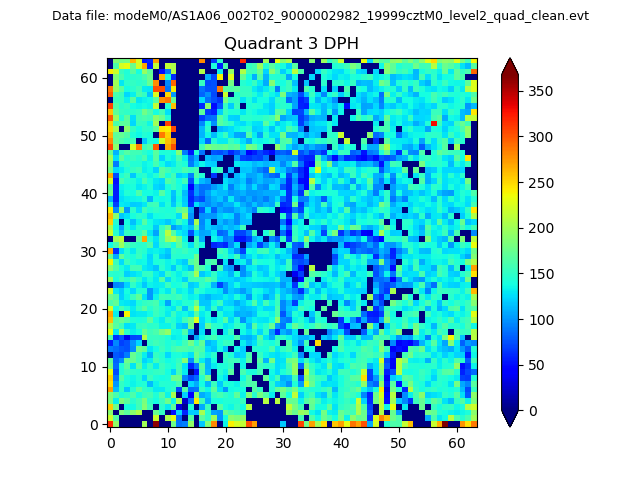 |
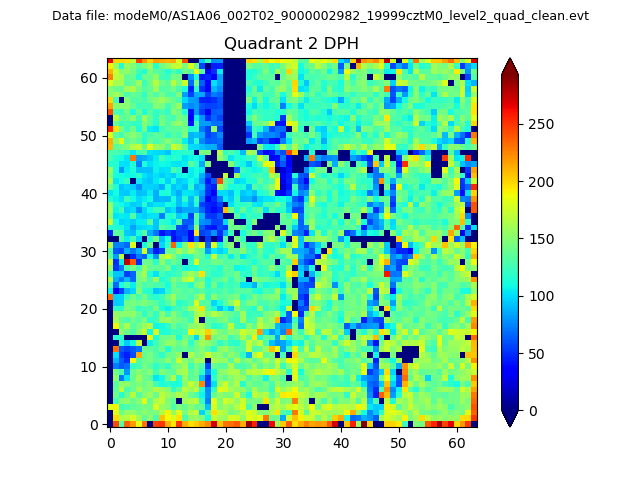 |
Quadrant C |
| Plot type | Count rate plots | Images |
|---|---|---|
| Comparison with Poisson distribution Blue bars denote a histogram of data divided into 1 sec bins. Red curve is a Poisson curve with rate = median count rate of data. |
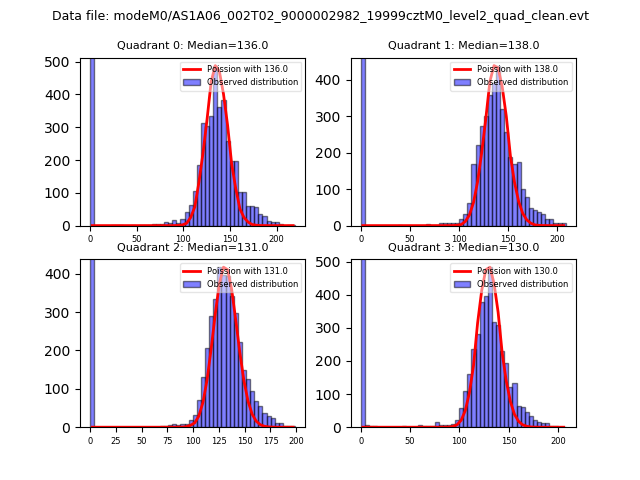 |
 |
| Quadrant-wise count rates Data is divided into 100 sec bins |
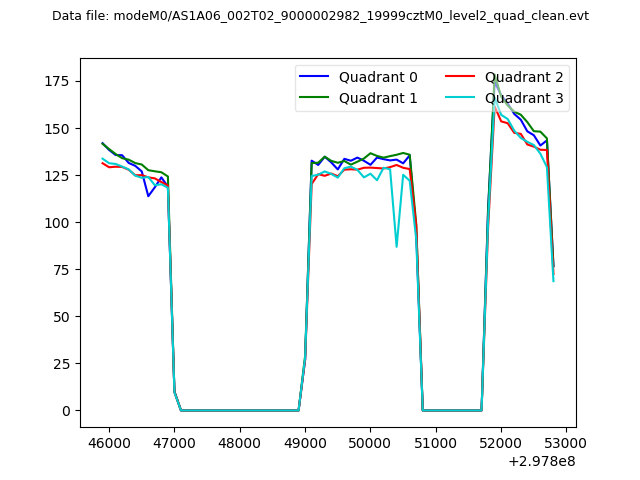 |
|
| Module-wise count rates for Quadrant A Data is divided into 100 sec bins |
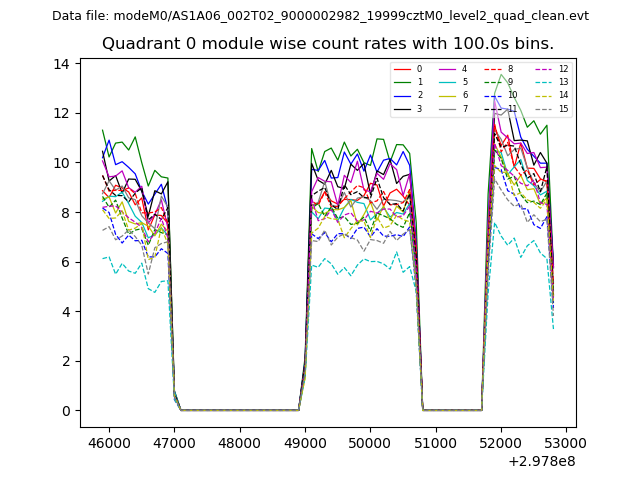 |
 |
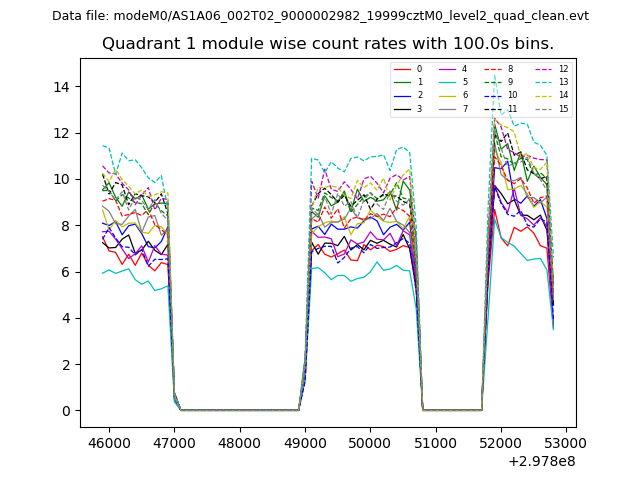
| Module-wise count rates for Quadrant B Data is divided into 100 sec bins |
 |
 |
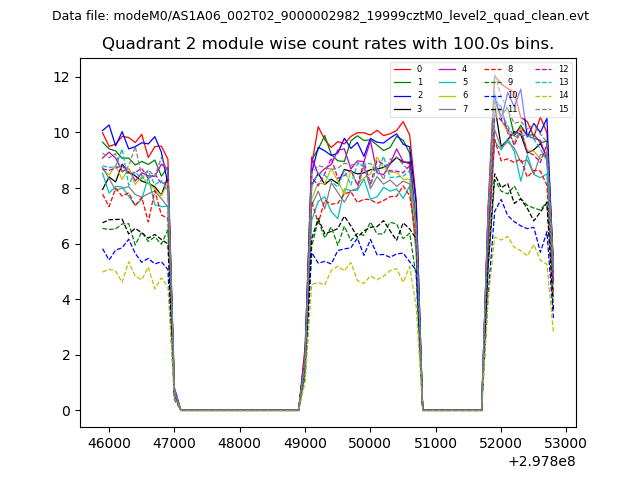
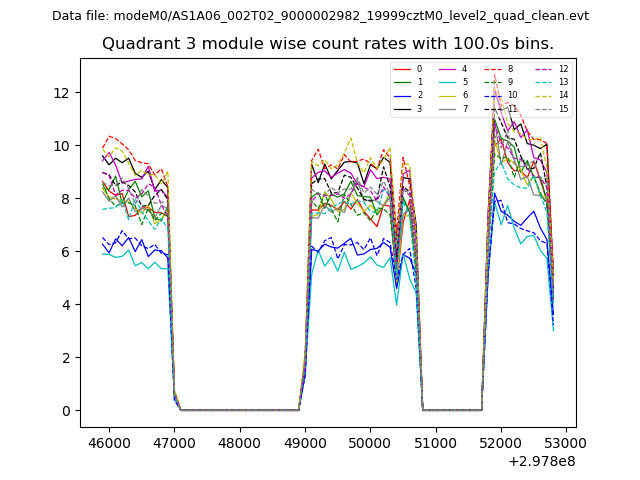
| Module-wise count rates for Quadrant C Data is divided into 100 sec bins |
 |
 |
| Module-wise count rates for Quadrant D Data is divided into 100 sec bins |
 |
 |
| Parameter | Plot |
|---|---|
| CZT HV Monitor | 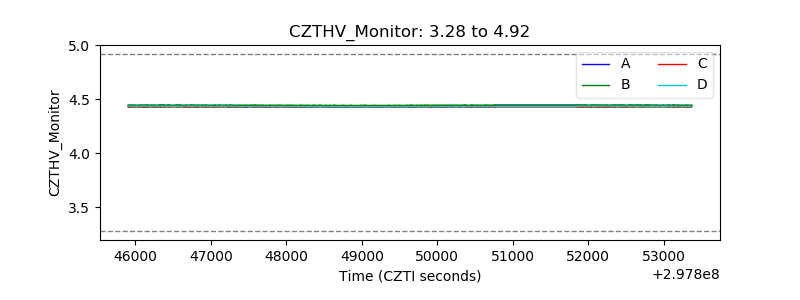 |
| D_VDD | 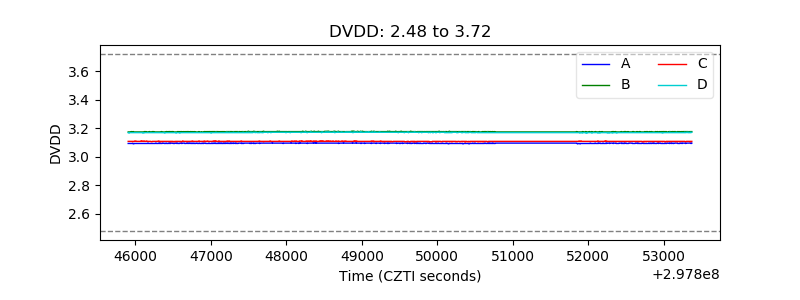 |
| Temperature 1 | 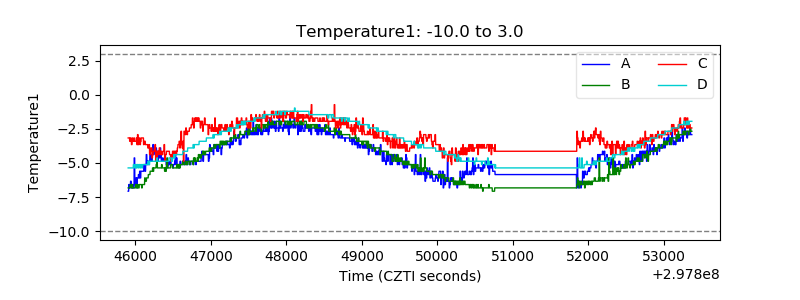 |
| Veto HV Monitor | 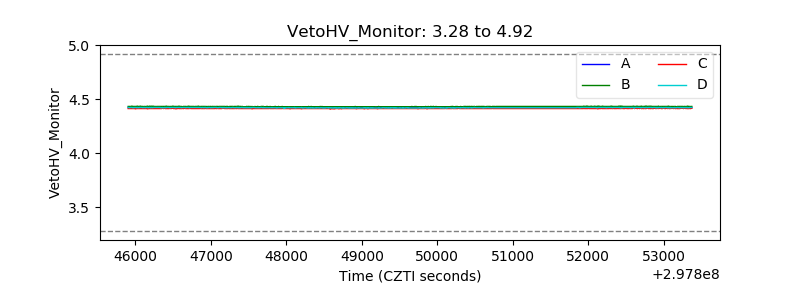 |
| Veto LLD | 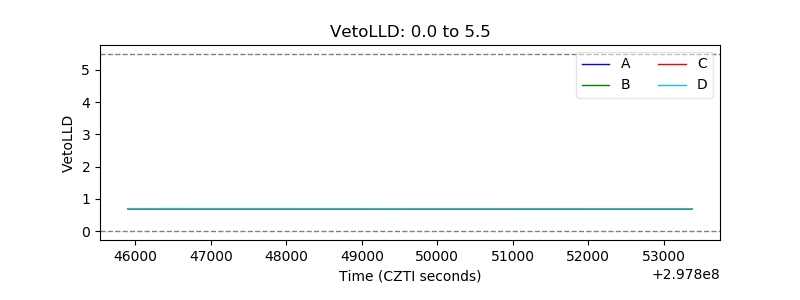 |
| Alpha Counter | 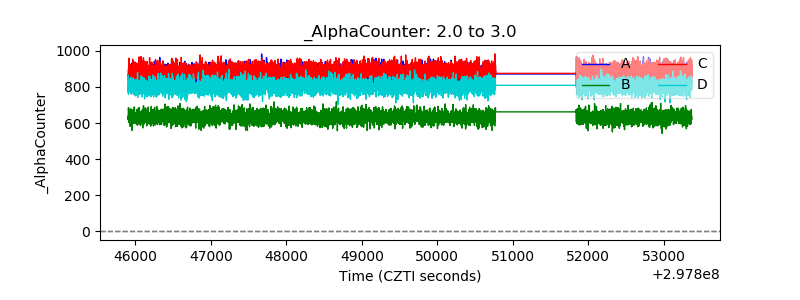 |
| _CPM_Rate | 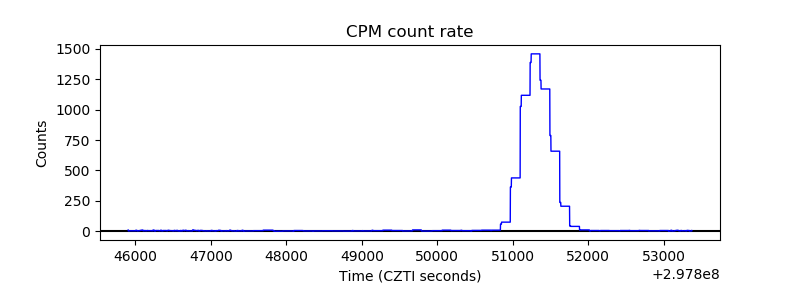 |
| CZT Counter | 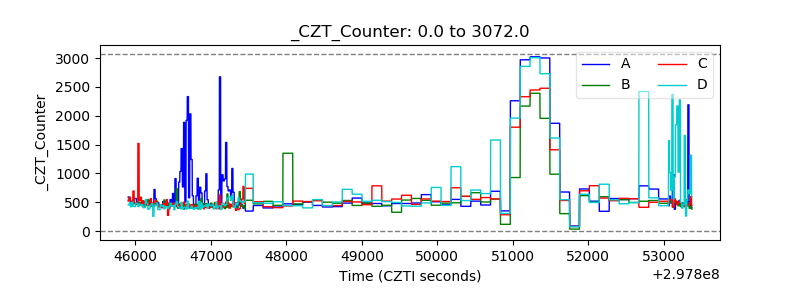 |
| +2.5 Volts monitor |  |
| +5 Volts monitor |  |
| _ROLL_ROT | 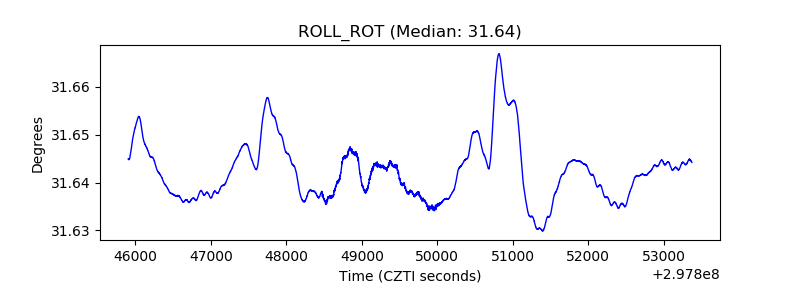 |
| _Roll_DEC | 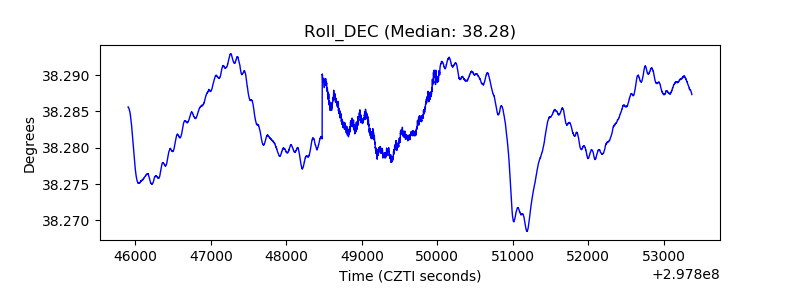 |
| _Roll_RA | 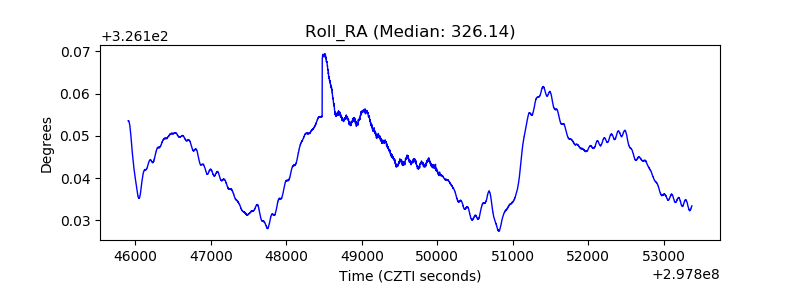 |
| Veto Counter | 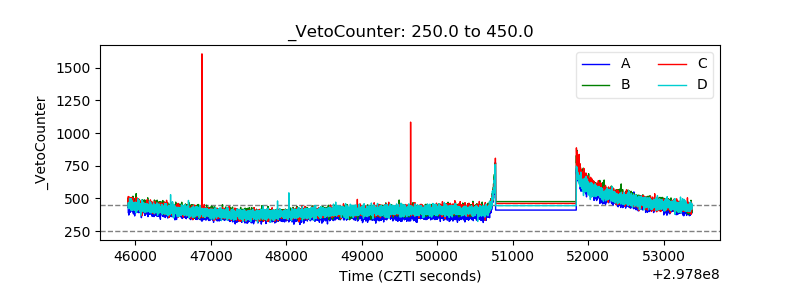 |