| Param | Original file | Final file |
|---|---|---|
| Filename | modeM0/AS1A06_002T02_9000002982_20001cztM0_level2.evt | modeM0/AS1A06_002T02_9000002982_20001cztM0_level2_quad_clean.evt |
| Size (bytes) | 473,028,480 | 73,990,080 |
| Size | 451.1 MB | 70.6 MB |
| Events in quadrant A | 3,303,706 | 463,261 |
| Events in quadrant B | 3,337,966 | 467,252 |
| Events in quadrant C | 3,358,995 | 441,125 |
| Events in quadrant D | 3,909,281 | 441,022 |
| Mode M9 | |||
|---|---|---|---|
| Quadrant | BADHDUFLAG | Total packets | Discarded packets |
| A | 0 | 12 | 0 |
| B | 0 | 12 | 0 |
| C | 0 | 12 | 0 |
| D | 0 | 12 | 0 |
| Mode SS | |||
|---|---|---|---|
| Quadrant | BADHDUFLAG | Total packets | Discarded packets |
| A | 0 | 124 | 0 |
| B | 0 | 124 | 0 |
| C | 0 | 124 | 0 |
| D | 0 | 124 | 0 |
| Mode M0 | |||
|---|---|---|---|
| Quadrant | BADHDUFLAG | Total packets | Discarded packets |
| A | 0 | 13571 | 1 |
| B | 0 | 13607 | 1 |
| C | 0 | 13631 | 1 |
| D | 0 | 15442 | 1 |
| Quadrant | Total seconds | Saturated seconds | Saturation percentage |
|---|---|---|---|
| A | 6128 | 113 | 1.843995% |
| B | 6129 | 91 | 1.484745% |
| C | 6129 | 85 | 1.386849% |
| D | 6129 | 281 | 4.584761% |
Noise dominated data is calculated using 1-second bins in cleaned event files. If a bin has >2000 counts, and if more than 50% of those come from <1% of pixels, then it is considered to be noise-dominated and hence unusable.
| Quadrant | # 1 sec bins | Bins with >0 counts | Bins with >2000 counts | High rate bins dominated by noise | Noise dominated (total time) | Noise dominated (detector-on time) | Marked lightcurve |
|---|---|---|---|---|---|---|---|
| A | 7288 | 6129 | 43 | 43 | 0.59% | 0.70% | 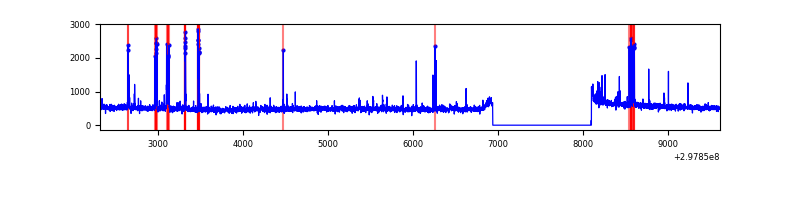 |
| B | 7289 | 6130 | 15 | 15 | 0.21% | 0.24% | 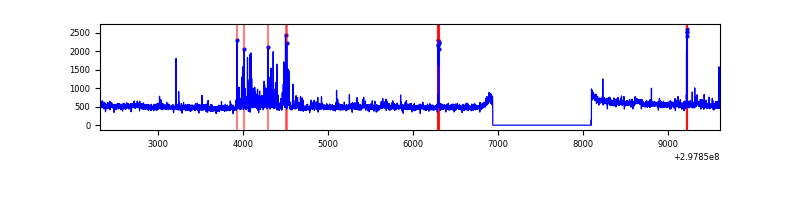 |
| C | 7289 | 6130 | 4 | 4 | 0.05% | 0.07% | 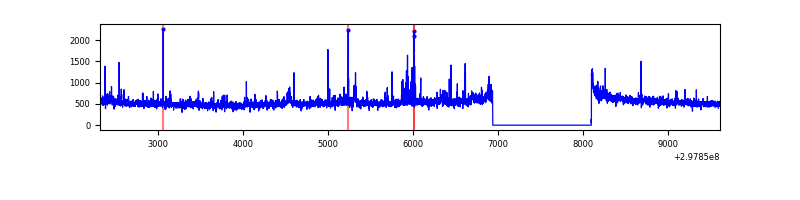 |
| D | 7289 | 6130 | 154 | 154 | 2.11% | 2.51% | 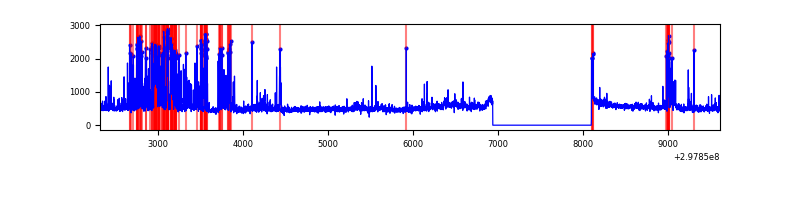 |
Top three noisy pixels from each quadrant. If the there are fewer than three noisy pixels in the level2.evt file, extra rows are filled as -1
| Pixel properties | Quadrant properties | ||||||
|---|---|---|---|---|---|---|---|
| Quadrant | DetID | PixID | Counts | Sigma | Mean | Median | Sigma |
| A | 14 | 238 | 143727 | 901.88 | 794 | 780 | 158.5 |
| A | 5 | 16 | 77207 | 482.19 | 794 | 780 | 158.5 |
| A | 14 | 254 | 16993 | 102.29 | 794 | 780 | 158.5 |
| B | 7 | 220 | 106401 | 707.89 | 783 | 765 | 149.2 |
| B | 0 | 245 | 52871 | 349.18 | 783 | 765 | 149.2 |
| B | 3 | 64 | 37564 | 246.6 | 783 | 765 | 149.2 |
| C | 3 | 233 | 149009 | 856.2 | 748 | 753 | 173.2 |
| C | 0 | 207 | 123682 | 709.93 | 748 | 753 | 173.2 |
| C | 14 | 238 | 118475 | 679.86 | 748 | 753 | 173.2 |
| D | 12 | 218 | 482781 | 2636.02 | 759 | 736 | 182.9 |
| D | 1 | 52 | 337171 | 1839.76 | 759 | 736 | 182.9 |
| D | 7 | 238 | 108882 | 591.39 | 759 | 736 | 182.9 |
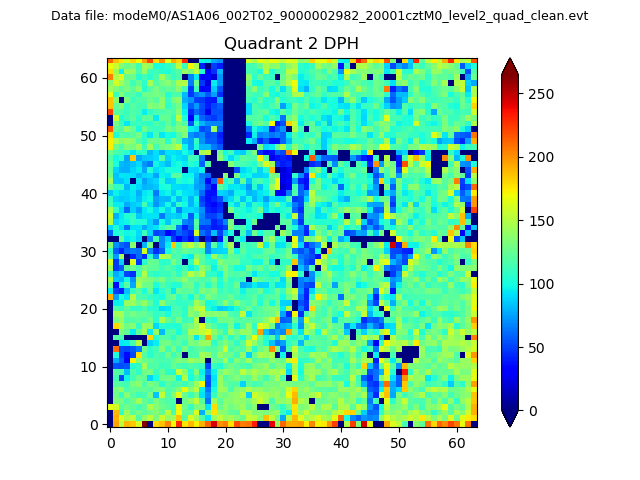
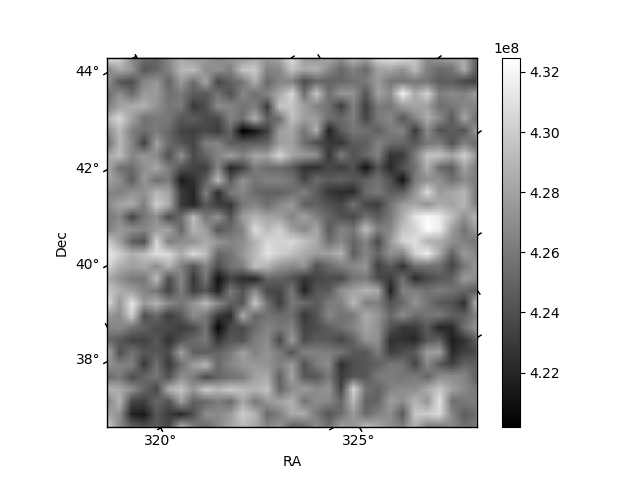
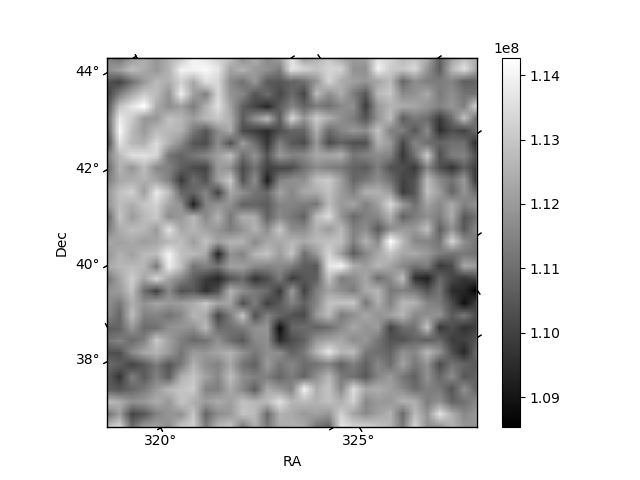
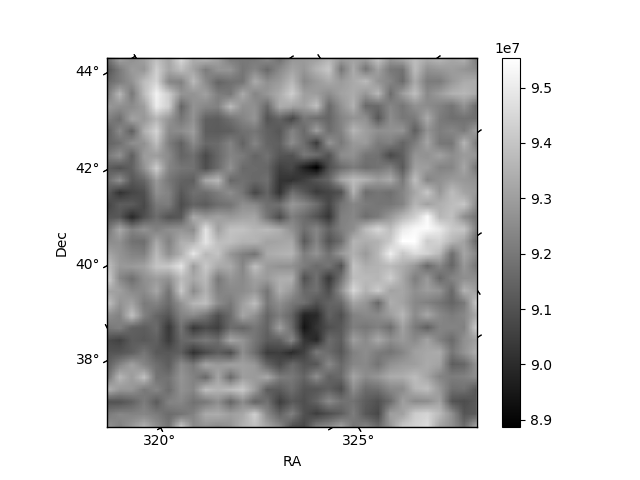
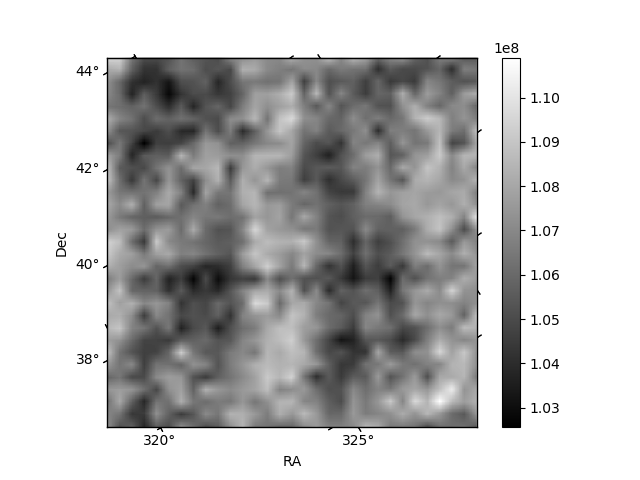
Histogram calculated using DETX and DETY for each event in the final _common_clean file
| Quadrant A | 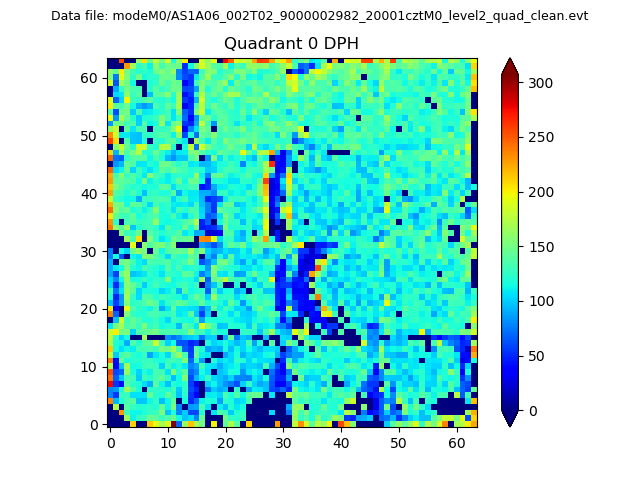 |
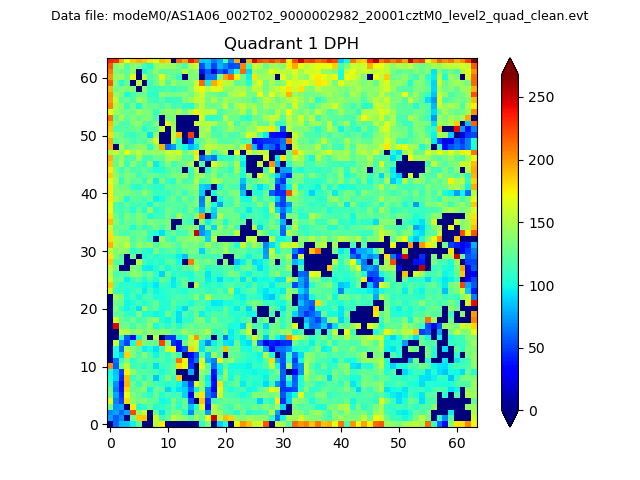 |
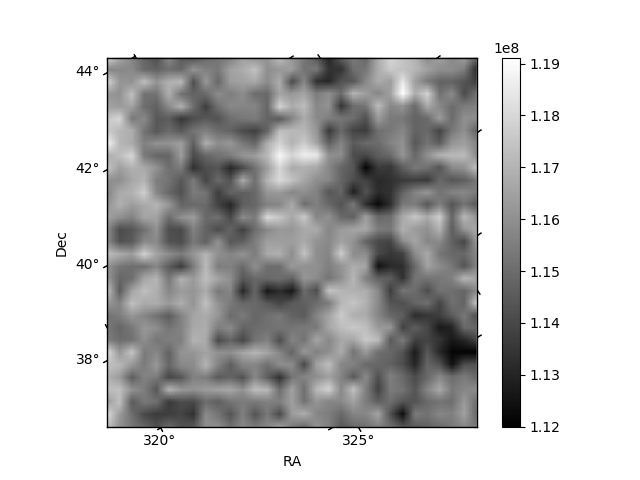
Quadrant B |
|---|---|---|---|
| Quadrant D | 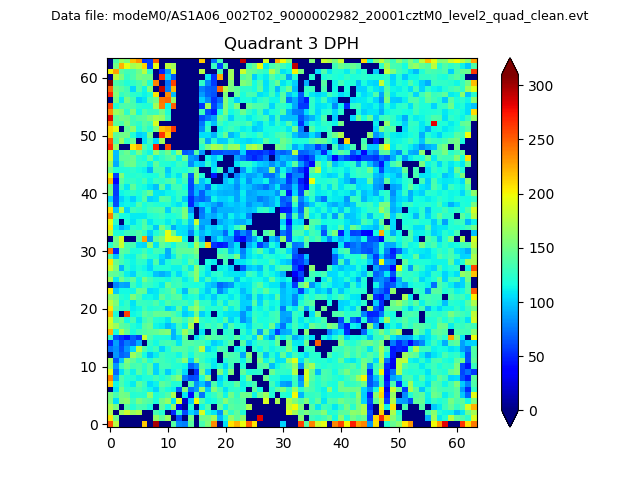 |
 |
Quadrant C |
| Plot type | Count rate plots | Images |
|---|---|---|
| Comparison with Poisson distribution Blue bars denote a histogram of data divided into 1 sec bins. Red curve is a Poisson curve with rate = median count rate of data. |
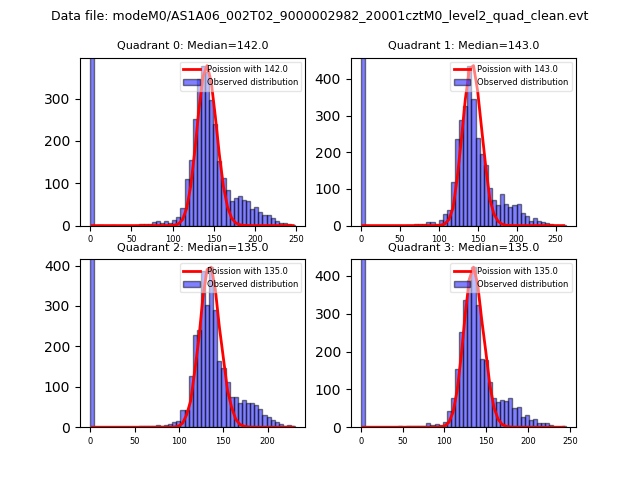 |
 |
| Quadrant-wise count rates Data is divided into 100 sec bins |
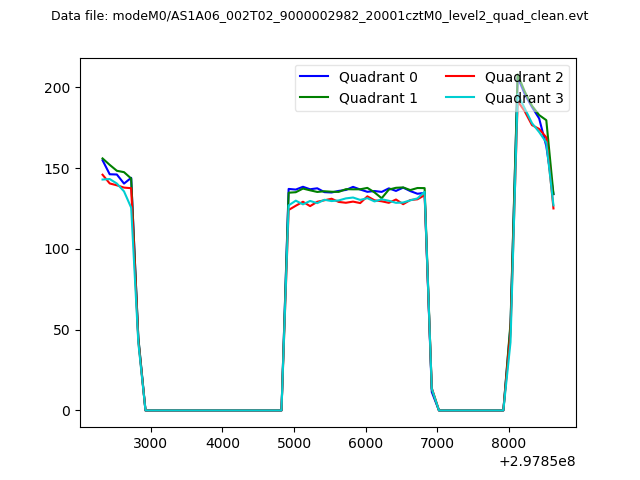 |
|
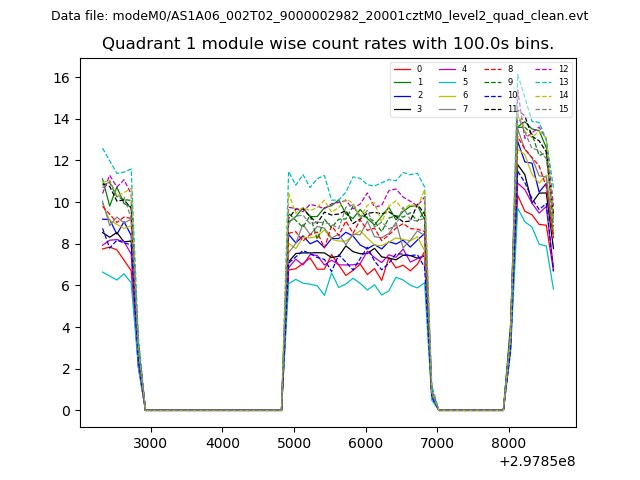
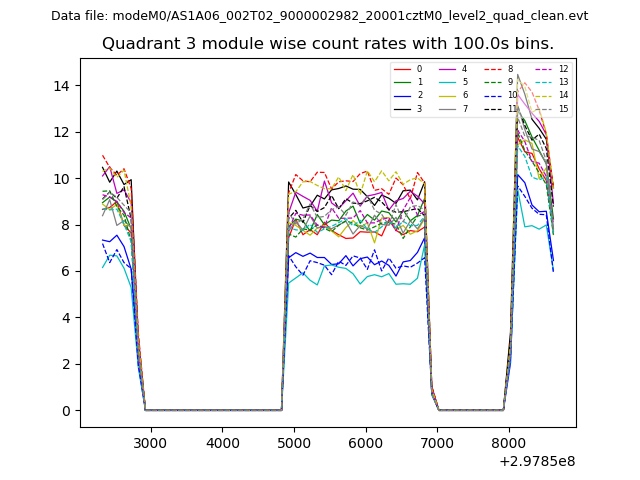
| Module-wise count rates for Quadrant A Data is divided into 100 sec bins |
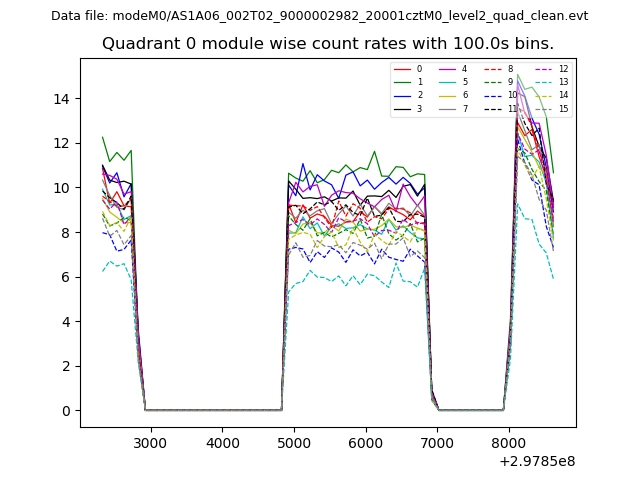 |
 |
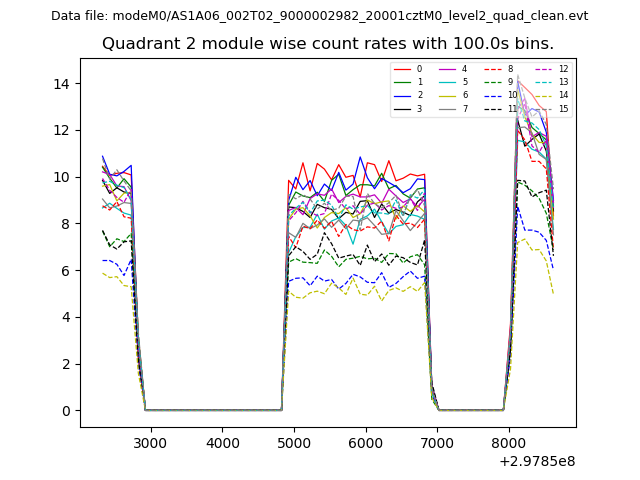
| Module-wise count rates for Quadrant B Data is divided into 100 sec bins |
 |
 |
| Module-wise count rates for Quadrant C Data is divided into 100 sec bins |
 |
 |
| Module-wise count rates for Quadrant D Data is divided into 100 sec bins |
 |
 |
| Parameter | Plot |
|---|---|
| CZT HV Monitor | 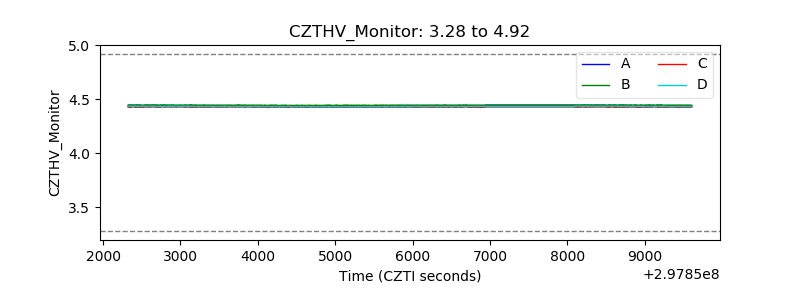 |
| D_VDD | 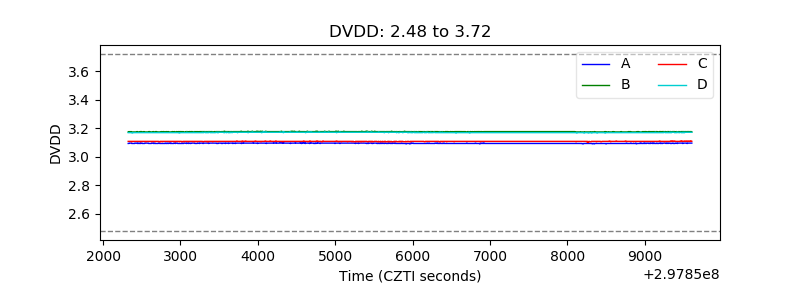 |
| Temperature 1 | 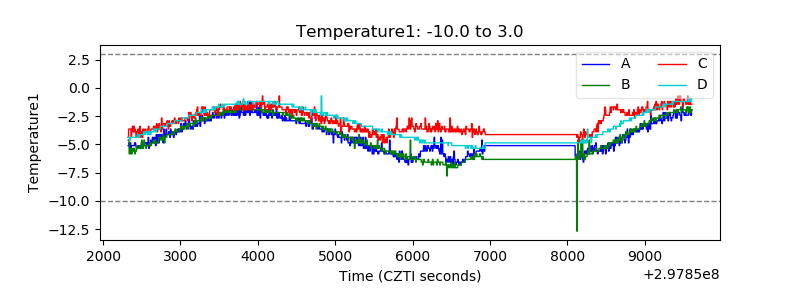 |
| Veto HV Monitor | 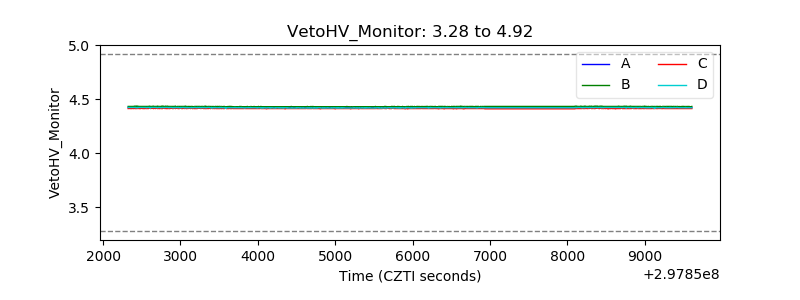 |
| Veto LLD | 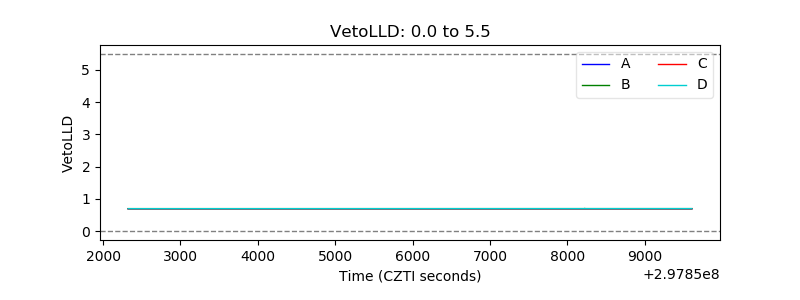 |
| Alpha Counter | 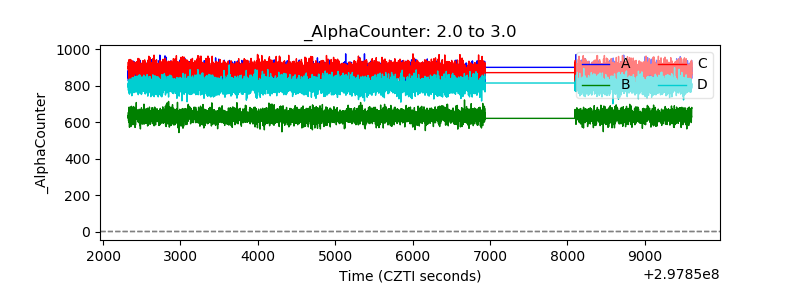 |
| _CPM_Rate | 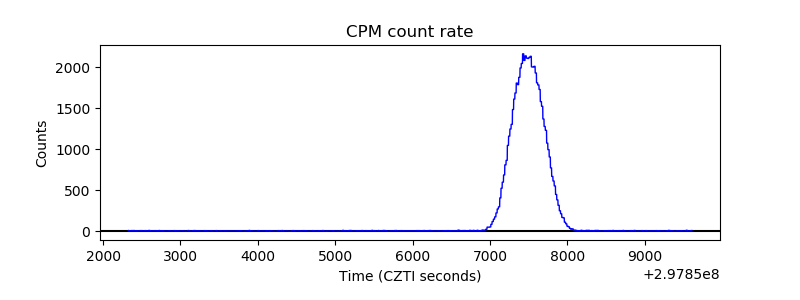 |
| CZT Counter | 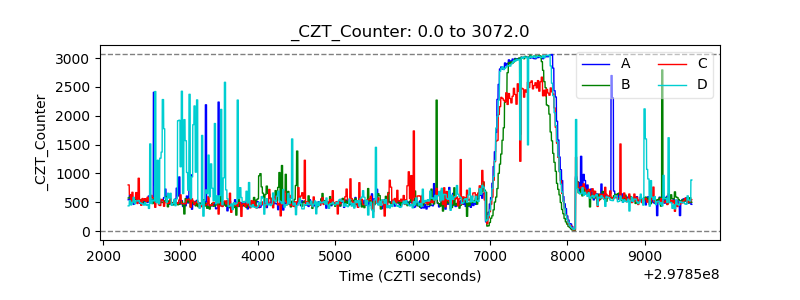 |
| +2.5 Volts monitor |  |
| +5 Volts monitor | 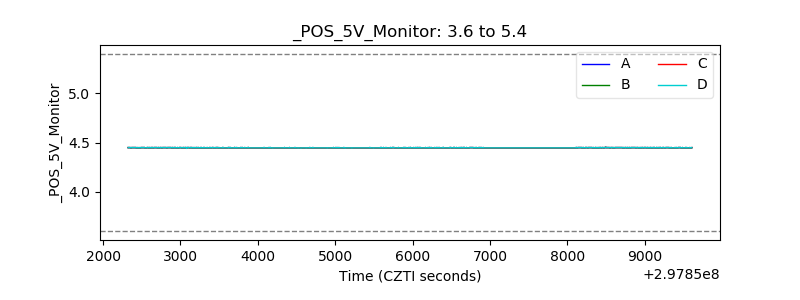 |
| _ROLL_ROT | 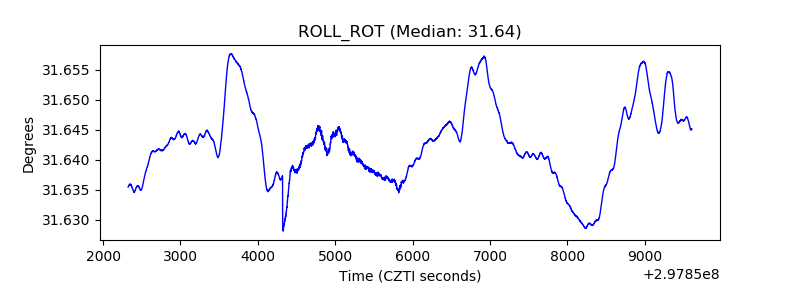 |
| _Roll_DEC | 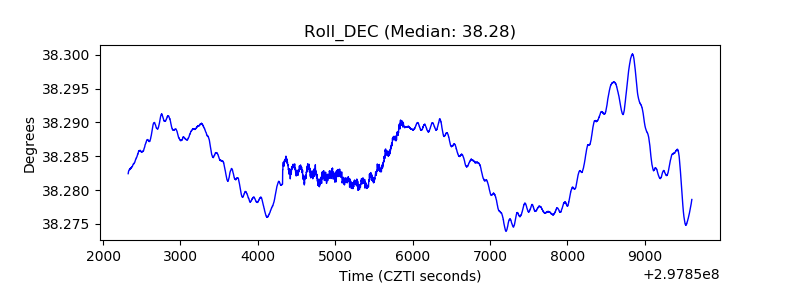 |
| _Roll_RA | 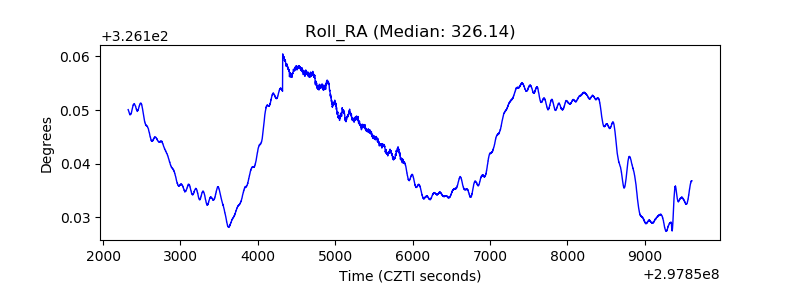 |
| Veto Counter | 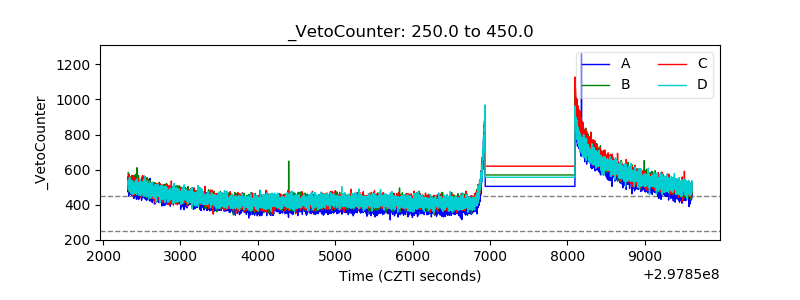 |