| Param | Original file | Final file |
|---|---|---|
| Filename | modeM0/AS1A06_002T02_9000002982_20003cztM0_level2.evt | modeM0/AS1A06_002T02_9000002982_20003cztM0_level2_quad_clean.evt |
| Size (bytes) | 585,673,920 | 70,536,960 |
| Size | 558.5 MB | 67.3 MB |
| Events in quadrant A | 4,076,111 | 426,907 |
| Events in quadrant B | 3,788,794 | 439,857 |
| Events in quadrant C | 3,712,591 | 416,980 |
| Events in quadrant D | 5,728,530 | 407,766 |
| Mode M9 | |||
|---|---|---|---|
| Quadrant | BADHDUFLAG | Total packets | Discarded packets |
| A | 0 | 18 | 0 |
| B | 0 | 19 | 0 |
| C | 0 | 19 | 0 |
| D | 0 | 19 | 0 |
| Mode SS | |||
|---|---|---|---|
| Quadrant | BADHDUFLAG | Total packets | Discarded packets |
| A | 0 | 128 | 0 |
| B | 0 | 128 | 0 |
| C | 0 | 128 | 0 |
| D | 0 | 128 | 0 |
| Mode M0 | |||
|---|---|---|---|
| Quadrant | BADHDUFLAG | Total packets | Discarded packets |
| A | 0 | 16243 | 2 |
| B | 0 | 15511 | 2 |
| C | 0 | 15166 | 2 |
| D | 0 | 21040 | 2 |
| Quadrant | Total seconds | Saturated seconds | Saturation percentage |
|---|---|---|---|
| A | 6368 | 249 | 3.910176% |
| B | 6368 | 133 | 2.088568% |
| C | 6368 | 127 | 1.994347% |
| D | 6368 | 872 | 13.693467% |
Noise dominated data is calculated using 1-second bins in cleaned event files. If a bin has >2000 counts, and if more than 50% of those come from <1% of pixels, then it is considered to be noise-dominated and hence unusable.
| Quadrant | # 1 sec bins | Bins with >0 counts | Bins with >2000 counts | High rate bins dominated by noise | Noise dominated (total time) | Noise dominated (detector-on time) | Marked lightcurve |
|---|---|---|---|---|---|---|---|
| A | 7703 | 6369 | 119 | 119 | 1.54% | 1.87% | 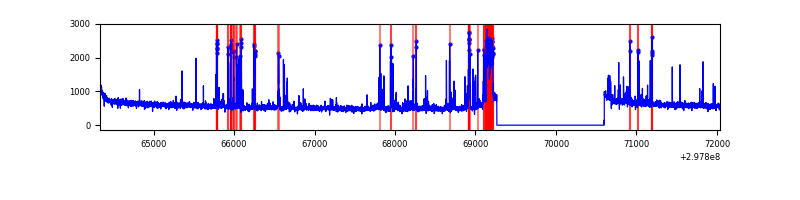 |
| B | 7703 | 6369 | 13 | 13 | 0.17% | 0.20% | 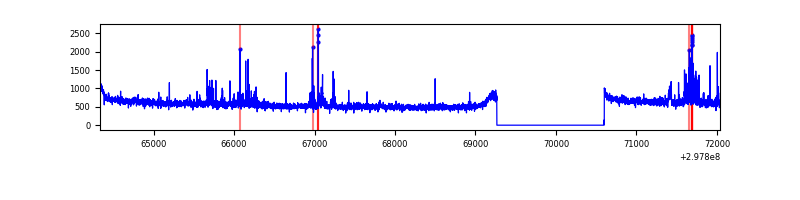 |
| C | 7703 | 6369 | 0 | 0 | 0.00% | 0.00% | 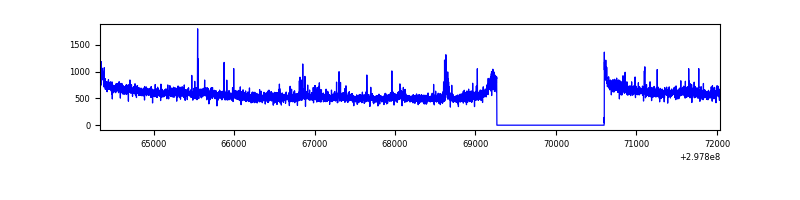 |
| D | 7703 | 6369 | 632 | 632 | 8.20% | 9.92% | 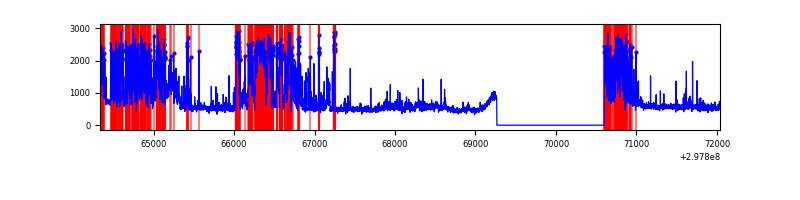 |
Top three noisy pixels from each quadrant. If the there are fewer than three noisy pixels in the level2.evt file, extra rows are filled as -1
| Pixel properties | Quadrant properties | ||||||
|---|---|---|---|---|---|---|---|
| Quadrant | DetID | PixID | Counts | Sigma | Mean | Median | Sigma |
| A | 14 | 238 | 290914 | 1625.11 | 907 | 894 | 178.5 |
| A | 5 | 16 | 279085 | 1558.83 | 907 | 894 | 178.5 |
| A | 13 | 252 | 10408 | 53.31 | 907 | 894 | 178.5 |
| B | 7 | 220 | 110262 | 652.58 | 903 | 885 | 167.6 |
| B | 0 | 245 | 29572 | 171.16 | 903 | 885 | 167.6 |
| B | 0 | 197 | 28659 | 165.71 | 903 | 885 | 167.6 |
| C | 14 | 238 | 141476 | 709.81 | 870 | 879 | 198.1 |
| C | 3 | 233 | 74571 | 372.04 | 870 | 879 | 198.1 |
| C | 0 | 207 | 67445 | 336.06 | 870 | 879 | 198.1 |
| D | 2 | 184 | 1038556 | 5146.49 | 846 | 824 | 201.6 |
| D | 12 | 218 | 1010005 | 5004.9 | 846 | 824 | 201.6 |
| D | 7 | 238 | 205612 | 1015.62 | 846 | 824 | 201.6 |
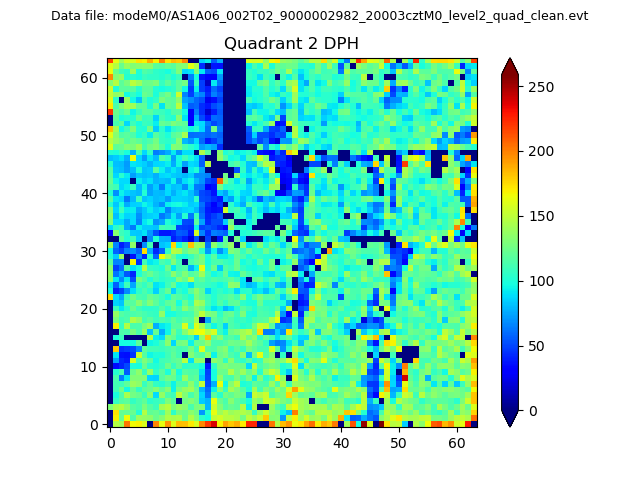
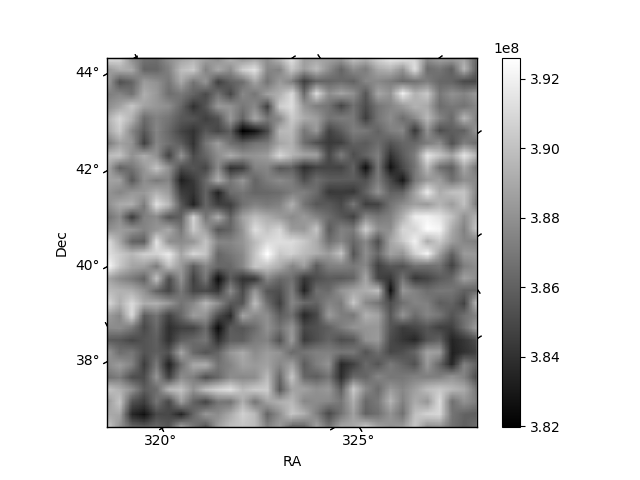
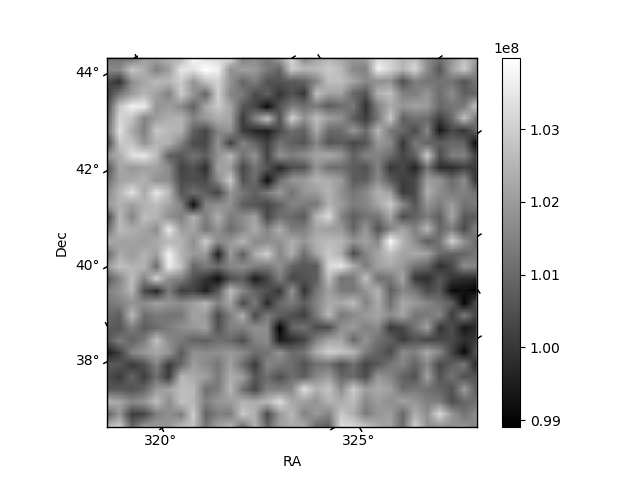
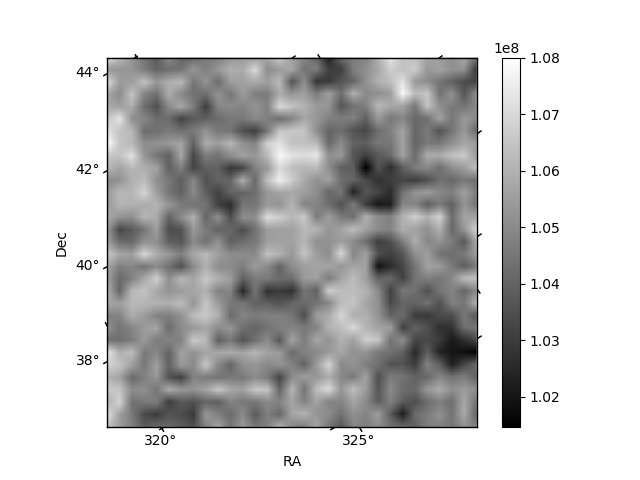
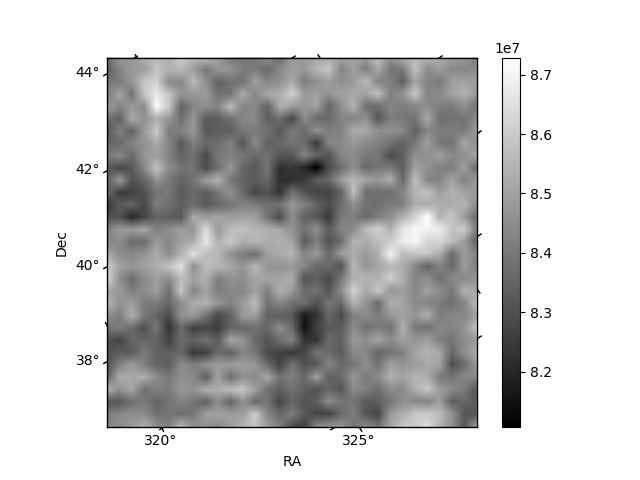
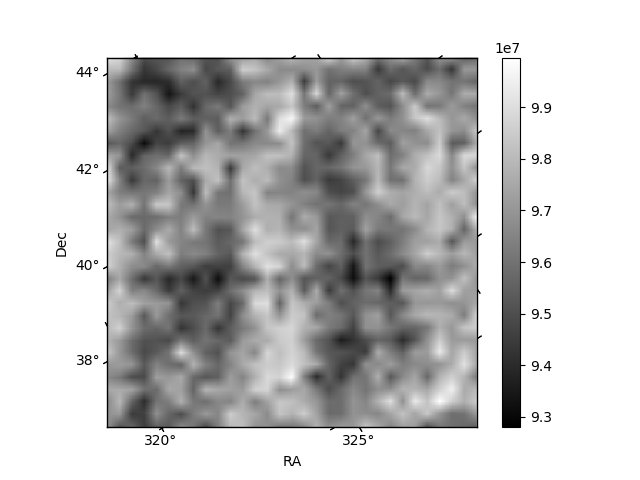
Histogram calculated using DETX and DETY for each event in the final _common_clean file
| Quadrant A | 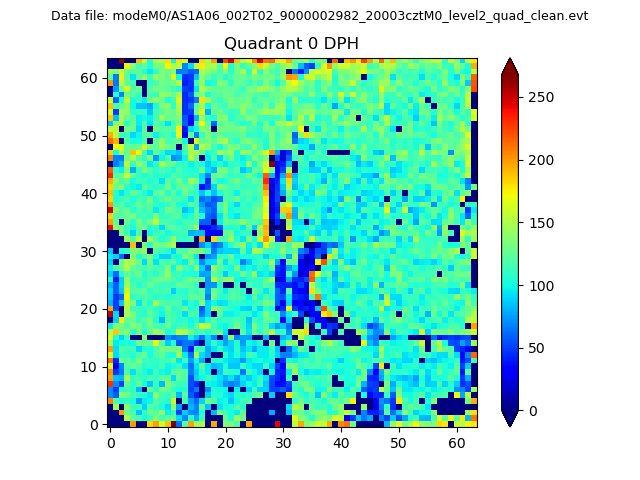 |
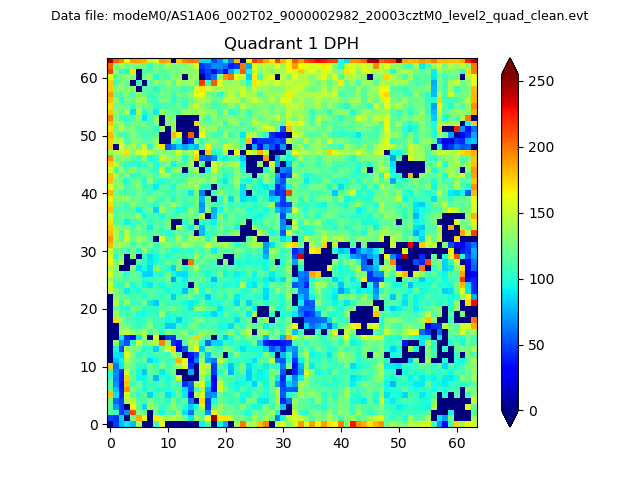 |
Quadrant B |
|---|---|---|---|
| Quadrant D | 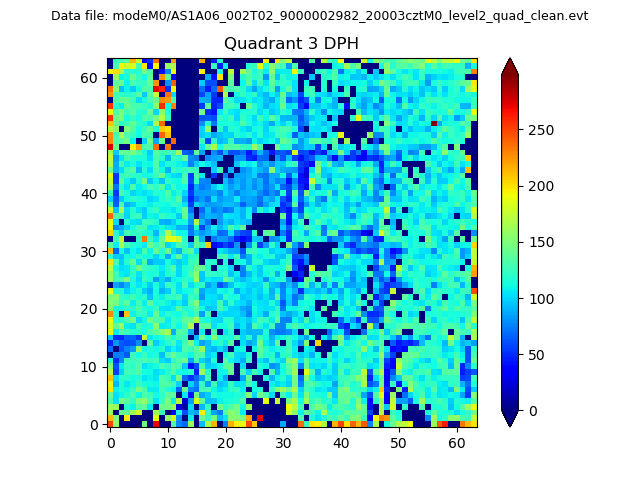 |
 |
Quadrant C |
| Plot type | Count rate plots | Images |
|---|---|---|
| Comparison with Poisson distribution Blue bars denote a histogram of data divided into 1 sec bins. Red curve is a Poisson curve with rate = median count rate of data. |
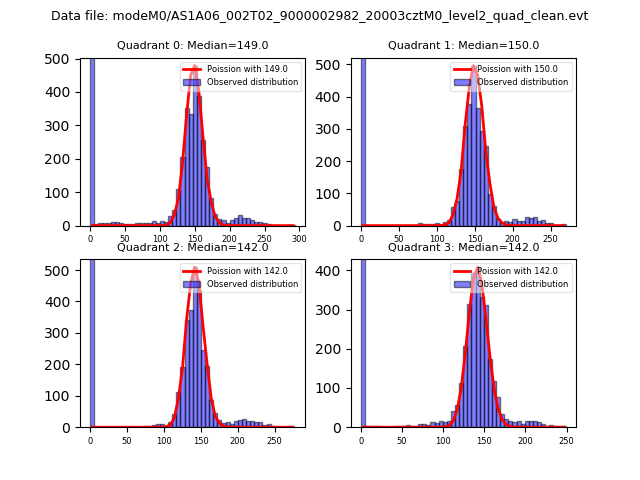 |
 |
| Quadrant-wise count rates Data is divided into 100 sec bins |
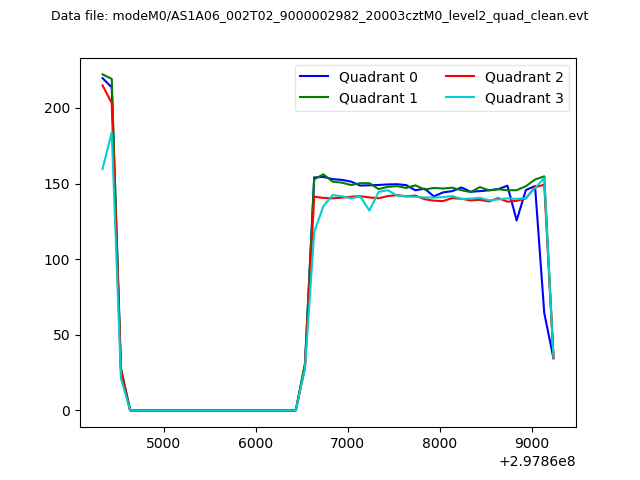 |
|
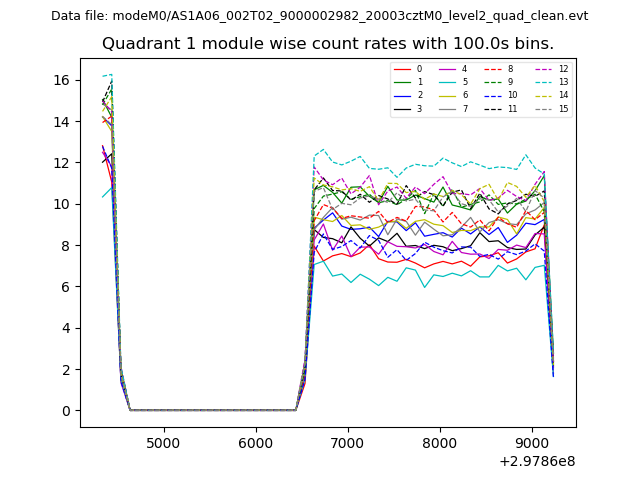
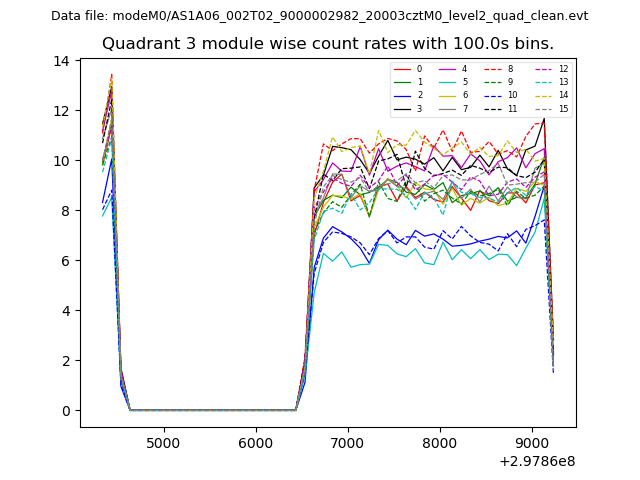
| Module-wise count rates for Quadrant A Data is divided into 100 sec bins |
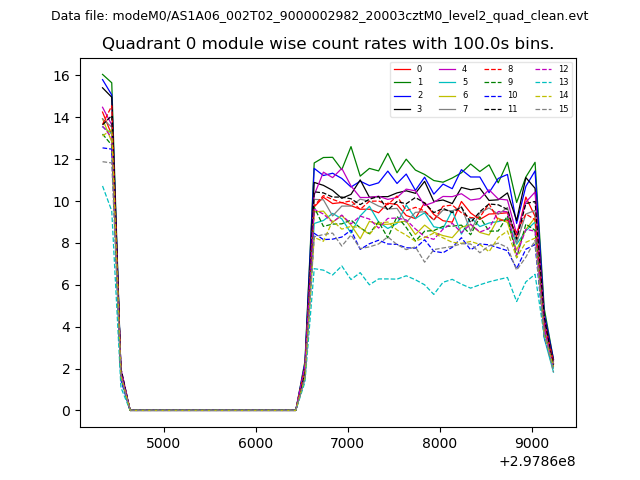 |
 |
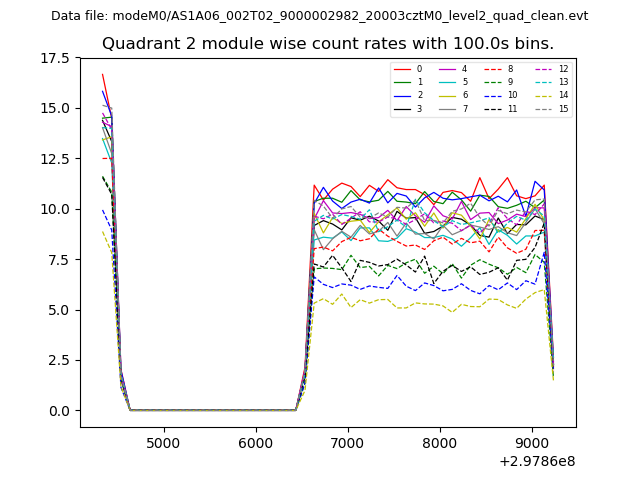
| Module-wise count rates for Quadrant B Data is divided into 100 sec bins |
 |
 |
| Module-wise count rates for Quadrant C Data is divided into 100 sec bins |
 |
 |
| Module-wise count rates for Quadrant D Data is divided into 100 sec bins |
 |
 |
| Parameter | Plot |
|---|---|
| CZT HV Monitor | 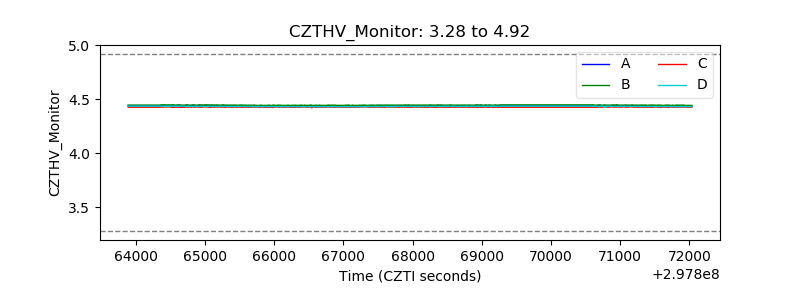 |
| D_VDD | 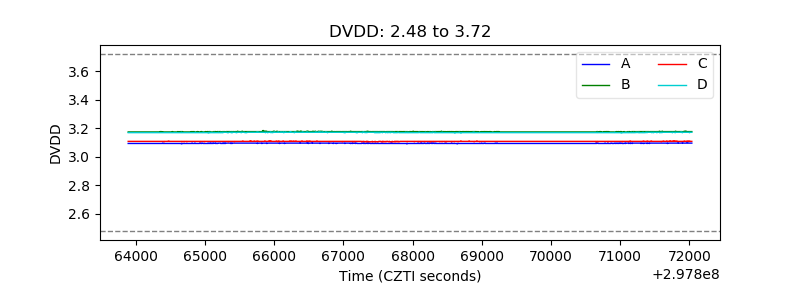 |
| Temperature 1 | 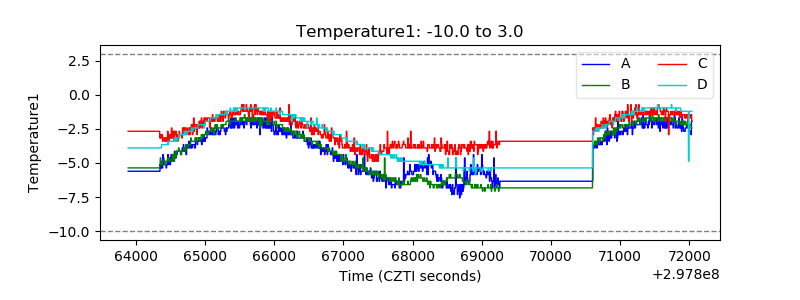 |
| Veto HV Monitor | 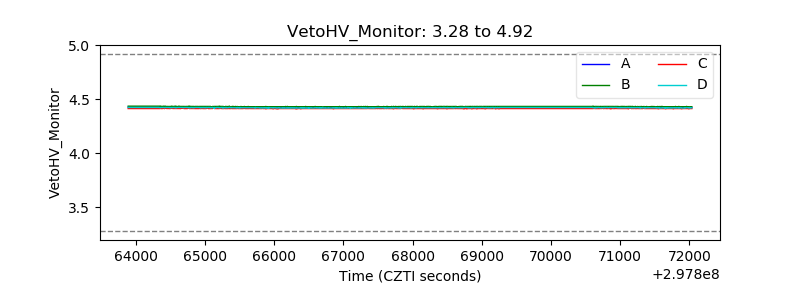 |
| Veto LLD | 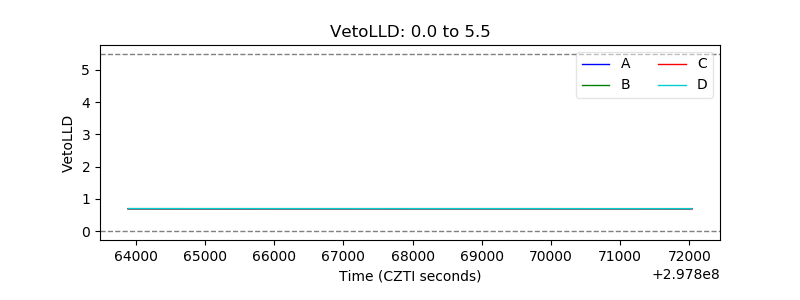 |
| Alpha Counter | 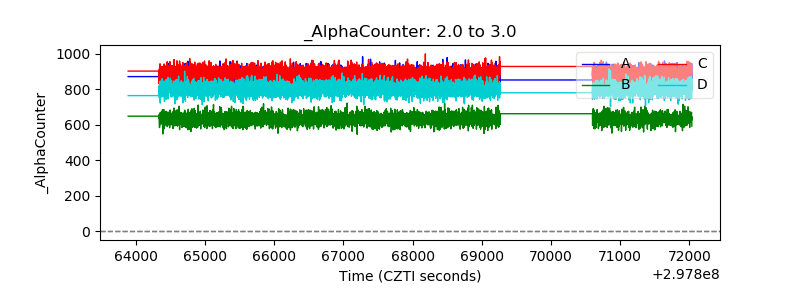 |
| _CPM_Rate | 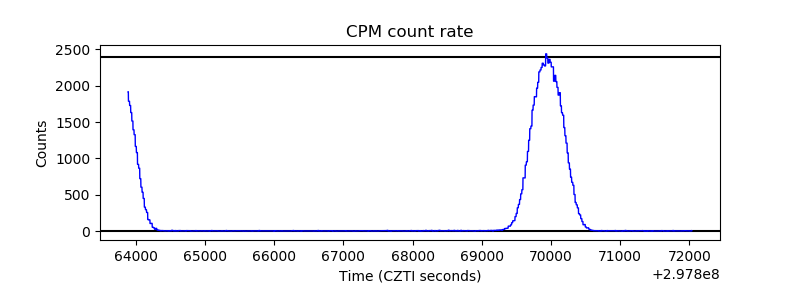 |
| CZT Counter | 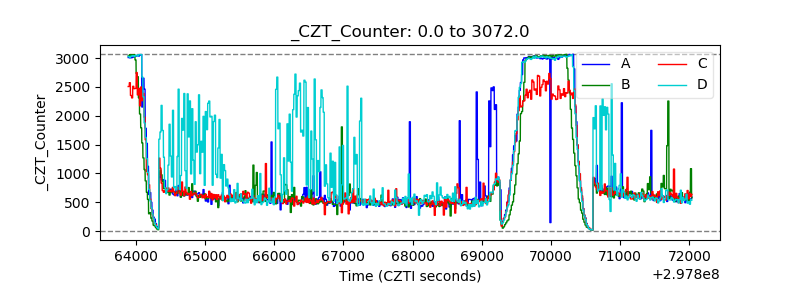 |
| +2.5 Volts monitor | 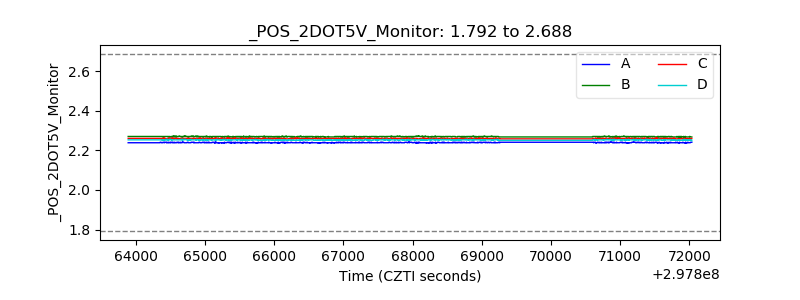 |
| +5 Volts monitor | 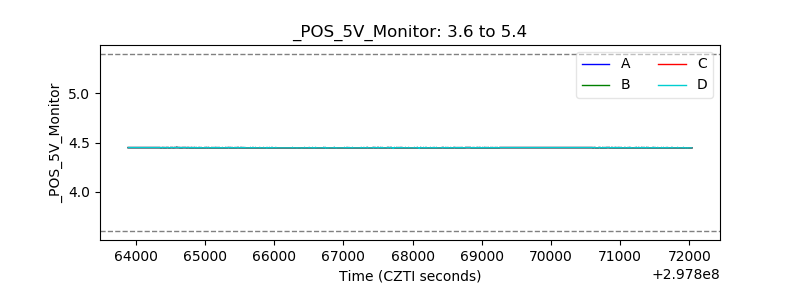 |
| _ROLL_ROT | 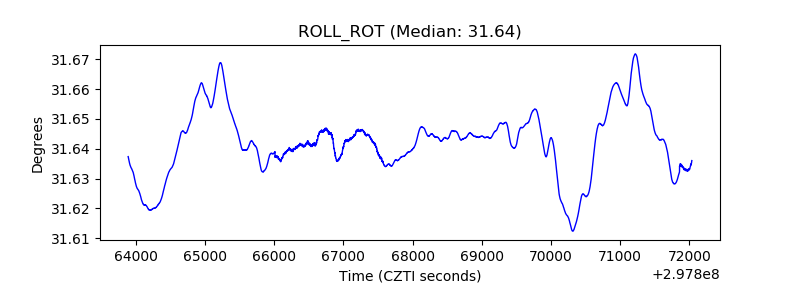 |
| _Roll_DEC | 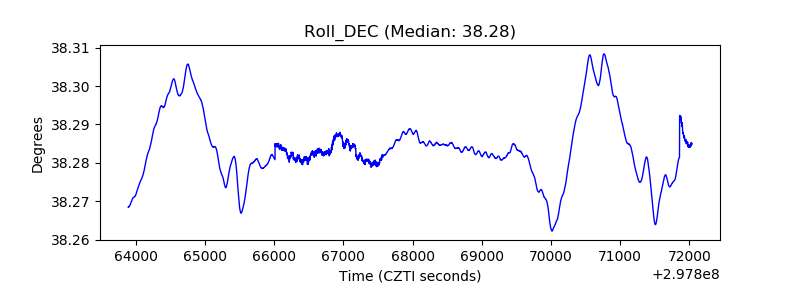 |
| _Roll_RA | 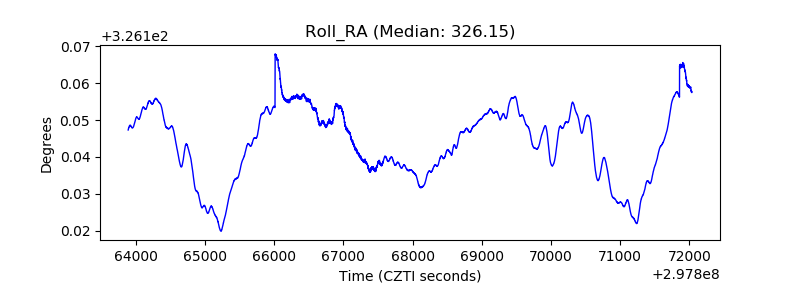 |
| Veto Counter | 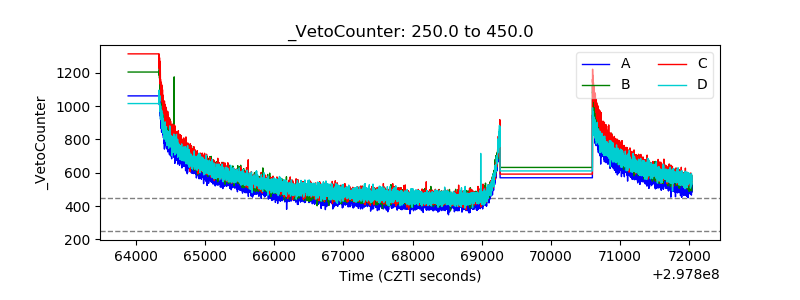 |