| Param | Original file | Final file |
|---|---|---|
| Filename | modeM0/AS1A06_002T02_9000002982_20005cztM0_level2.evt | modeM0/AS1A06_002T02_9000002982_20005cztM0_level2_quad_clean.evt |
| Size (bytes) | 481,936,320 | 84,574,080 |
| Size | 459.6 MB | 80.7 MB |
| Events in quadrant A | 3,486,510 | 540,501 |
| Events in quadrant B | 3,638,512 | 541,287 |
| Events in quadrant C | 3,493,053 | 521,371 |
| Events in quadrant D | 3,553,565 | 522,113 |
| Mode M9 | |||
|---|---|---|---|
| Quadrant | BADHDUFLAG | Total packets | Discarded packets |
| A | 0 | 22 | 0 |
| B | 0 | 23 | 0 |
| C | 0 | 23 | 0 |
| D | 0 | 23 | 0 |
| Mode SS | |||
|---|---|---|---|
| Quadrant | BADHDUFLAG | Total packets | Discarded packets |
| A | 0 | 126 | 0 |
| B | 0 | 126 | 0 |
| C | 0 | 126 | 0 |
| D | 0 | 126 | 0 |
| Mode M0 | |||
|---|---|---|---|
| Quadrant | BADHDUFLAG | Total packets | Discarded packets |
| A | 0 | 14264 | 2 |
| B | 0 | 14961 | 2 |
| C | 0 | 14266 | 2 |
| D | 0 | 14536 | 2 |
| Quadrant | Total seconds | Saturated seconds | Saturation percentage |
|---|---|---|---|
| A | 6246 | 111 | 1.777137% |
| B | 6246 | 168 | 2.689721% |
| C | 6246 | 136 | 2.177394% |
| D | 6246 | 148 | 2.369516% |
Noise dominated data is calculated using 1-second bins in cleaned event files. If a bin has >2000 counts, and if more than 50% of those come from <1% of pixels, then it is considered to be noise-dominated and hence unusable.
| Quadrant | # 1 sec bins | Bins with >0 counts | Bins with >2000 counts | High rate bins dominated by noise | Noise dominated (total time) | Noise dominated (detector-on time) | Marked lightcurve |
|---|---|---|---|---|---|---|---|
| A | 7511 | 6248 | 22 | 22 | 0.29% | 0.35% | 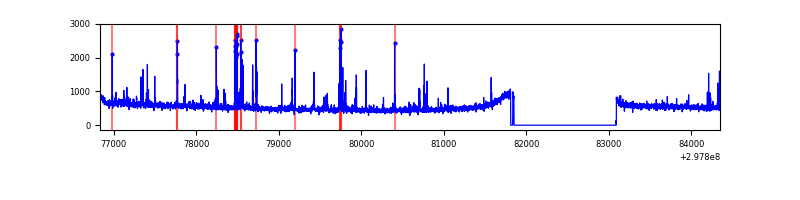 |
| B | 7511 | 6248 | 35 | 35 | 0.47% | 0.56% | 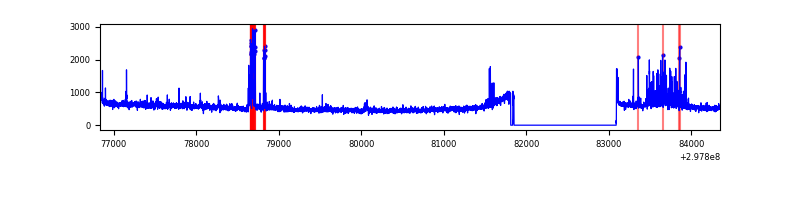 |
| C | 7511 | 6248 | 0 | 0 | 0.00% | 0.00% | 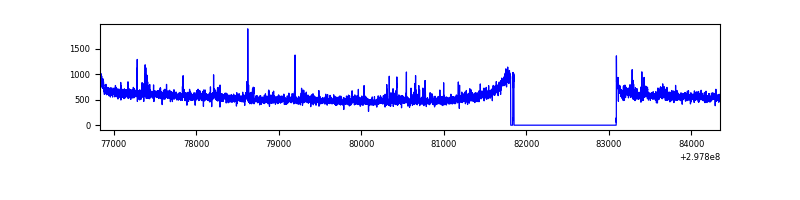 |
| D | 7511 | 6248 | 23 | 23 | 0.31% | 0.37% | 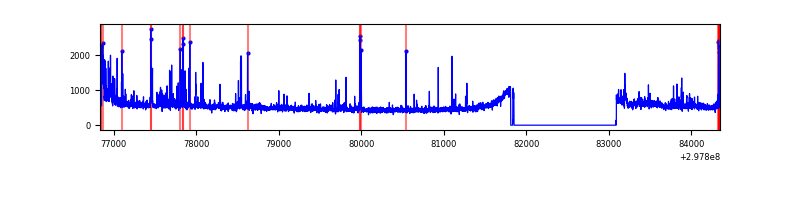 |
Top three noisy pixels from each quadrant. If the there are fewer than three noisy pixels in the level2.evt file, extra rows are filled as -1
| Pixel properties | Quadrant properties | ||||||
|---|---|---|---|---|---|---|---|
| Quadrant | DetID | PixID | Counts | Sigma | Mean | Median | Sigma |
| A | 14 | 238 | 172009 | 1005.56 | 852 | 838 | 170.2 |
| A | 14 | 254 | 34380 | 197.05 | 852 | 838 | 170.2 |
| A | 0 | 226 | 7527 | 39.3 | 852 | 838 | 170.2 |
| B | 7 | 220 | 206965 | 1327.32 | 841 | 823 | 155.3 |
| B | 0 | 197 | 20762 | 128.38 | 841 | 823 | 155.3 |
| B | 12 | 111 | 18160 | 111.63 | 841 | 823 | 155.3 |
| C | 14 | 238 | 128926 | 677.06 | 820 | 829 | 189.2 |
| C | 0 | 207 | 97865 | 512.88 | 820 | 829 | 189.2 |
| C | 3 | 233 | 53910 | 280.56 | 820 | 829 | 189.2 |
| D | 1 | 52 | 239280 | 1191.17 | 833 | 813 | 200.2 |
| D | 12 | 218 | 68780 | 339.5 | 833 | 813 | 200.2 |
| D | 7 | 96 | 42117 | 206.32 | 833 | 813 | 200.2 |
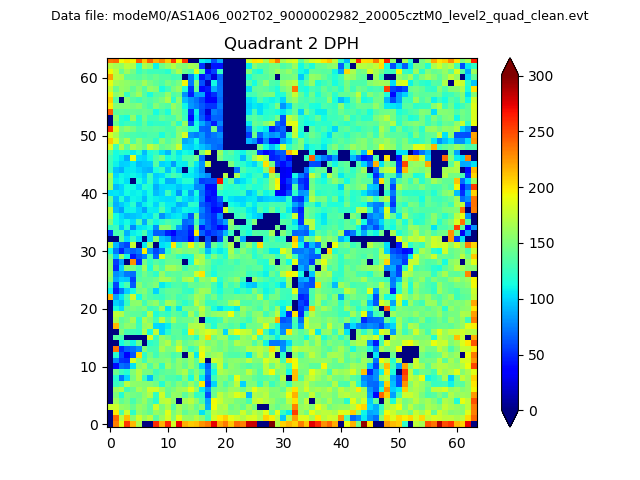
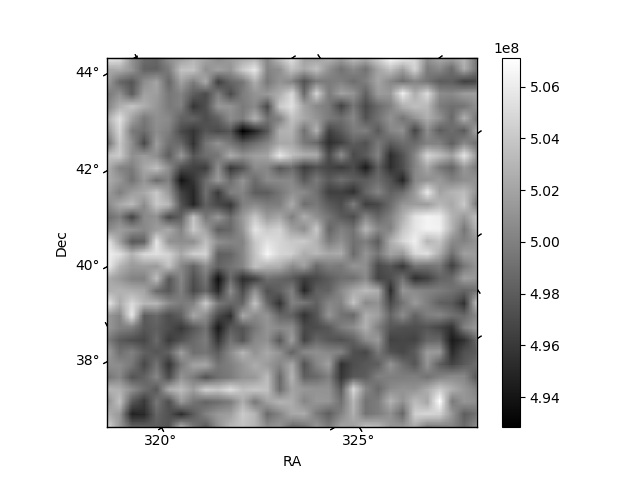
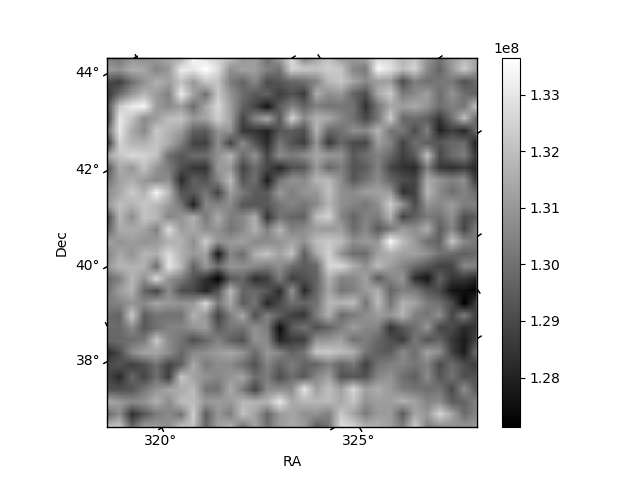
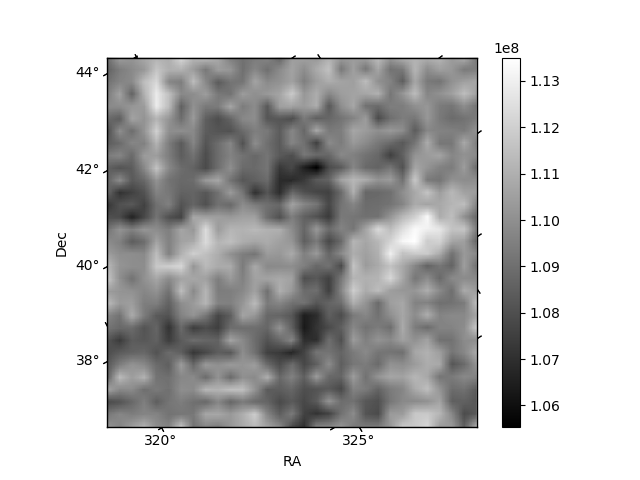
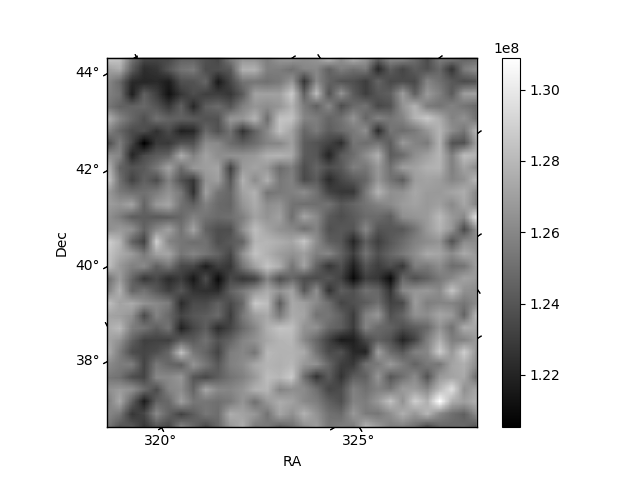
Histogram calculated using DETX and DETY for each event in the final _common_clean file
| Quadrant A | 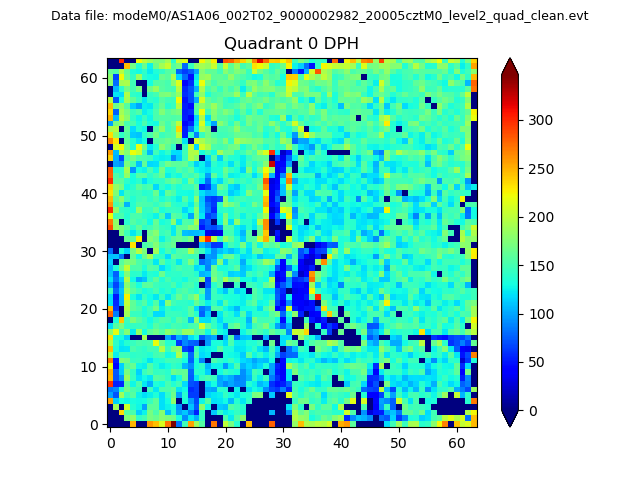 |
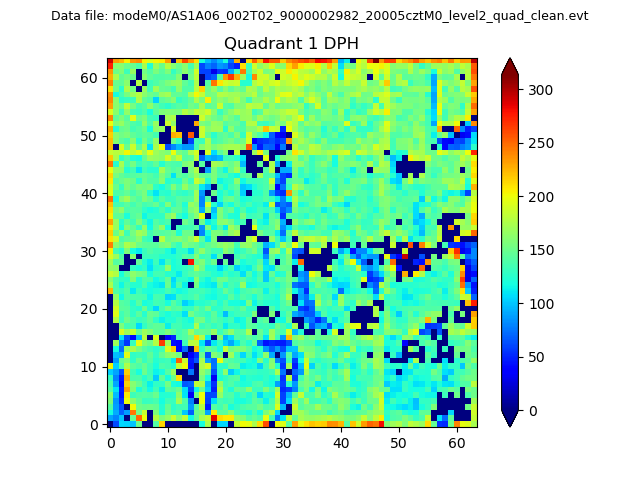 |
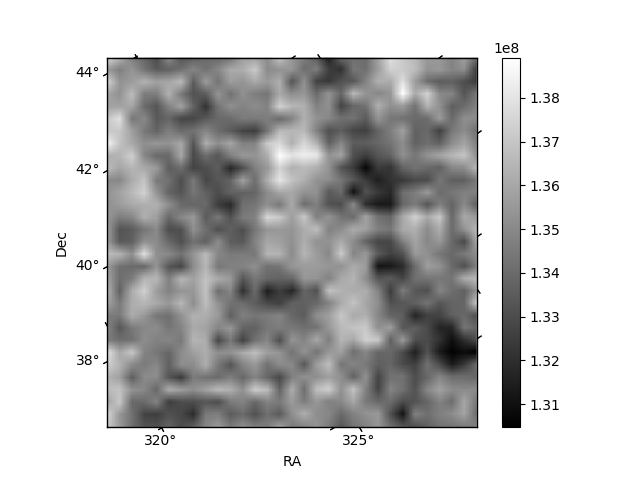
Quadrant B |
|---|---|---|---|
| Quadrant D | 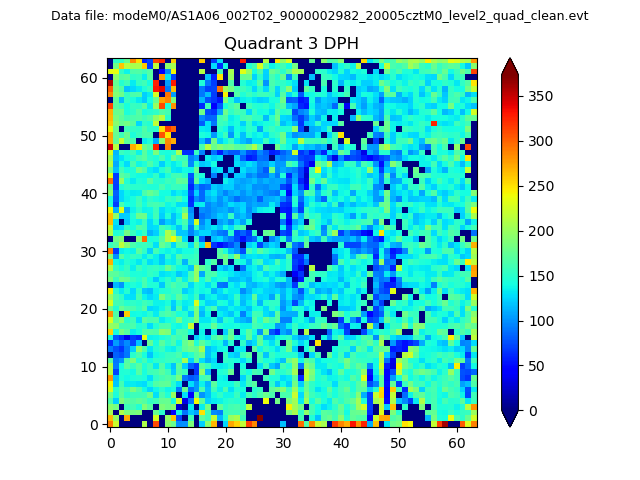 |
 |
Quadrant C |
| Plot type | Count rate plots | Images |
|---|---|---|
| Comparison with Poisson distribution Blue bars denote a histogram of data divided into 1 sec bins. Red curve is a Poisson curve with rate = median count rate of data. |
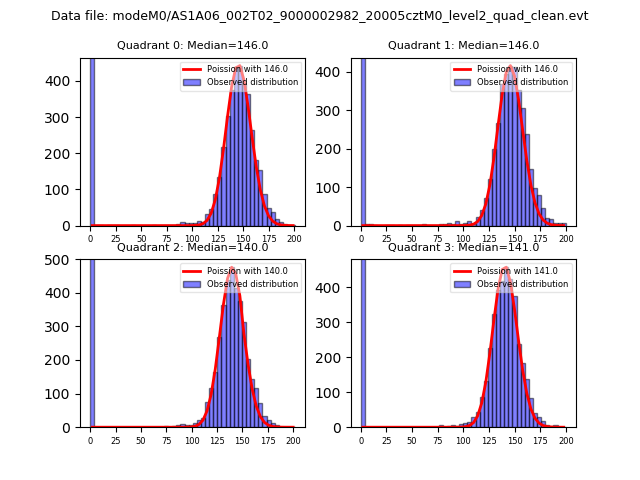 |
 |
| Quadrant-wise count rates Data is divided into 100 sec bins |
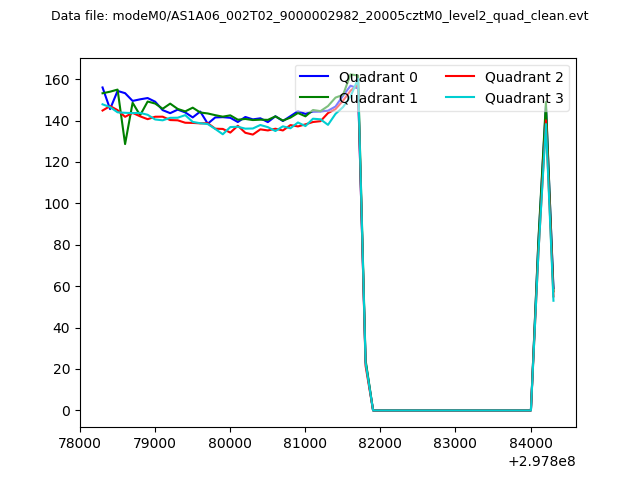 |
|
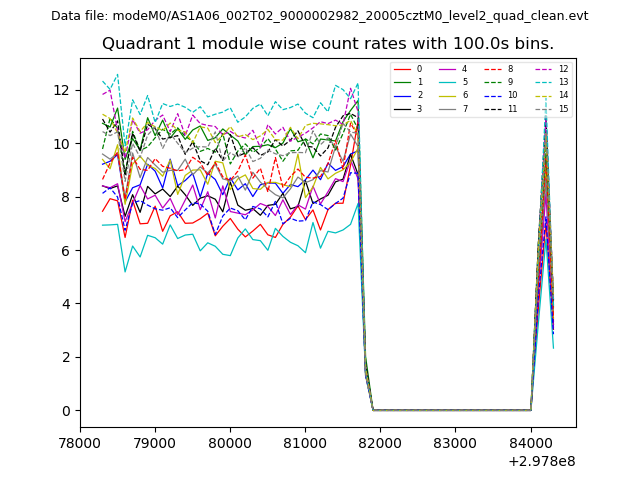
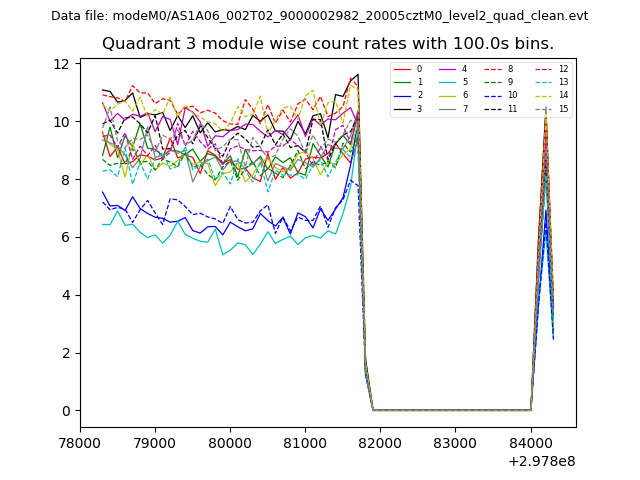
| Module-wise count rates for Quadrant A Data is divided into 100 sec bins |
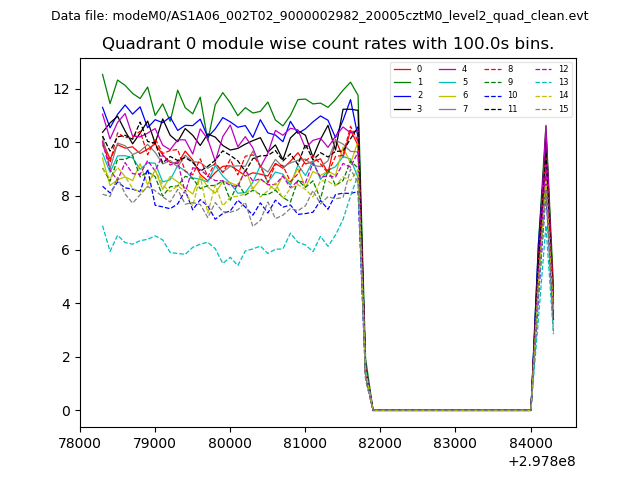 |
 |
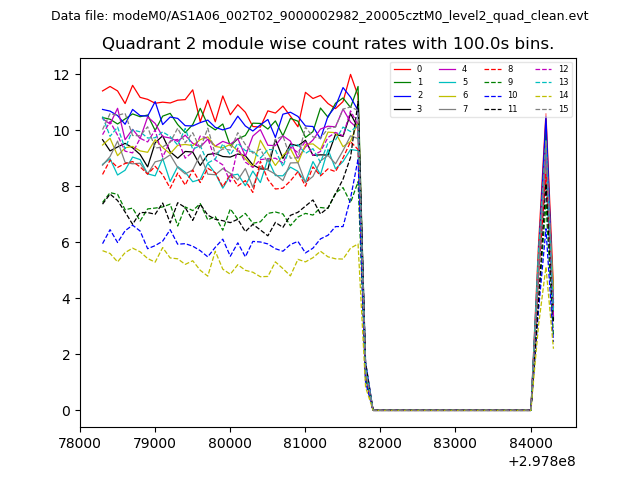
| Module-wise count rates for Quadrant B Data is divided into 100 sec bins |
 |
 |
| Module-wise count rates for Quadrant C Data is divided into 100 sec bins |
 |
 |
| Module-wise count rates for Quadrant D Data is divided into 100 sec bins |
 |
 |
| Parameter | Plot |
|---|---|
| CZT HV Monitor |  |
| D_VDD | 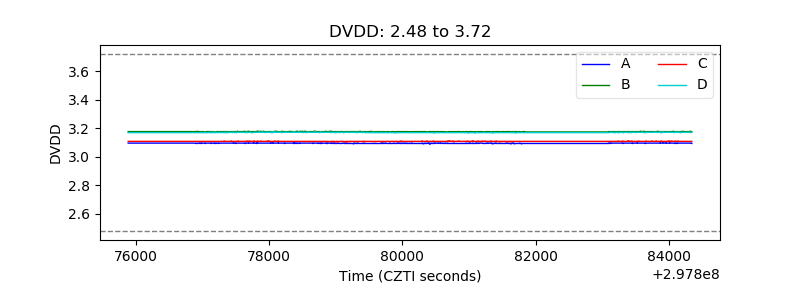 |
| Temperature 1 | 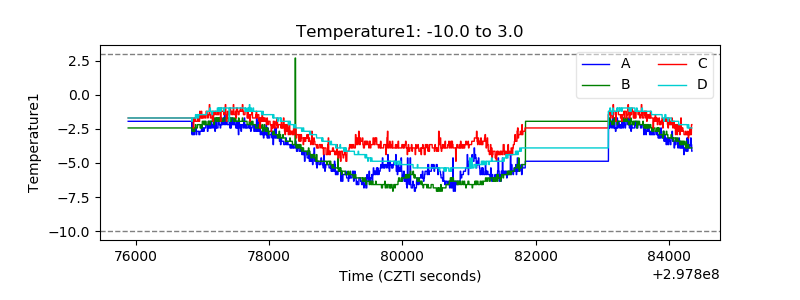 |
| Veto HV Monitor | 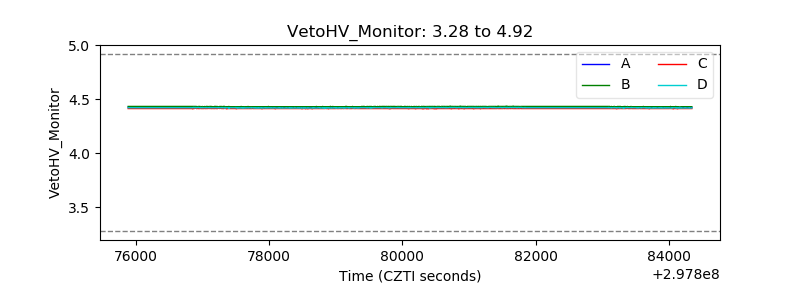 |
| Veto LLD | 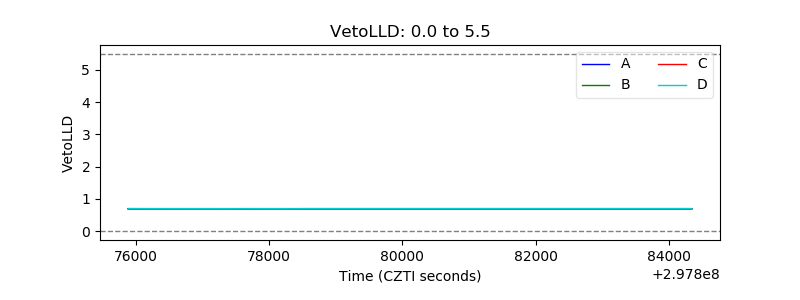 |
| Alpha Counter | 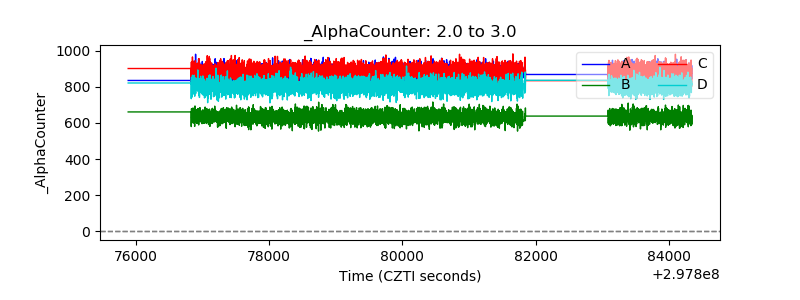 |
| _CPM_Rate | 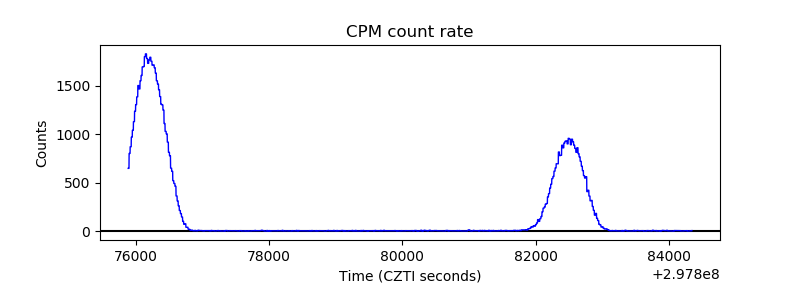 |
| CZT Counter | 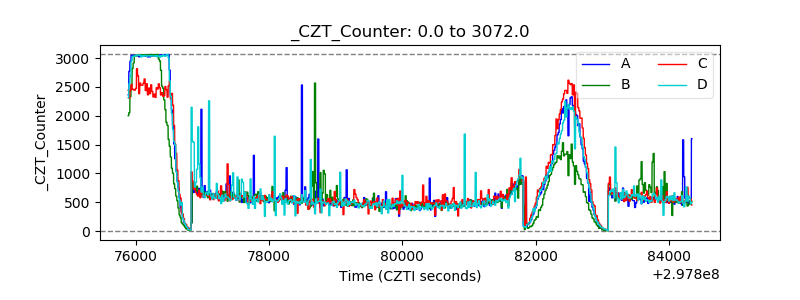 |
| +2.5 Volts monitor | 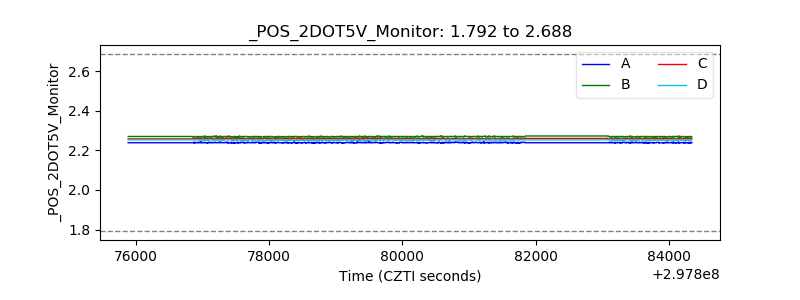 |
| +5 Volts monitor | 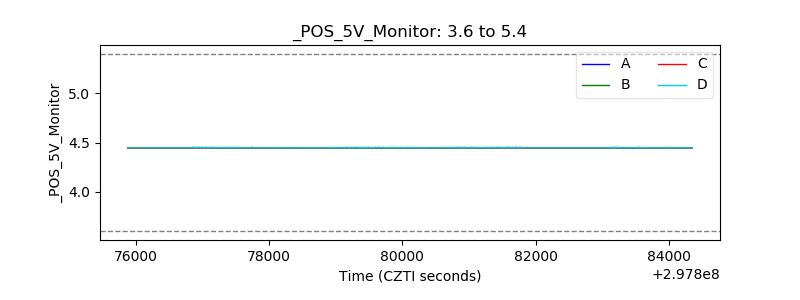 |
| _ROLL_ROT | 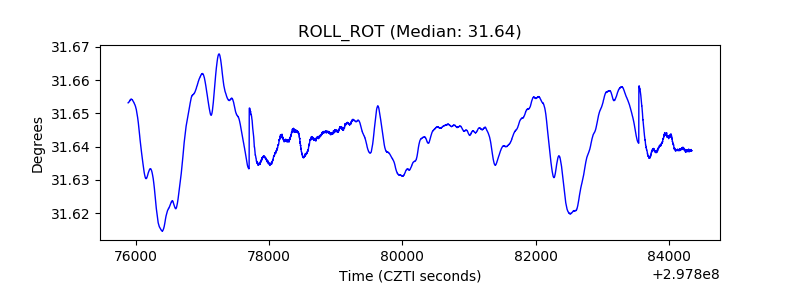 |
| _Roll_DEC | 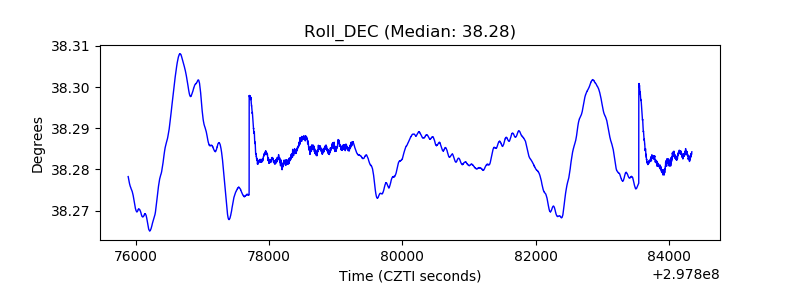 |
| _Roll_RA | 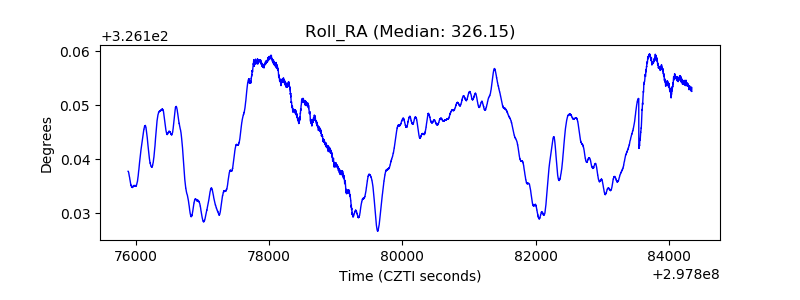 |
| Veto Counter | 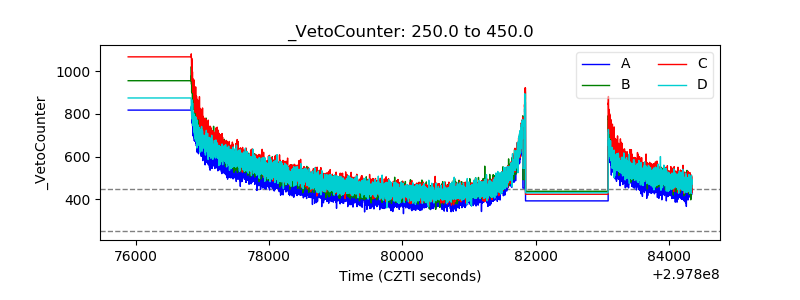 |