| Param | Original file | Final file |
|---|---|---|
| Filename | modeM0/AS1A06_002T02_9000002982_20006cztM0_level2.evt | modeM0/AS1A06_002T02_9000002982_20006cztM0_level2_quad_clean.evt |
| Size (bytes) | 516,093,120 | 93,476,160 |
| Size | 492.2 MB | 89.1 MB |
| Events in quadrant A | 3,827,203 | 598,693 |
| Events in quadrant B | 3,594,913 | 610,749 |
| Events in quadrant C | 3,530,834 | 586,070 |
| Events in quadrant D | 4,229,085 | 575,150 |
| Mode M9 | |||
|---|---|---|---|
| Quadrant | BADHDUFLAG | Total packets | Discarded packets |
| A | 0 | 12 | 0 |
| B | 0 | 13 | 0 |
| C | 0 | 13 | 0 |
| D | 0 | 13 | 0 |
| Mode SS | |||
|---|---|---|---|
| Quadrant | BADHDUFLAG | Total packets | Discarded packets |
| A | 0 | 132 | 0 |
| B | 0 | 132 | 0 |
| C | 0 | 132 | 0 |
| D | 0 | 132 | 0 |
| Mode M0 | |||
|---|---|---|---|
| Quadrant | BADHDUFLAG | Total packets | Discarded packets |
| A | 0 | 15480 | 2 |
| B | 0 | 14922 | 3 |
| C | 0 | 14526 | 2 |
| D | 0 | 16966 | 2 |
| Quadrant | Total seconds | Saturated seconds | Saturation percentage |
|---|---|---|---|
| A | 6605 | 186 | 2.816048% |
| B | 6604 | 138 | 2.089643% |
| C | 6604 | 146 | 2.210781% |
| D | 6604 | 399 | 6.041793% |
Noise dominated data is calculated using 1-second bins in cleaned event files. If a bin has >2000 counts, and if more than 50% of those come from <1% of pixels, then it is considered to be noise-dominated and hence unusable.
| Quadrant | # 1 sec bins | Bins with >0 counts | Bins with >2000 counts | High rate bins dominated by noise | Noise dominated (total time) | Noise dominated (detector-on time) | Marked lightcurve |
|---|---|---|---|---|---|---|---|
| A | 7555 | 6606 | 92 | 92 | 1.22% | 1.39% | 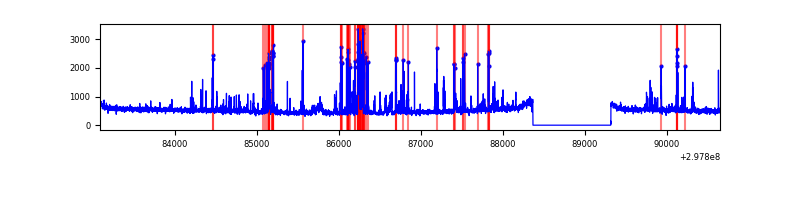 |
| B | 7554 | 6605 | 17 | 17 | 0.23% | 0.26% | 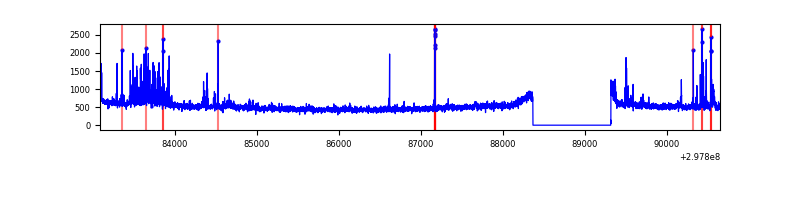 |
| C | 7554 | 6605 | 3 | 3 | 0.04% | 0.05% | 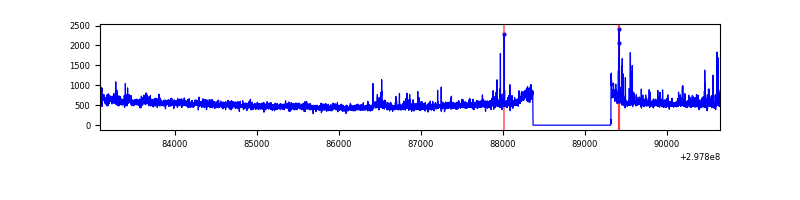 |
| D | 7554 | 6605 | 222 | 222 | 2.94% | 3.36% | 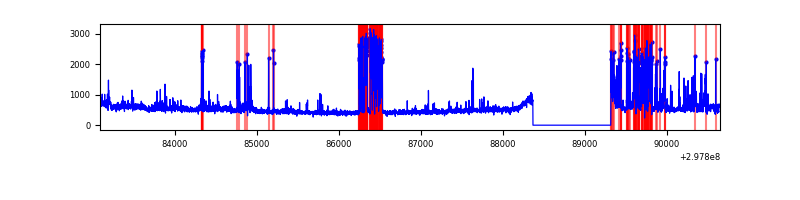 |
Top three noisy pixels from each quadrant. If the there are fewer than three noisy pixels in the level2.evt file, extra rows are filled as -1
| Pixel properties | Quadrant properties | ||||||
|---|---|---|---|---|---|---|---|
| Quadrant | DetID | PixID | Counts | Sigma | Mean | Median | Sigma |
| A | 14 | 238 | 402645 | 2379.51 | 841 | 824 | 168.9 |
| A | 14 | 254 | 165581 | 975.66 | 841 | 824 | 168.9 |
| A | 13 | 252 | 21552 | 122.75 | 841 | 824 | 168.9 |
| B | 7 | 220 | 142039 | 890.39 | 839 | 819 | 158.6 |
| B | 0 | 245 | 30382 | 186.39 | 839 | 819 | 158.6 |
| B | 4 | 171 | 29268 | 179.37 | 839 | 819 | 158.6 |
| C | 14 | 238 | 127827 | 673.76 | 815 | 822 | 188.5 |
| C | 0 | 207 | 121526 | 640.34 | 815 | 822 | 188.5 |
| C | 9 | 221 | 50831 | 265.3 | 815 | 822 | 188.5 |
| D | 1 | 52 | 635130 | 3240.02 | 811 | 788 | 195.8 |
| D | 12 | 218 | 404688 | 2063.0 | 811 | 788 | 195.8 |
| D | 12 | 250 | 29394 | 146.11 | 811 | 788 | 195.8 |
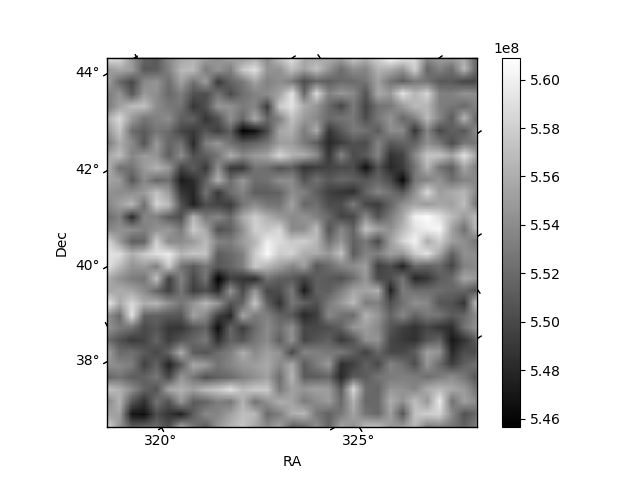
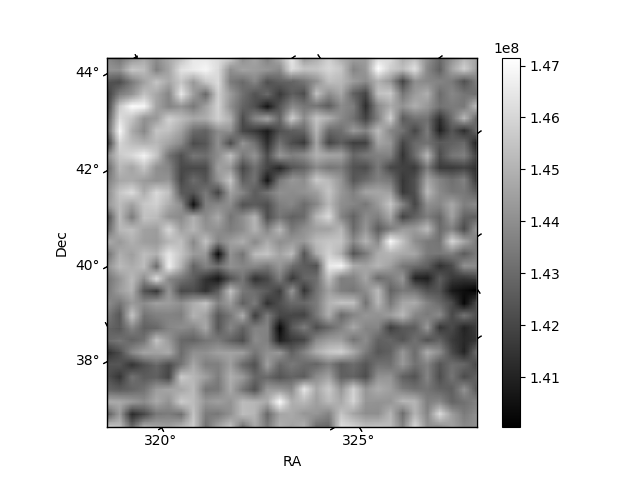
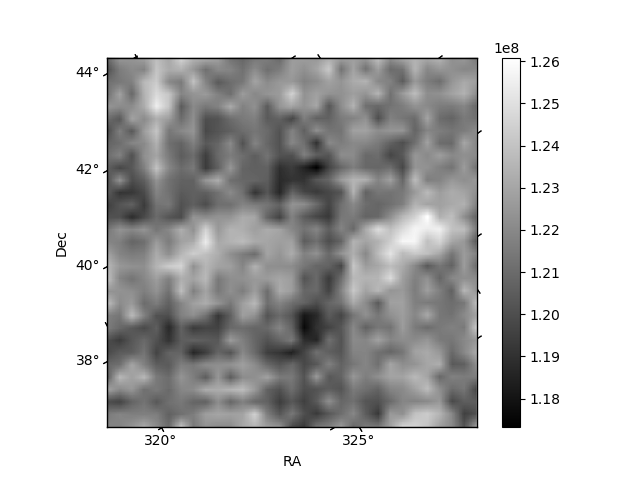
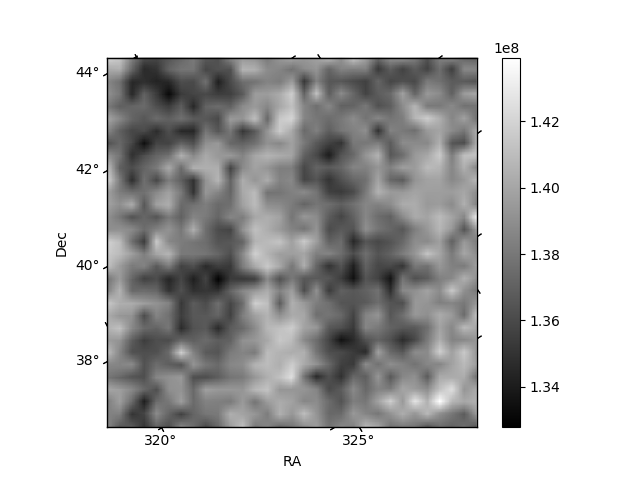
Histogram calculated using DETX and DETY for each event in the final _common_clean file
| Quadrant A | 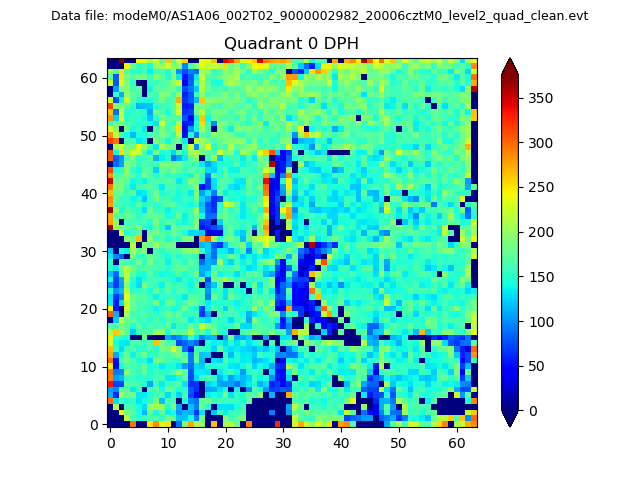 |
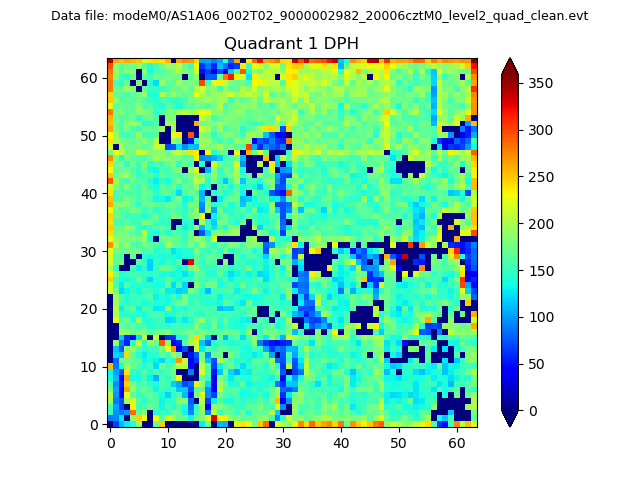 |
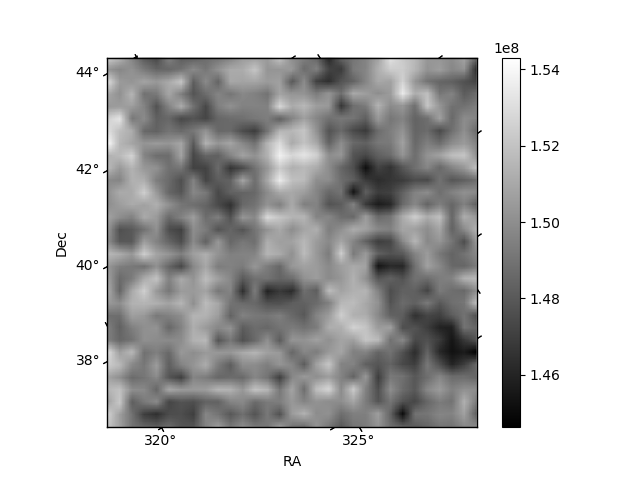
Quadrant B |
|---|---|---|---|
| Quadrant D | 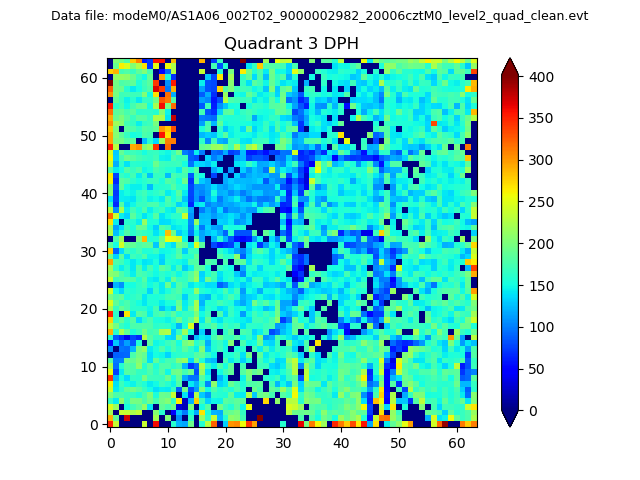 |
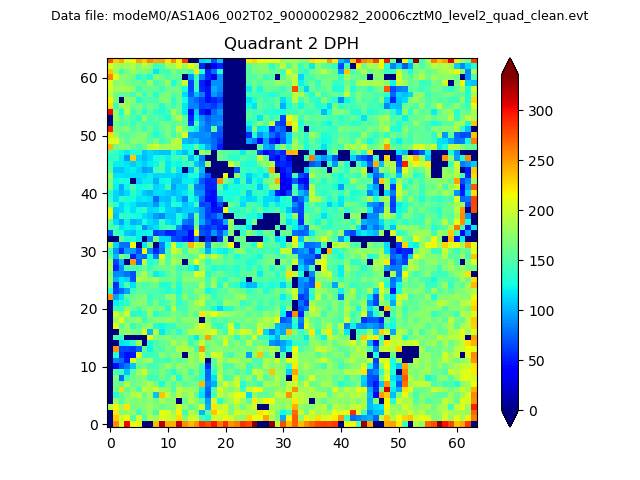 |
Quadrant C |
| Plot type | Count rate plots | Images |
|---|---|---|
| Comparison with Poisson distribution Blue bars denote a histogram of data divided into 1 sec bins. Red curve is a Poisson curve with rate = median count rate of data. |
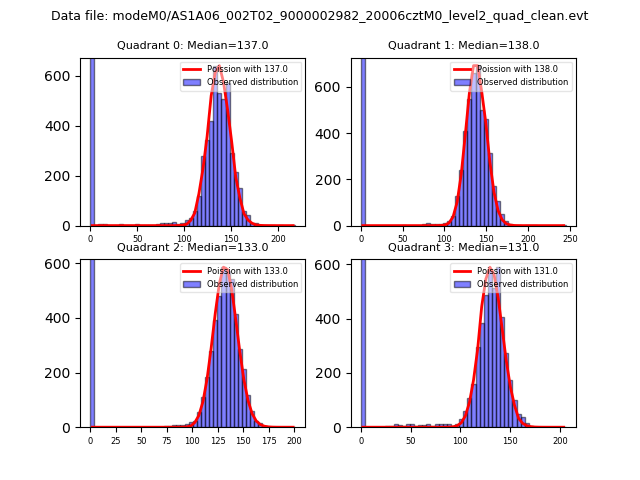 |
 |
| Quadrant-wise count rates Data is divided into 100 sec bins |
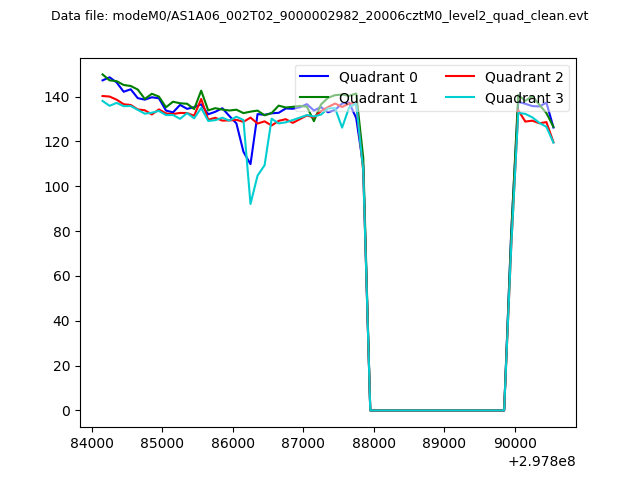 |
|
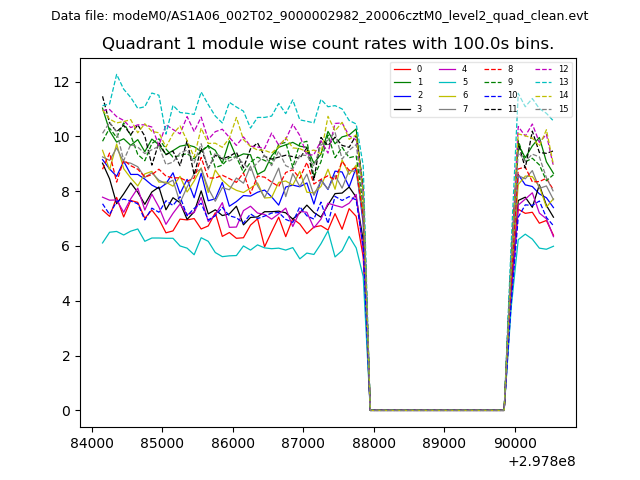
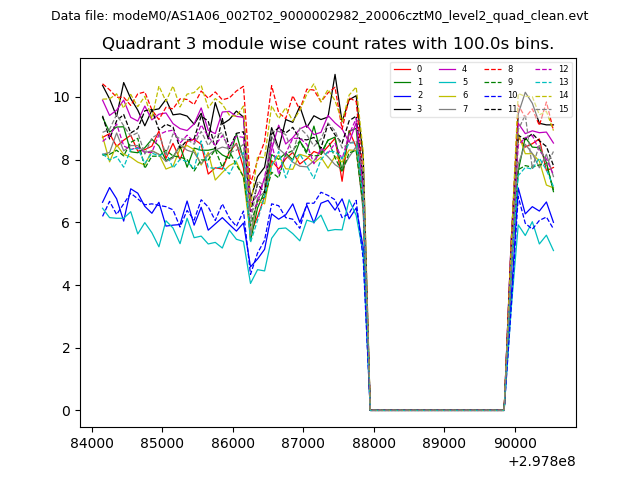
| Module-wise count rates for Quadrant A Data is divided into 100 sec bins |
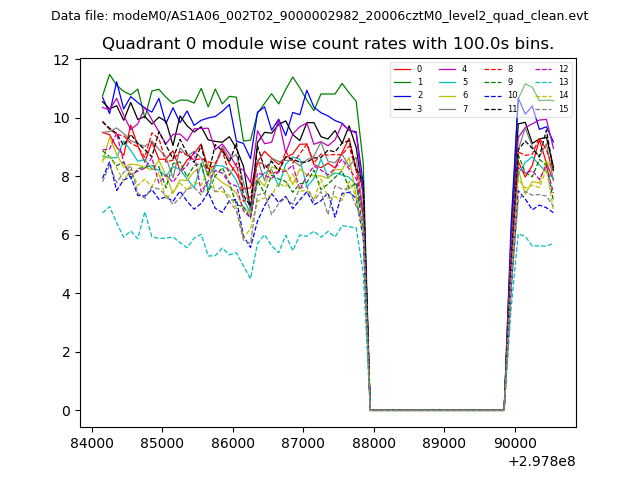 |
 |
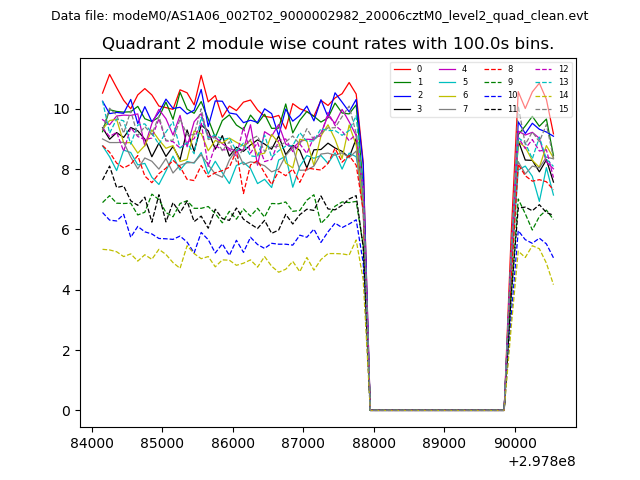
| Module-wise count rates for Quadrant B Data is divided into 100 sec bins |
 |
 |
| Module-wise count rates for Quadrant C Data is divided into 100 sec bins |
 |
 |
| Module-wise count rates for Quadrant D Data is divided into 100 sec bins |
 |
 |
| Parameter | Plot |
|---|---|
| CZT HV Monitor | 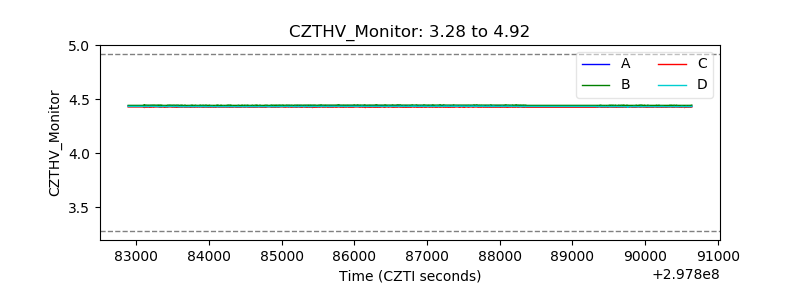 |
| D_VDD | 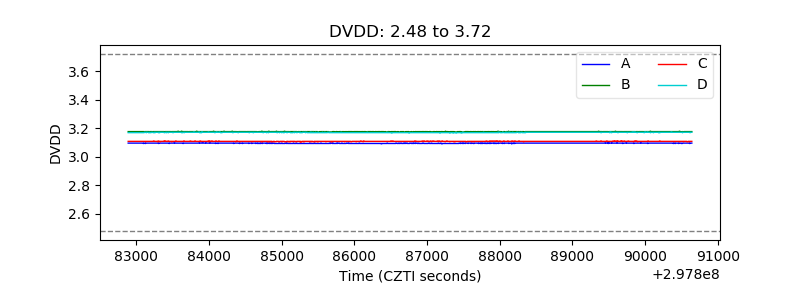 |
| Temperature 1 | 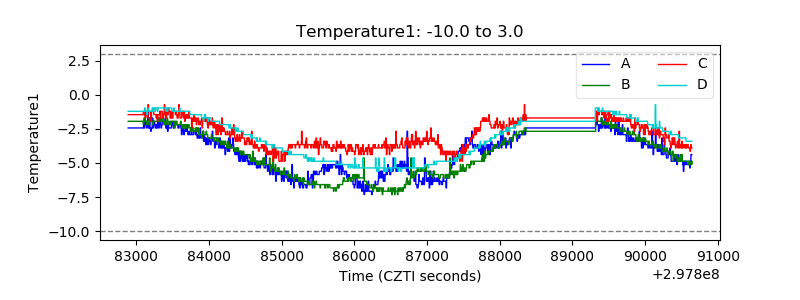 |
| Veto HV Monitor | 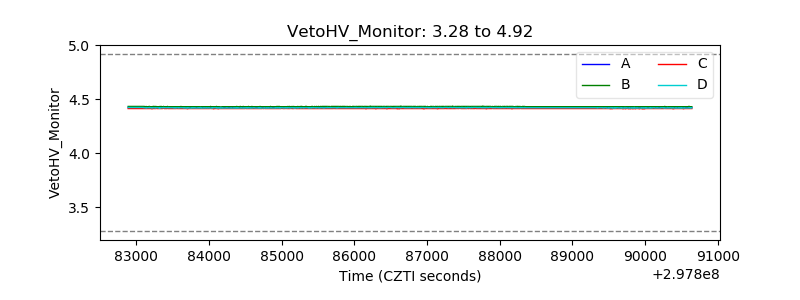 |
| Veto LLD | 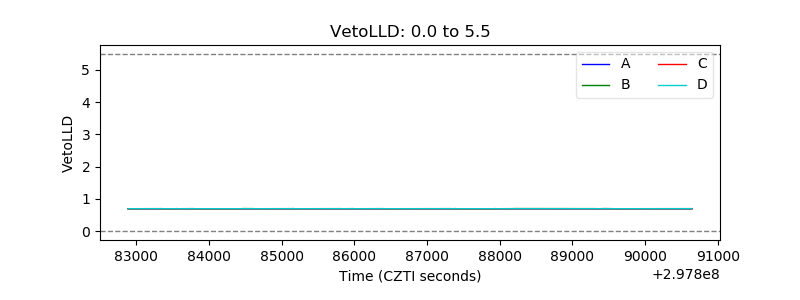 |
| Alpha Counter | 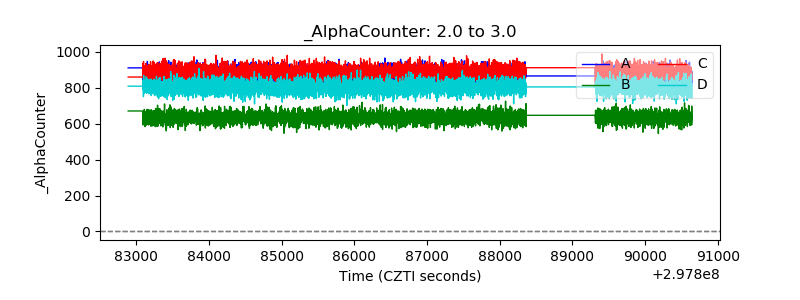 |
| _CPM_Rate | 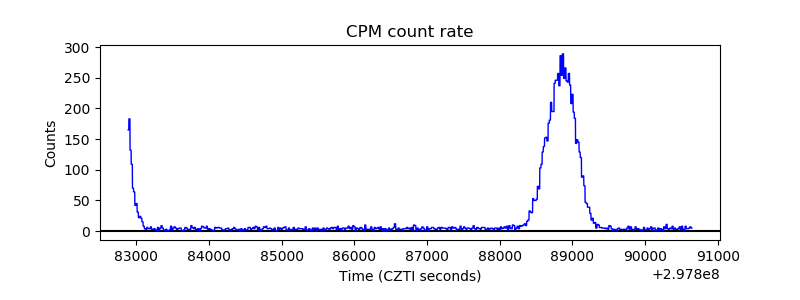 |
| CZT Counter | 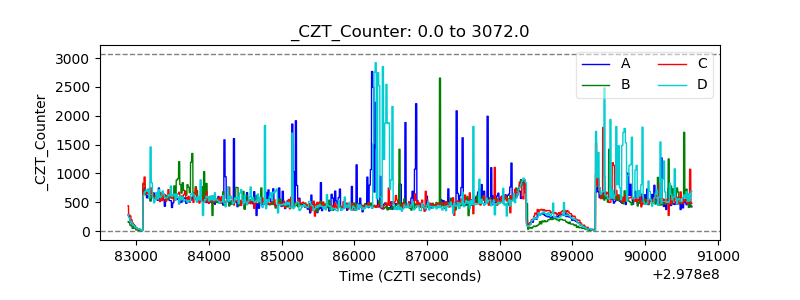 |
| +2.5 Volts monitor | 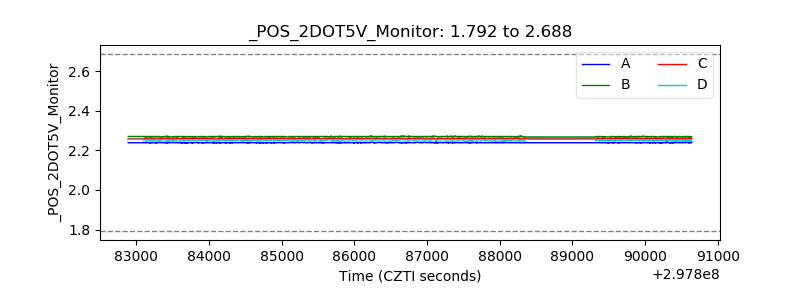 |
| +5 Volts monitor |  |
| _ROLL_ROT | 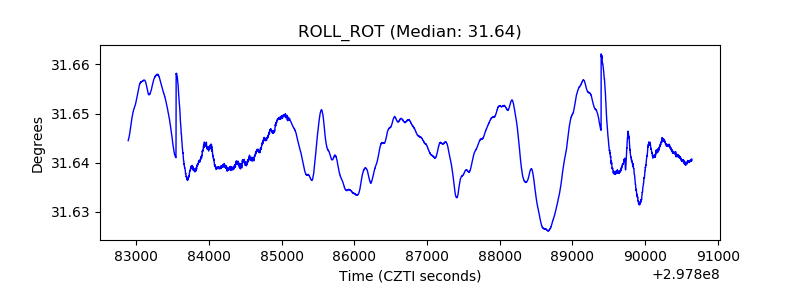 |
| _Roll_DEC | 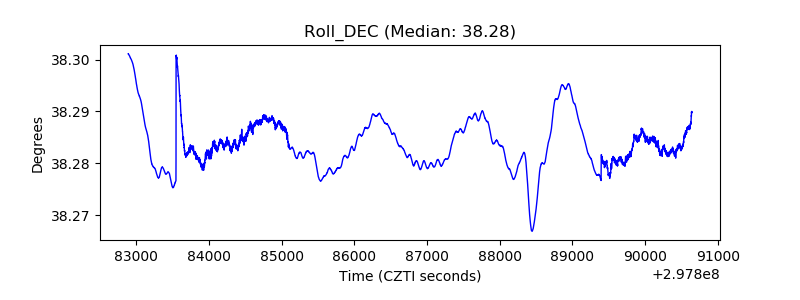 |
| _Roll_RA | 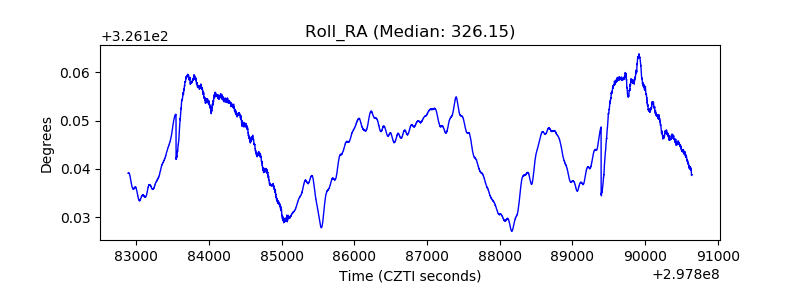 |
| Veto Counter | 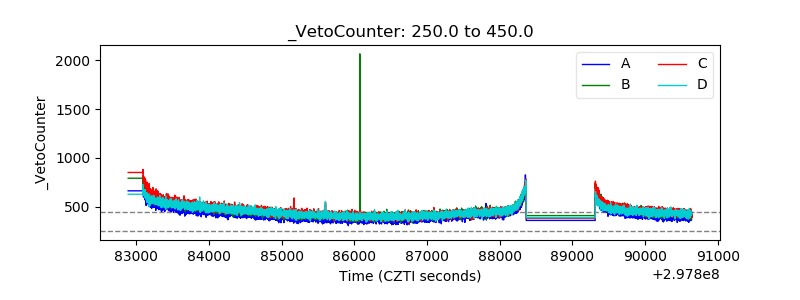 |