| Param | Original file | Final file |
|---|---|---|
| Filename | modeM0/AS1A06_002T02_9000002982_20007cztM0_level2.evt | modeM0/AS1A06_002T02_9000002982_20007cztM0_level2_quad_clean.evt |
| Size (bytes) | 593,089,920 | 101,154,240 |
| Size | 565.6 MB | 96.5 MB |
| Events in quadrant A | 4,752,426 | 639,646 |
| Events in quadrant B | 4,001,507 | 650,734 |
| Events in quadrant C | 4,224,272 | 621,905 |
| Events in quadrant D | 4,466,577 | 620,787 |
| Mode M9 | |||
|---|---|---|---|
| Quadrant | BADHDUFLAG | Total packets | Discarded packets |
| A | 0 | 15 | 0 |
| B | 0 | 15 | 0 |
| C | 0 | 15 | 0 |
| D | 0 | 15 | 0 |
| Mode SS | |||
|---|---|---|---|
| Quadrant | BADHDUFLAG | Total packets | Discarded packets |
| A | 0 | 156 | 0 |
| B | 0 | 156 | 0 |
| C | 0 | 156 | 0 |
| D | 0 | 156 | 0 |
| Mode M0 | |||
|---|---|---|---|
| Quadrant | BADHDUFLAG | Total packets | Discarded packets |
| A | 0 | 19067 | 2 |
| B | 0 | 16745 | 2 |
| C | 0 | 17231 | 3 |
| D | 0 | 18261 | 2 |
| Quadrant | Total seconds | Saturated seconds | Saturation percentage |
|---|---|---|---|
| A | 7625 | 327 | 4.288525% |
| B | 7626 | 207 | 2.714398% |
| C | 7625 | 235 | 3.081967% |
| D | 7625 | 322 | 4.222951% |
Noise dominated data is calculated using 1-second bins in cleaned event files. If a bin has >2000 counts, and if more than 50% of those come from <1% of pixels, then it is considered to be noise-dominated and hence unusable.
| Quadrant | # 1 sec bins | Bins with >0 counts | Bins with >2000 counts | High rate bins dominated by noise | Noise dominated (total time) | Noise dominated (detector-on time) | Marked lightcurve |
|---|---|---|---|---|---|---|---|
| A | 9090 | 7627 | 172 | 172 | 1.89% | 2.26% | 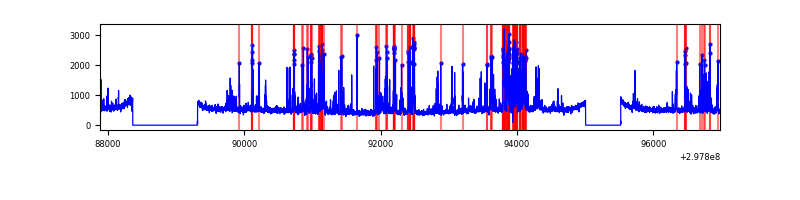 |
| B | 9091 | 7628 | 11 | 11 | 0.12% | 0.14% | 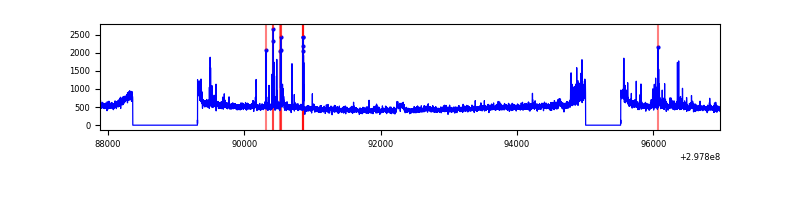 |
| C | 9090 | 7627 | 11 | 11 | 0.12% | 0.14% | 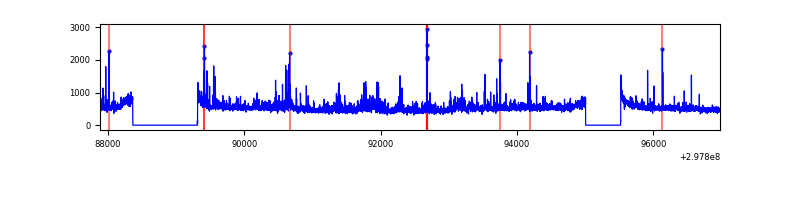 |
| D | 9090 | 7627 | 83 | 83 | 0.91% | 1.09% | 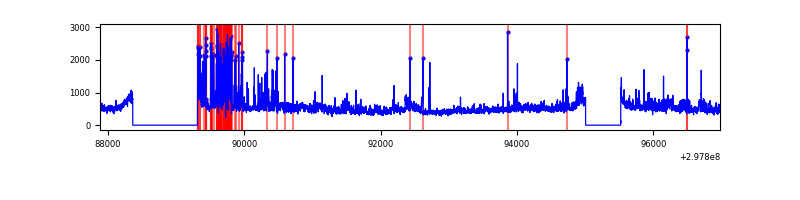 |
Top three noisy pixels from each quadrant. If the there are fewer than three noisy pixels in the level2.evt file, extra rows are filled as -1
| Pixel properties | Quadrant properties | ||||||
|---|---|---|---|---|---|---|---|
| Quadrant | DetID | PixID | Counts | Sigma | Mean | Median | Sigma |
| A | 14 | 238 | 690645 | 3586.43 | 951 | 928 | 192.3 |
| A | 14 | 254 | 356749 | 1850.22 | 951 | 928 | 192.3 |
| A | 13 | 252 | 20538 | 101.97 | 951 | 928 | 192.3 |
| B | 7 | 220 | 105114 | 570.42 | 953 | 928 | 182.6 |
| B | 0 | 230 | 40168 | 214.84 | 953 | 928 | 182.6 |
| B | 0 | 197 | 33401 | 177.79 | 953 | 928 | 182.6 |
| C | 9 | 221 | 237788 | 1108.3 | 918 | 922 | 213.7 |
| C | 0 | 207 | 177753 | 827.39 | 918 | 922 | 213.7 |
| C | 14 | 238 | 142376 | 661.86 | 918 | 922 | 213.7 |
| D | 12 | 218 | 400117 | 1778.11 | 926 | 900 | 224.5 |
| D | 1 | 52 | 359517 | 1597.28 | 926 | 900 | 224.5 |
| D | 7 | 96 | 92694 | 408.85 | 926 | 900 | 224.5 |
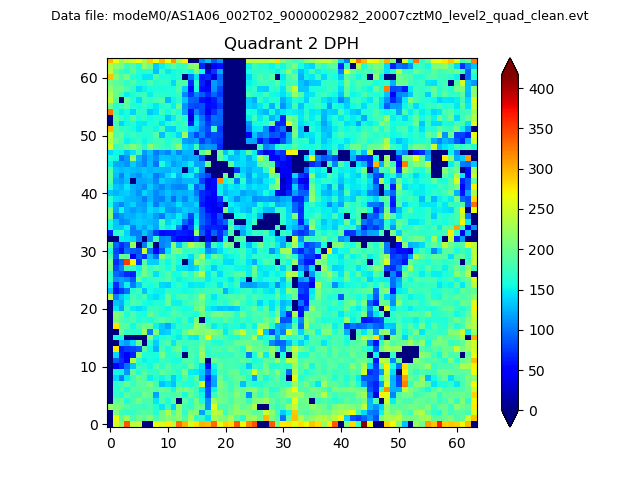
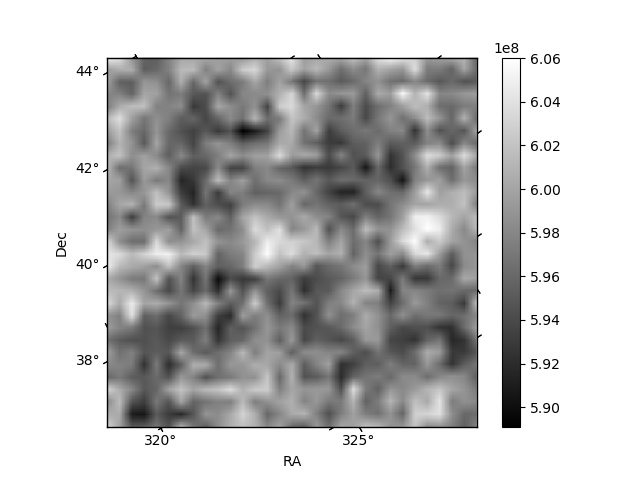
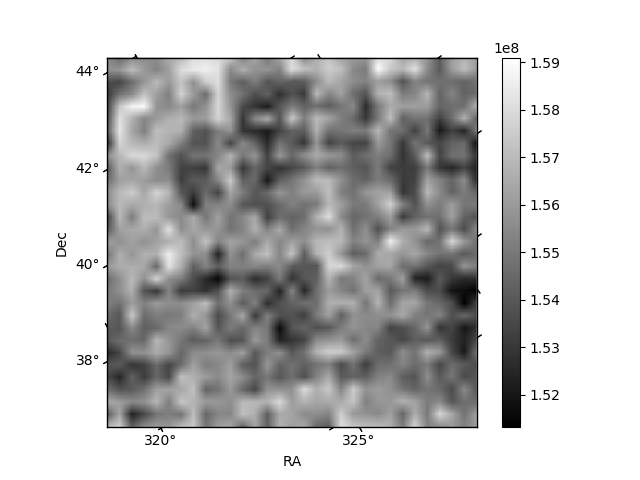
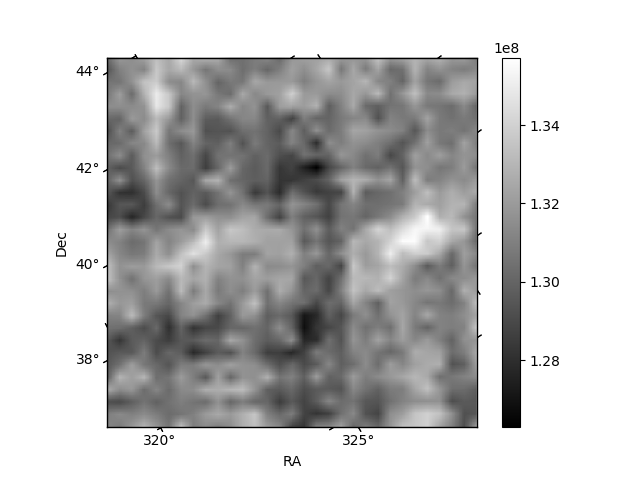
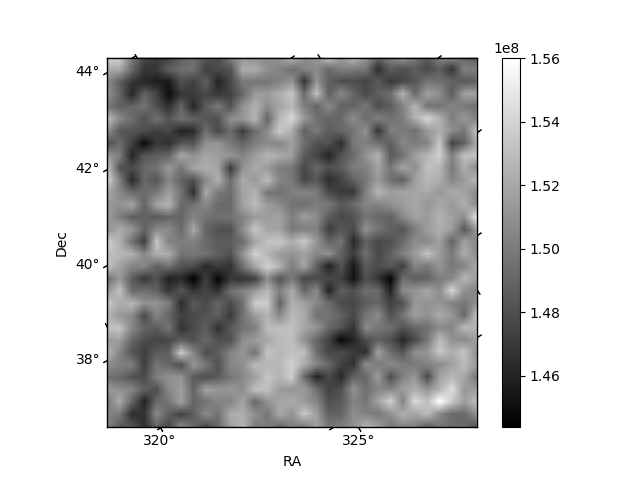
Histogram calculated using DETX and DETY for each event in the final _common_clean file
| Quadrant A | 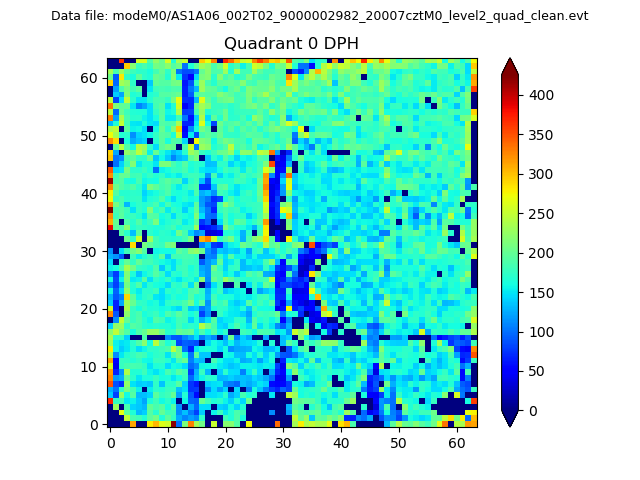 |
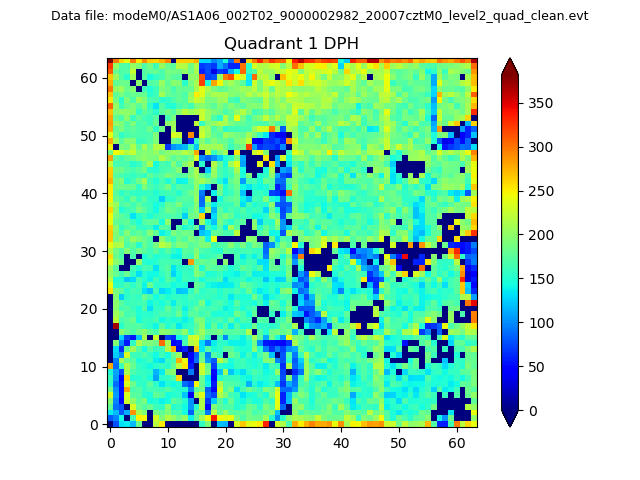 |
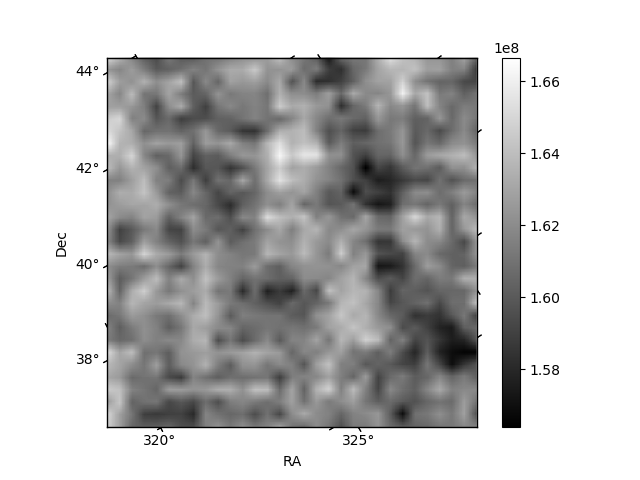
Quadrant B |
|---|---|---|---|
| Quadrant D | 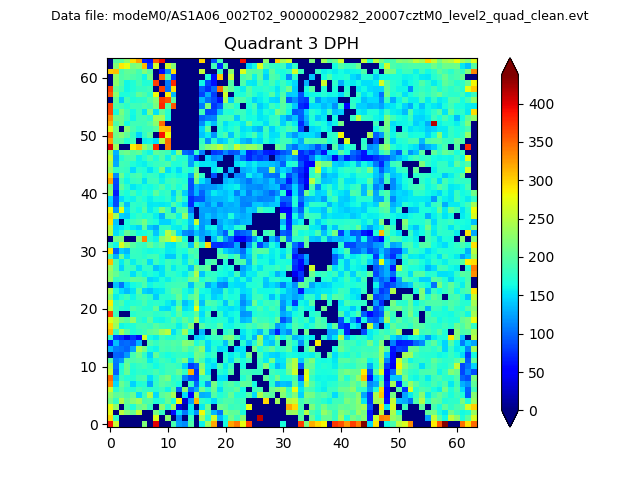 |
 |
Quadrant C |
| Plot type | Count rate plots | Images |
|---|---|---|
| Comparison with Poisson distribution Blue bars denote a histogram of data divided into 1 sec bins. Red curve is a Poisson curve with rate = median count rate of data. |
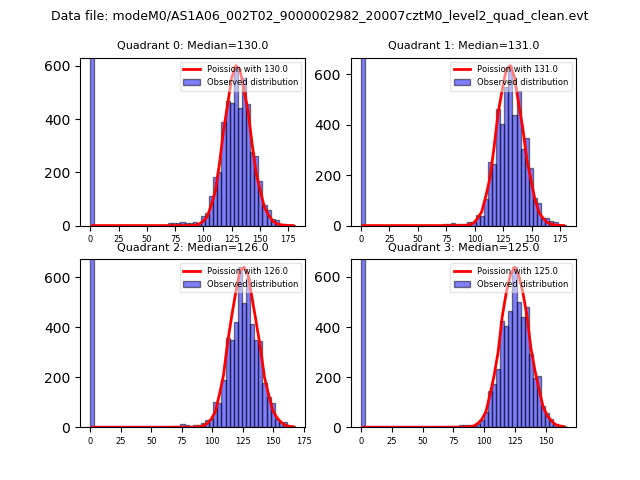 |
 |
| Quadrant-wise count rates Data is divided into 100 sec bins |
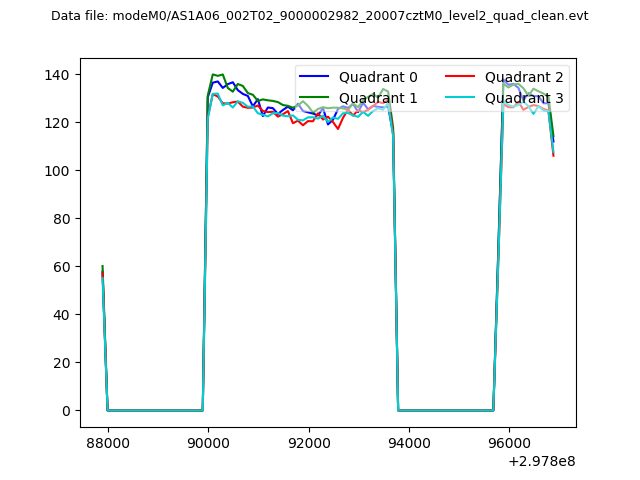 |
|
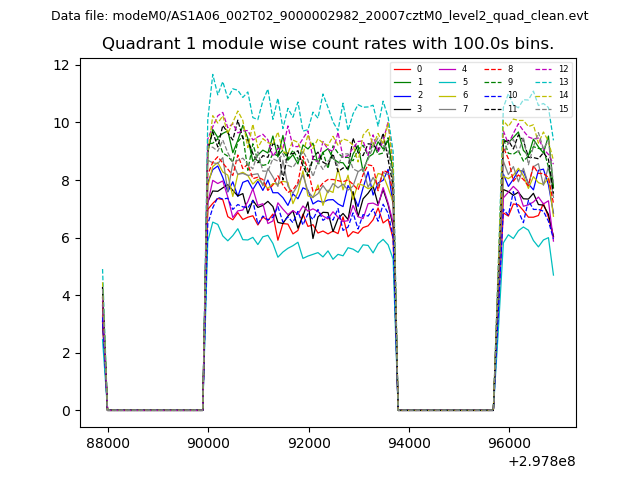
| Module-wise count rates for Quadrant A Data is divided into 100 sec bins |
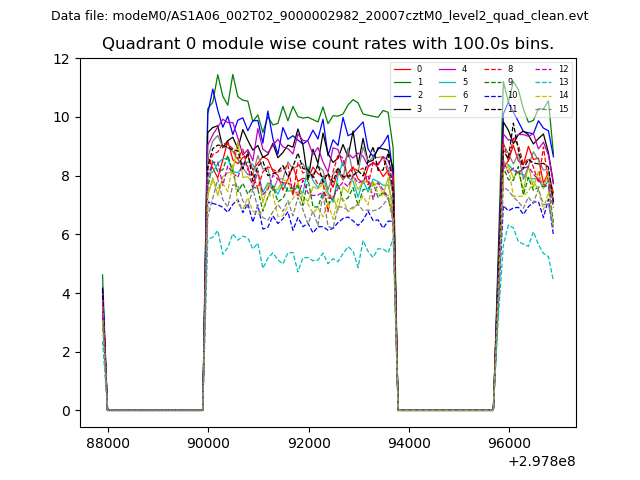 |
 |
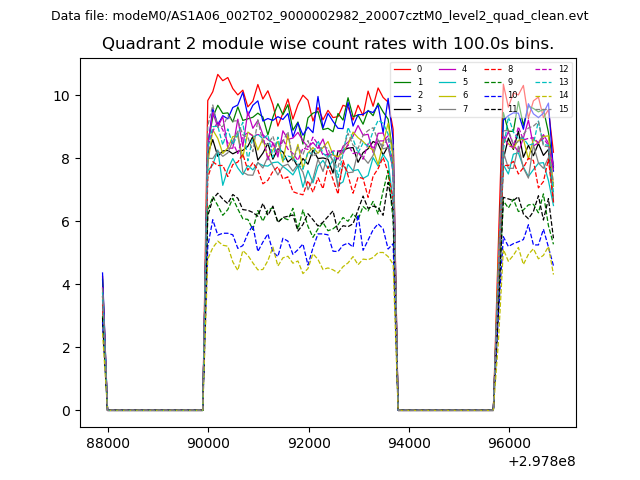
| Module-wise count rates for Quadrant B Data is divided into 100 sec bins |
 |
 |
| Module-wise count rates for Quadrant C Data is divided into 100 sec bins |
 |
 |
| Module-wise count rates for Quadrant D Data is divided into 100 sec bins |
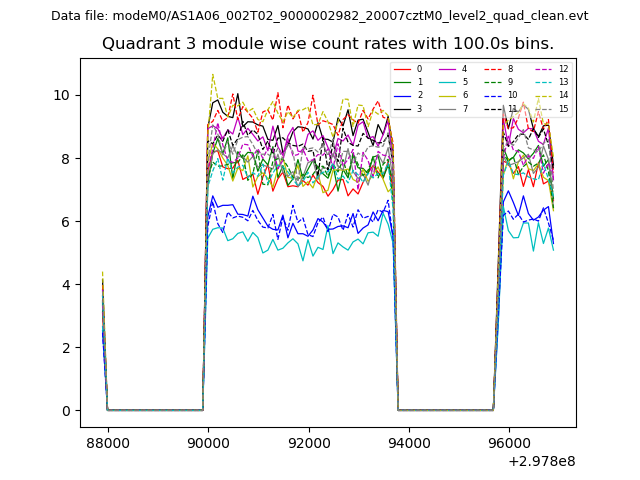 |
 |
| Parameter | Plot |
|---|---|
| CZT HV Monitor | 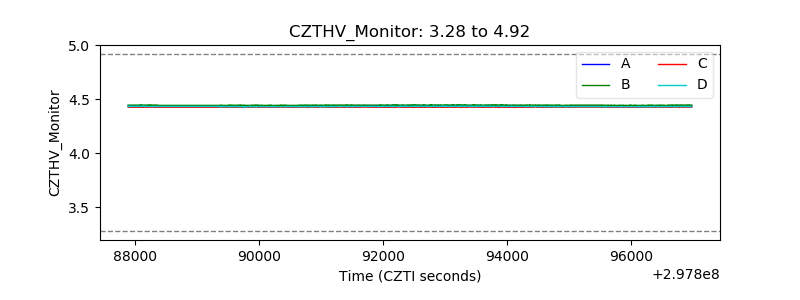 |
| D_VDD | 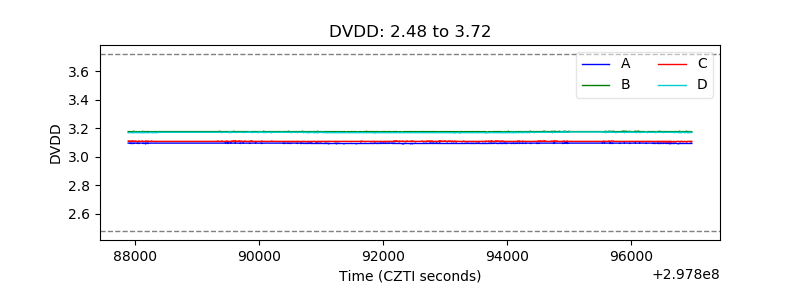 |
| Temperature 1 | 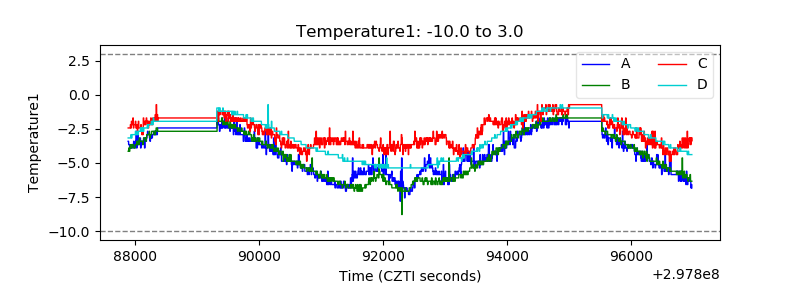 |
| Veto HV Monitor | 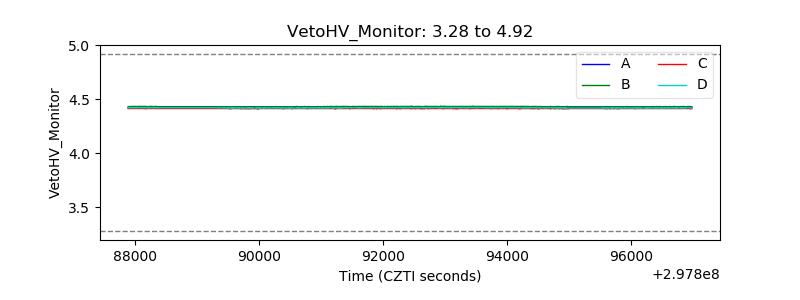 |
| Veto LLD | 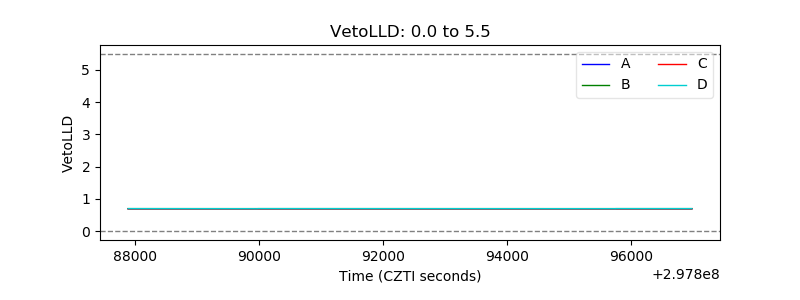 |
| Alpha Counter | 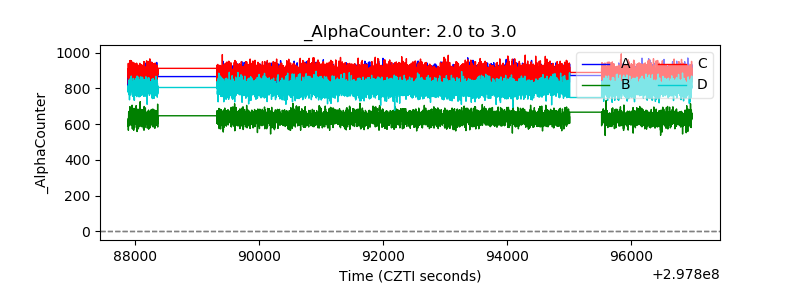 |
| _CPM_Rate | 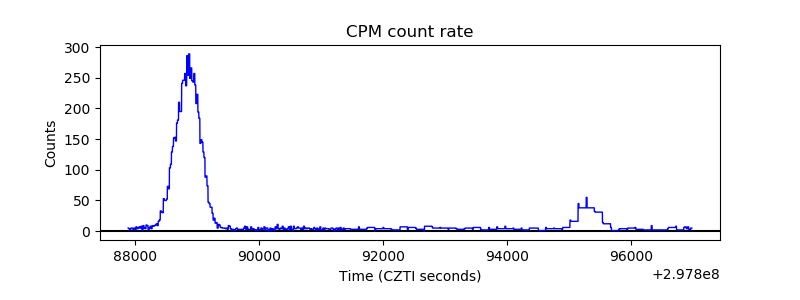 |
| CZT Counter | 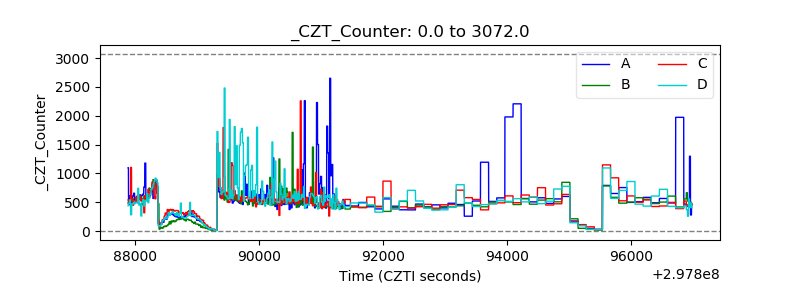 |
| +2.5 Volts monitor | 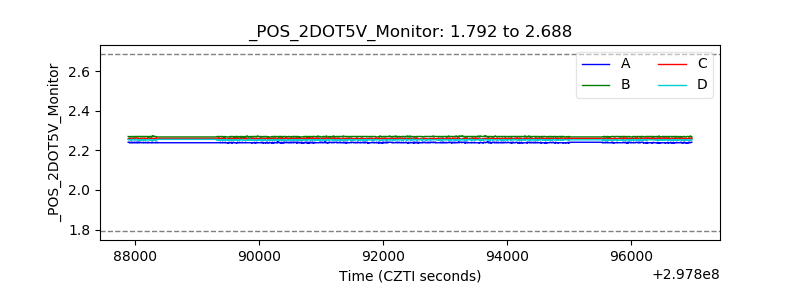 |
| +5 Volts monitor |  |
| _ROLL_ROT | 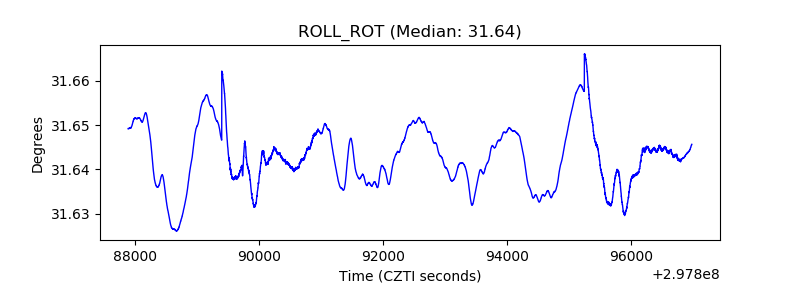 |
| _Roll_DEC | 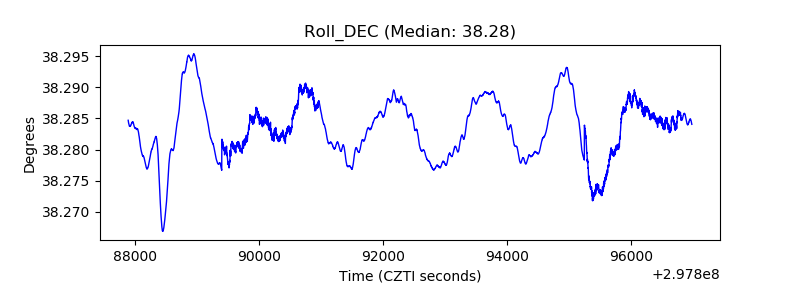 |
| _Roll_RA | 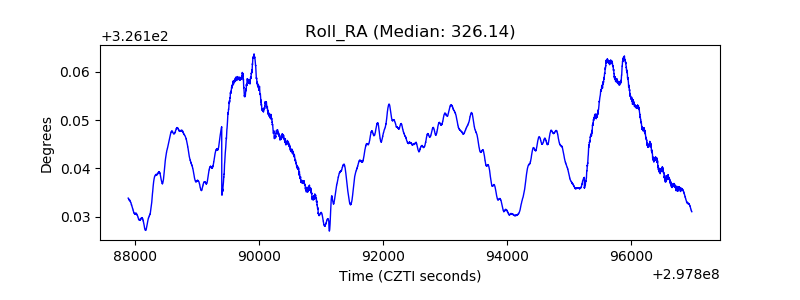 |
| Veto Counter | 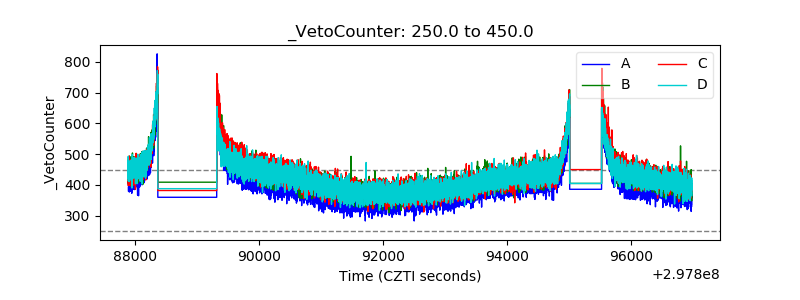 |