| Param | Original file | Final file |
|---|---|---|
| Filename | modeM0/AS1A06_002T02_9000002982_20008cztM0_level2.evt | modeM0/AS1A06_002T02_9000002982_20008cztM0_level2_quad_clean.evt |
| Size (bytes) | 569,839,680 | 106,459,200 |
| Size | 543.4 MB | 101.5 MB |
| Events in quadrant A | 4,569,380 | 680,438 |
| Events in quadrant B | 4,048,687 | 690,311 |
| Events in quadrant C | 4,037,112 | 659,318 |
| Events in quadrant D | 4,079,089 | 657,587 |
| Mode M9 | |||
|---|---|---|---|
| Quadrant | BADHDUFLAG | Total packets | Discarded packets |
| A | 0 | 7 | 0 |
| B | 0 | 7 | 0 |
| C | 0 | 7 | 0 |
| D | 0 | 7 | 0 |
| Mode SS | |||
|---|---|---|---|
| Quadrant | BADHDUFLAG | Total packets | Discarded packets |
| A | 0 | 160 | 0 |
| B | 0 | 160 | 0 |
| C | 0 | 160 | 0 |
| D | 0 | 160 | 0 |
| Mode M0 | |||
|---|---|---|---|
| Quadrant | BADHDUFLAG | Total packets | Discarded packets |
| A | 0 | 18657 | 2 |
| B | 0 | 17231 | 2 |
| C | 0 | 16991 | 2 |
| D | 0 | 17570 | 2 |
| Quadrant | Total seconds | Saturated seconds | Saturation percentage |
|---|---|---|---|
| A | 7708 | 240 | 3.113648% |
| B | 7708 | 205 | 2.659574% |
| C | 7708 | 274 | 3.554748% |
| D | 7709 | 105 | 1.362044% |
Noise dominated data is calculated using 1-second bins in cleaned event files. If a bin has >2000 counts, and if more than 50% of those come from <1% of pixels, then it is considered to be noise-dominated and hence unusable.
| Quadrant | # 1 sec bins | Bins with >0 counts | Bins with >2000 counts | High rate bins dominated by noise | Noise dominated (total time) | Noise dominated (detector-on time) | Marked lightcurve |
|---|---|---|---|---|---|---|---|
| A | 8453 | 7710 | 148 | 148 | 1.75% | 1.92% | 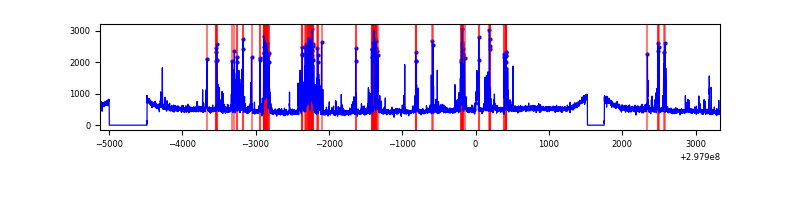 |
| B | 8453 | 7710 | 11 | 11 | 0.13% | 0.14% | 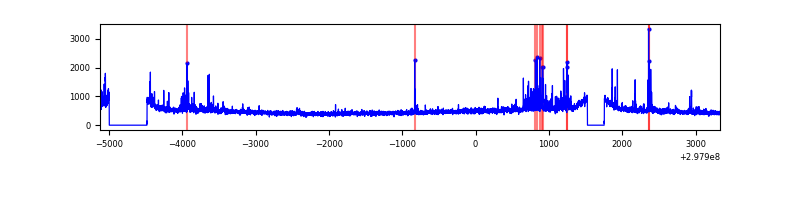 |
| C | 8453 | 7710 | 46 | 46 | 0.54% | 0.60% | 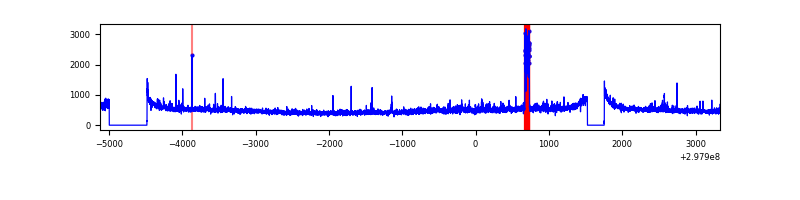 |
| D | 8454 | 7711 | 24 | 24 | 0.28% | 0.31% | 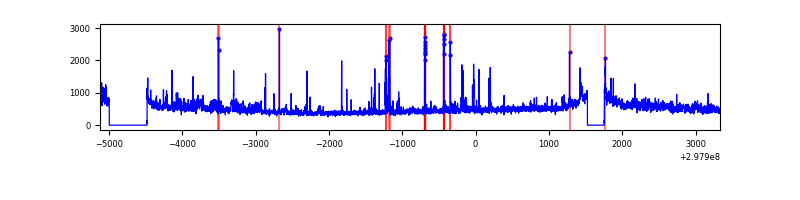 |
Top three noisy pixels from each quadrant. If the there are fewer than three noisy pixels in the level2.evt file, extra rows are filled as -1
| Pixel properties | Quadrant properties | ||||||
|---|---|---|---|---|---|---|---|
| Quadrant | DetID | PixID | Counts | Sigma | Mean | Median | Sigma |
| A | 14 | 238 | 755598 | 3920.32 | 949 | 929 | 192.5 |
| A | 14 | 254 | 120028 | 618.69 | 949 | 929 | 192.5 |
| A | 5 | 16 | 39235 | 198.99 | 949 | 929 | 192.5 |
| B | 7 | 220 | 181044 | 989.73 | 951 | 925 | 182.0 |
| B | 0 | 197 | 50554 | 272.7 | 951 | 925 | 182.0 |
| B | 0 | 190 | 29382 | 156.37 | 951 | 925 | 182.0 |
| C | 9 | 221 | 212439 | 984.63 | 912 | 916 | 214.8 |
| C | 14 | 238 | 140764 | 650.99 | 912 | 916 | 214.8 |
| C | 0 | 207 | 85122 | 391.98 | 912 | 916 | 214.8 |
| D | 1 | 52 | 335827 | 1470.19 | 933 | 904 | 227.8 |
| D | 12 | 227 | 58915 | 254.65 | 933 | 904 | 227.8 |
| D | 12 | 218 | 50921 | 219.56 | 933 | 904 | 227.8 |
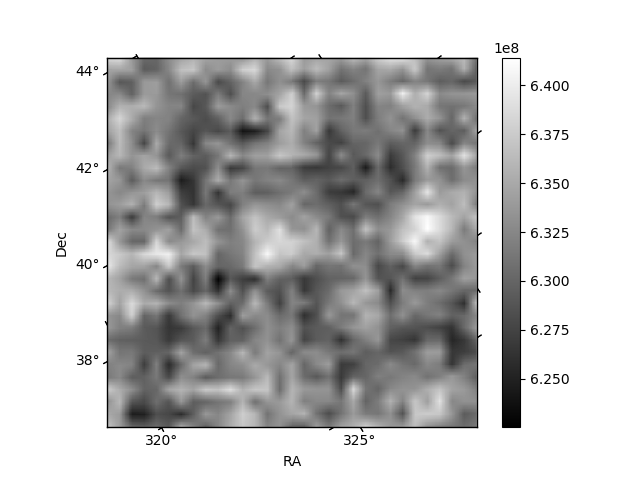
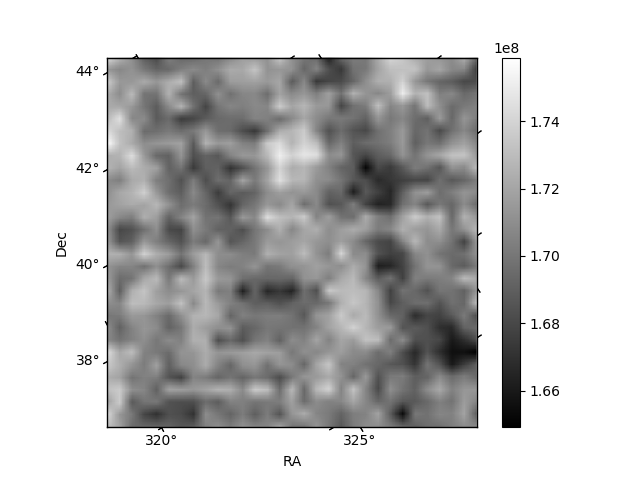
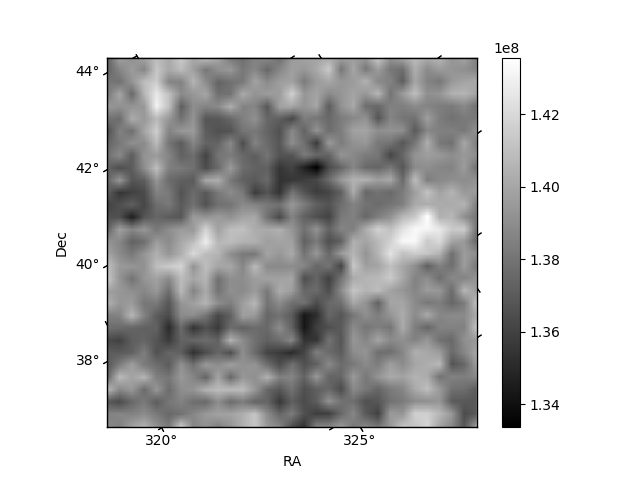
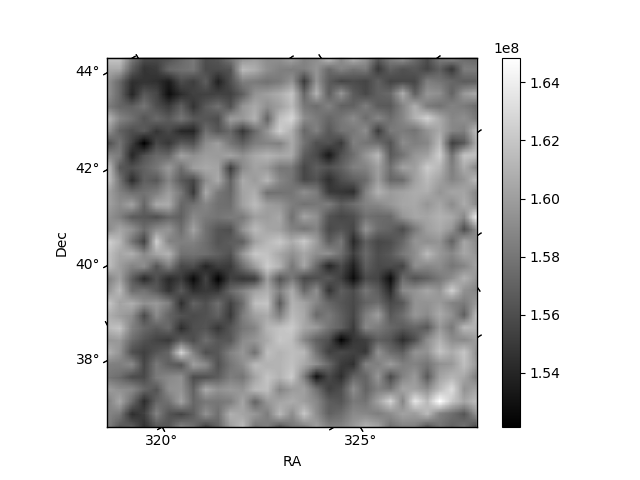
Histogram calculated using DETX and DETY for each event in the final _common_clean file
| Quadrant A | 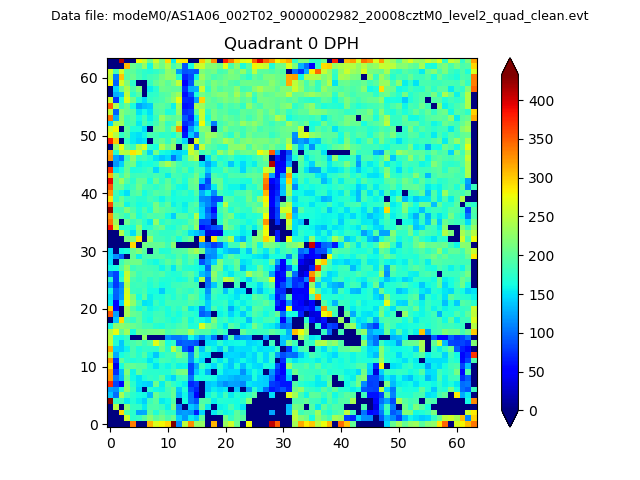 |
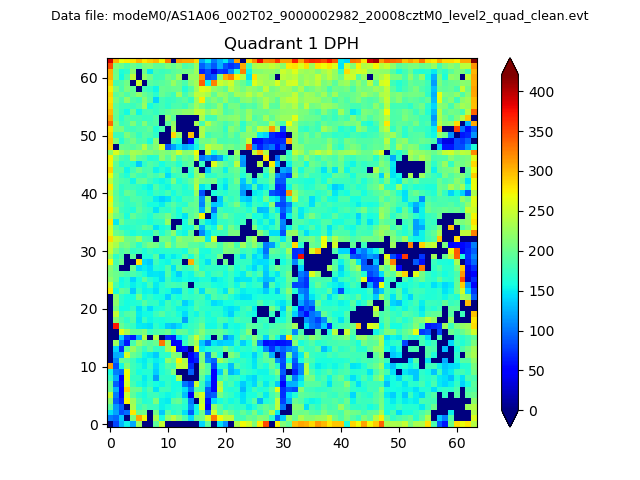 |
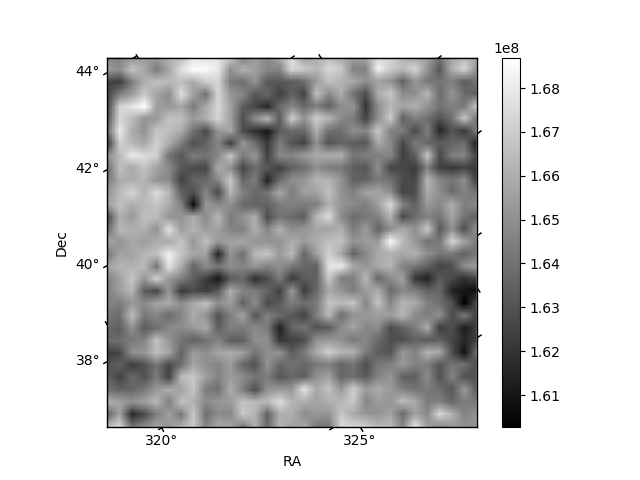
Quadrant B |
|---|---|---|---|
| Quadrant D | 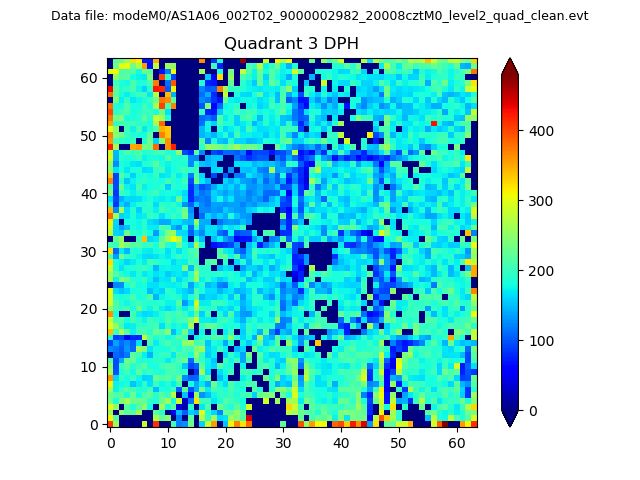 |
 |
Quadrant C |
| Plot type | Count rate plots | Images |
|---|---|---|
| Comparison with Poisson distribution Blue bars denote a histogram of data divided into 1 sec bins. Red curve is a Poisson curve with rate = median count rate of data. |
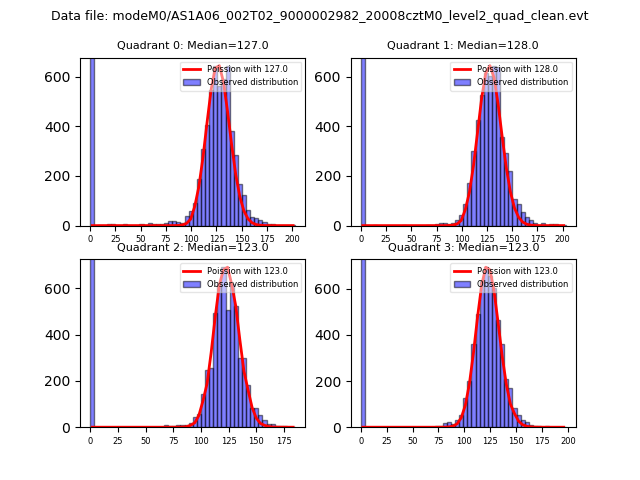 |
 |
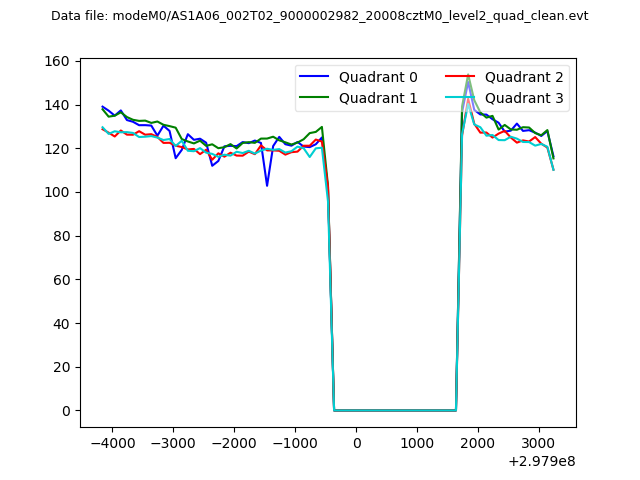
| Quadrant-wise count rates Data is divided into 100 sec bins |
 |
|
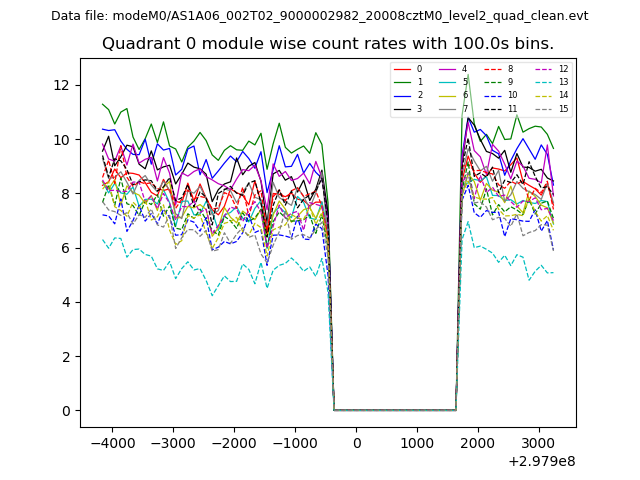
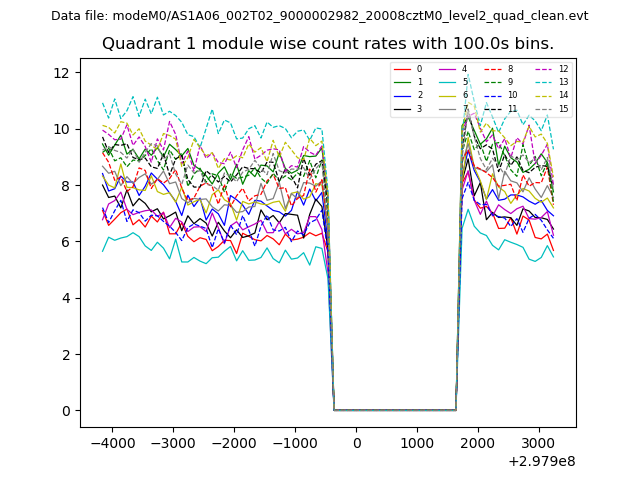
| Module-wise count rates for Quadrant A Data is divided into 100 sec bins |
 |
 |
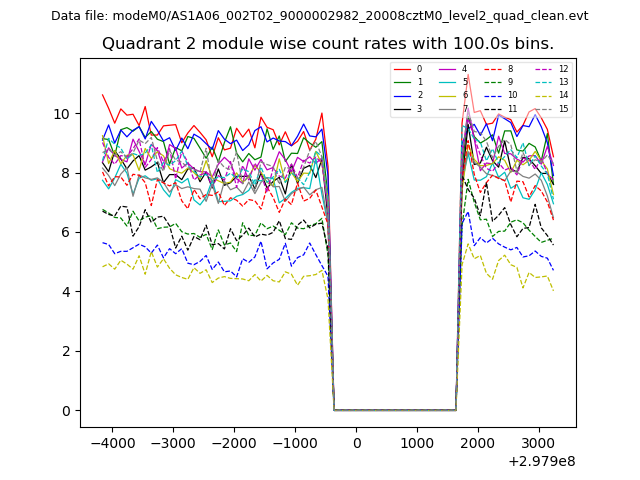
| Module-wise count rates for Quadrant B Data is divided into 100 sec bins |
 |
 |
| Module-wise count rates for Quadrant C Data is divided into 100 sec bins |
 |
 |
| Module-wise count rates for Quadrant D Data is divided into 100 sec bins |
 |
 |
| Parameter | Plot |
|---|---|
| CZT HV Monitor | 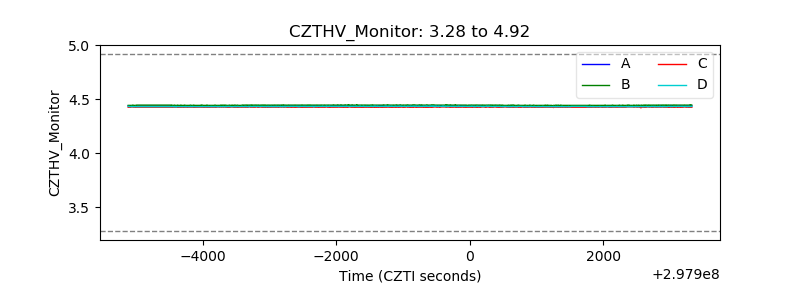 |
| D_VDD | 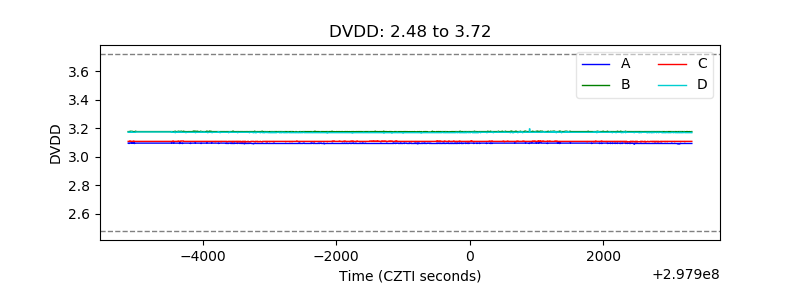 |
| Temperature 1 | 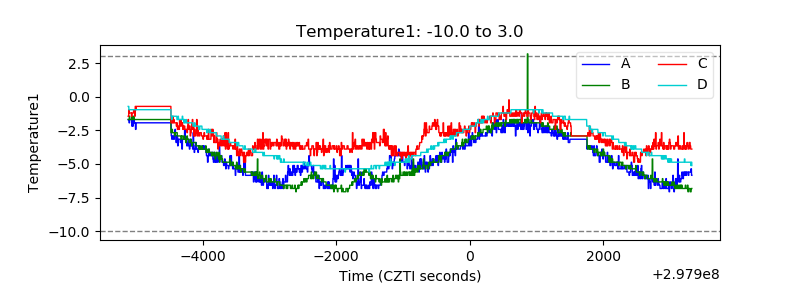 |
| Veto HV Monitor | 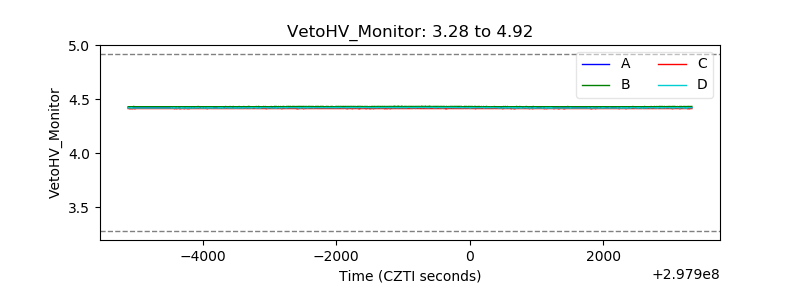 |
| Veto LLD | 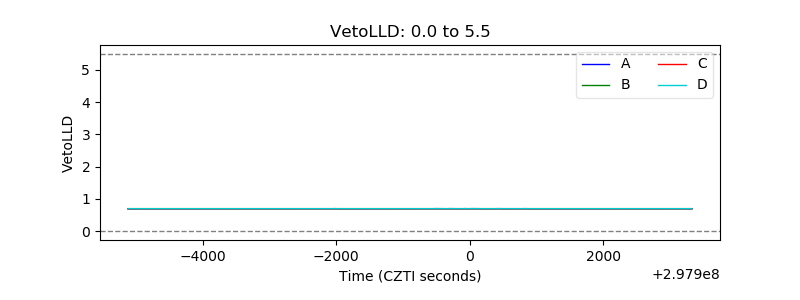 |
| Alpha Counter | 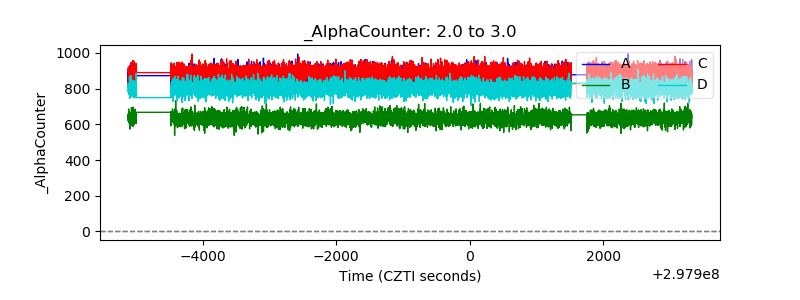 |
| _CPM_Rate | 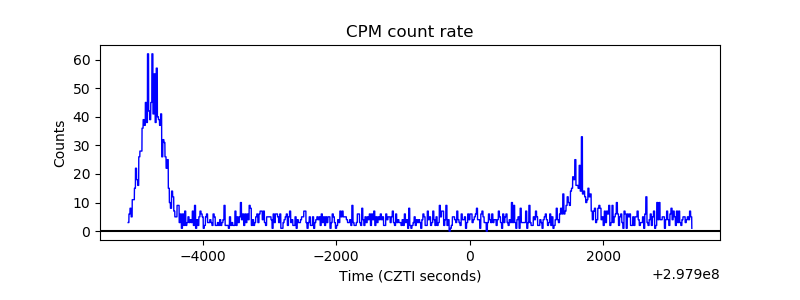 |
| CZT Counter | 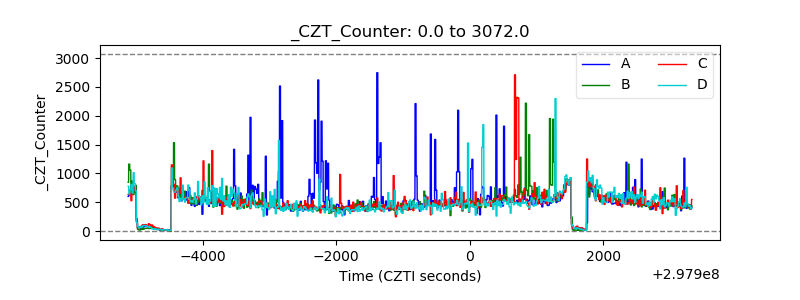 |
| +2.5 Volts monitor |  |
| +5 Volts monitor | 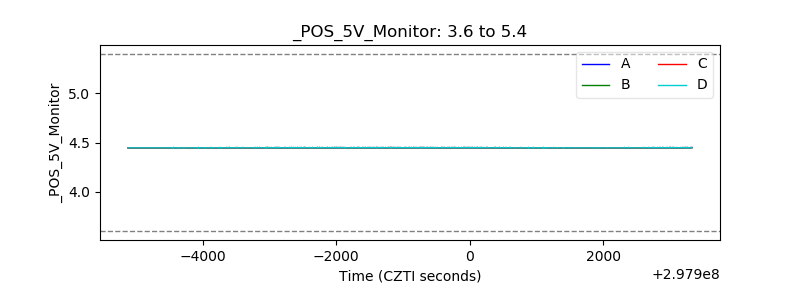 |
| _ROLL_ROT | 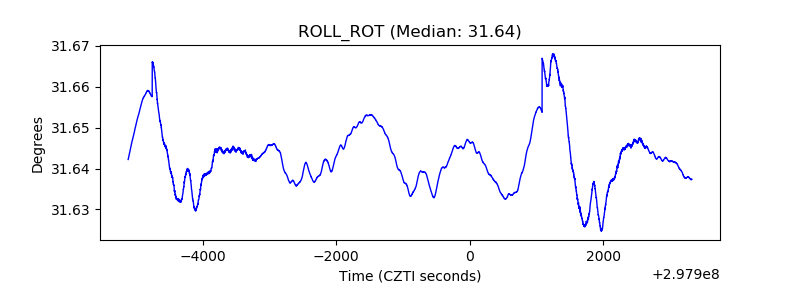 |
| _Roll_DEC | 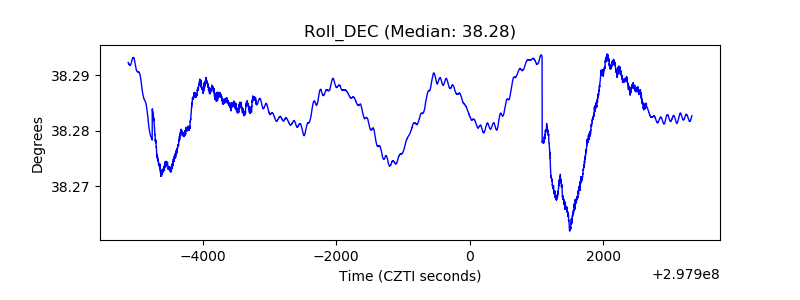 |
| _Roll_RA | 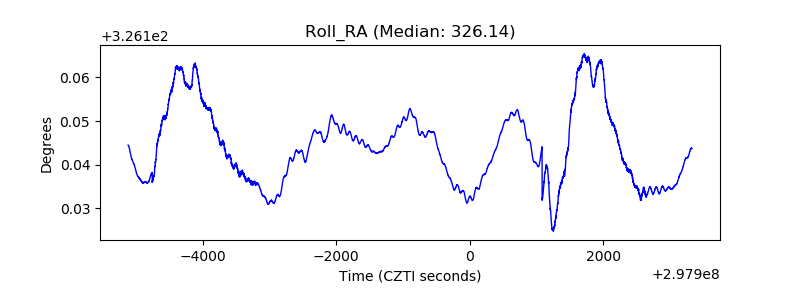 |
| Veto Counter | 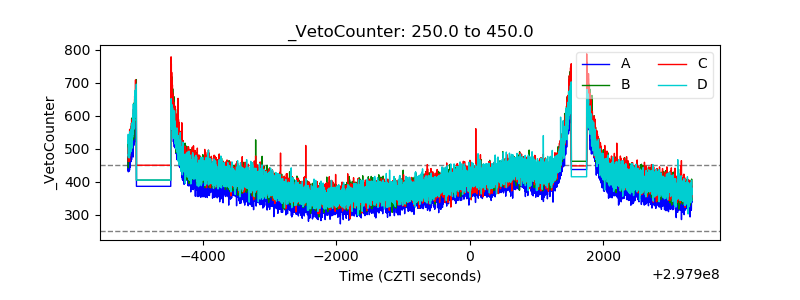 |