| Param | Original file | Final file |
|---|---|---|
| Filename | modeM0/AS1A06_002T02_9000002982_20009cztM0_level2.evt | modeM0/AS1A06_002T02_9000002982_20009cztM0_level2_quad_clean.evt |
| Size (bytes) | 553,080,960 | 109,543,680 |
| Size | 527.5 MB | 104.5 MB |
| Events in quadrant A | 4,067,526 | 704,689 |
| Events in quadrant B | 3,963,028 | 711,194 |
| Events in quadrant C | 4,032,118 | 680,557 |
| Events in quadrant D | 4,158,117 | 678,768 |
| Mode M9 | |||
|---|---|---|---|
| Quadrant | BADHDUFLAG | Total packets | Discarded packets |
| A | 0 | 4 | 0 |
| B | 0 | 4 | 0 |
| C | 0 | 4 | 0 |
| D | 0 | 4 | 0 |
| Mode SS | |||
|---|---|---|---|
| Quadrant | BADHDUFLAG | Total packets | Discarded packets |
| A | 0 | 162 | 0 |
| B | 0 | 162 | 0 |
| C | 0 | 162 | 0 |
| D | 0 | 162 | 0 |
| Mode M0 | |||
|---|---|---|---|
| Quadrant | BADHDUFLAG | Total packets | Discarded packets |
| A | 0 | 17444 | 2 |
| B | 0 | 17121 | 2 |
| C | 0 | 16983 | 2 |
| D | 0 | 17908 | 2 |
| Quadrant | Total seconds | Saturated seconds | Saturation percentage |
|---|---|---|---|
| A | 7792 | 134 | 1.719713% |
| B | 7792 | 187 | 2.399897% |
| C | 7792 | 210 | 2.695072% |
| D | 7792 | 88 | 1.129363% |
Noise dominated data is calculated using 1-second bins in cleaned event files. If a bin has >2000 counts, and if more than 50% of those come from <1% of pixels, then it is considered to be noise-dominated and hence unusable.
| Quadrant | # 1 sec bins | Bins with >0 counts | Bins with >2000 counts | High rate bins dominated by noise | Noise dominated (total time) | Noise dominated (detector-on time) | Marked lightcurve |
|---|---|---|---|---|---|---|---|
| A | 8287 | 7795 | 39 | 39 | 0.47% | 0.50% | 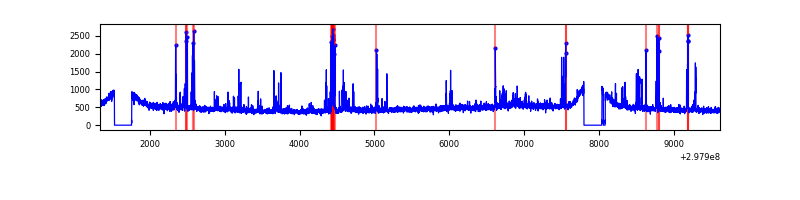 |
| B | 8287 | 7795 | 13 | 13 | 0.16% | 0.17% | 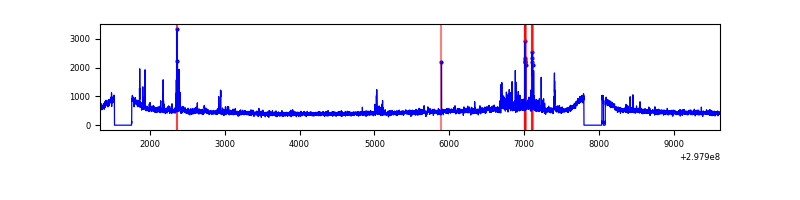 |
| C | 8287 | 7795 | 3 | 3 | 0.04% | 0.04% | 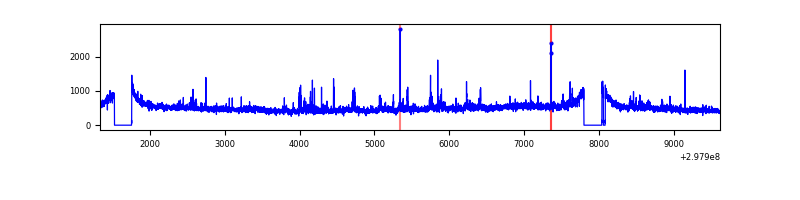 |
| D | 8287 | 7795 | 21 | 21 | 0.25% | 0.27% | 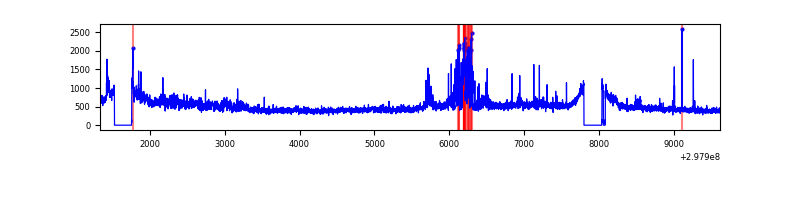 |
Top three noisy pixels from each quadrant. If the there are fewer than three noisy pixels in the level2.evt file, extra rows are filled as -1
| Pixel properties | Quadrant properties | ||||||
|---|---|---|---|---|---|---|---|
| Quadrant | DetID | PixID | Counts | Sigma | Mean | Median | Sigma |
| A | 14 | 238 | 308906 | 1559.21 | 962 | 939 | 197.5 |
| A | 14 | 254 | 42645 | 211.15 | 962 | 939 | 197.5 |
| A | 5 | 16 | 13423 | 63.21 | 962 | 939 | 197.5 |
| B | 7 | 220 | 108596 | 576.45 | 961 | 935 | 186.8 |
| B | 0 | 197 | 33357 | 173.6 | 961 | 935 | 186.8 |
| B | 12 | 111 | 22754 | 116.82 | 961 | 935 | 186.8 |
| C | 14 | 238 | 142736 | 645.07 | 925 | 931 | 219.8 |
| C | 9 | 221 | 119669 | 540.14 | 925 | 931 | 219.8 |
| C | 3 | 233 | 106471 | 480.1 | 925 | 931 | 219.8 |
| D | 1 | 52 | 486611 | 2126.27 | 940 | 912 | 228.4 |
| D | 12 | 227 | 61733 | 266.26 | 940 | 912 | 228.4 |
| D | 2 | 234 | 52212 | 224.58 | 940 | 912 | 228.4 |
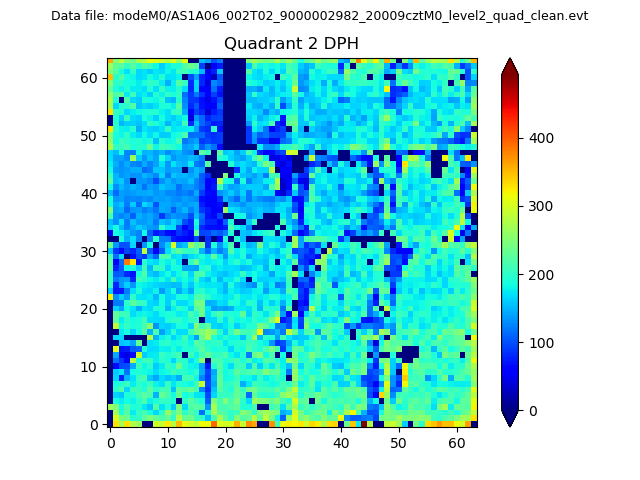
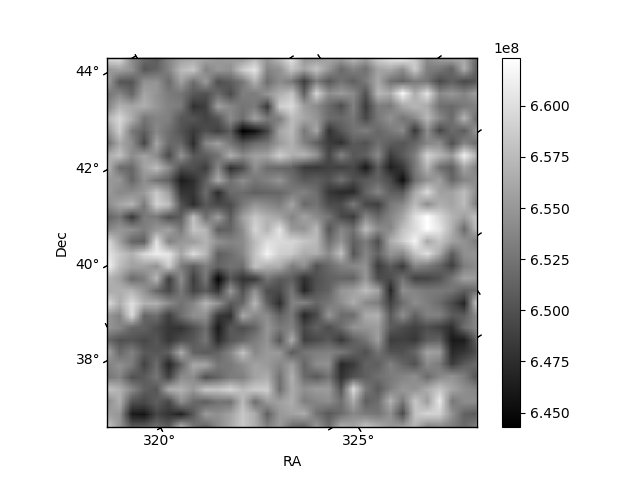
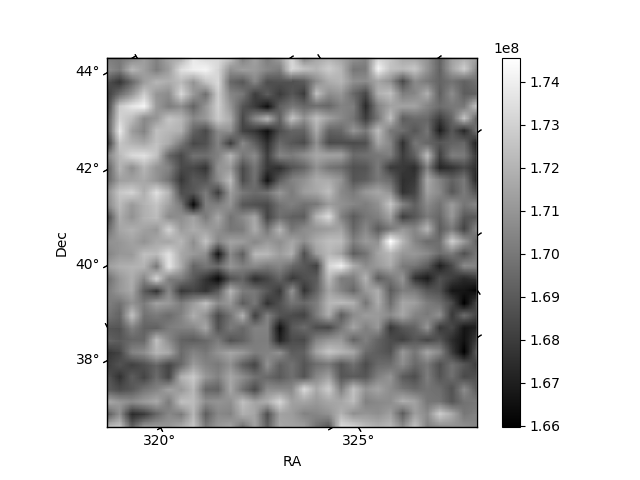
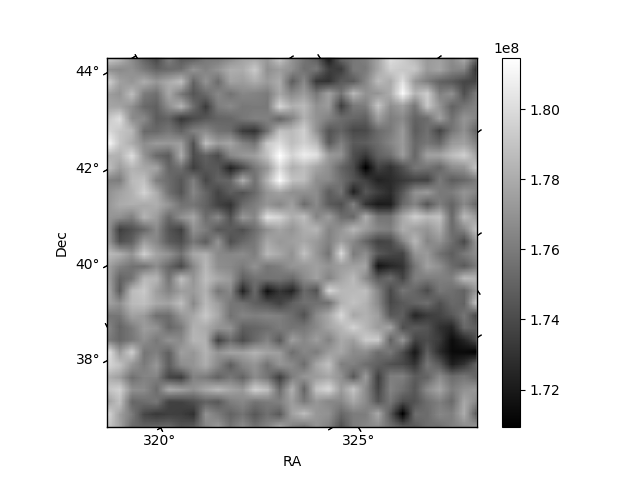
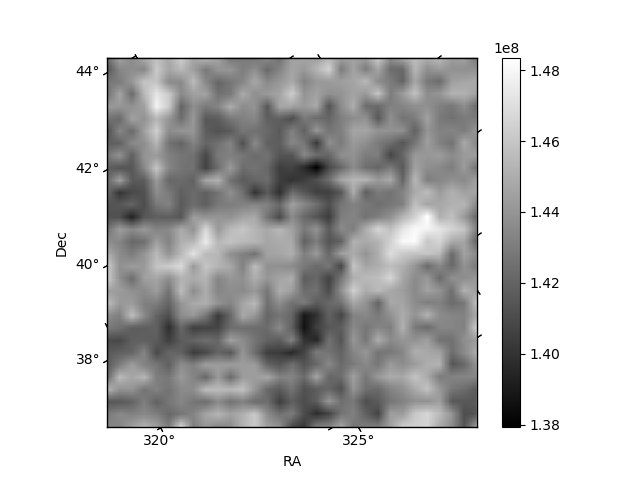
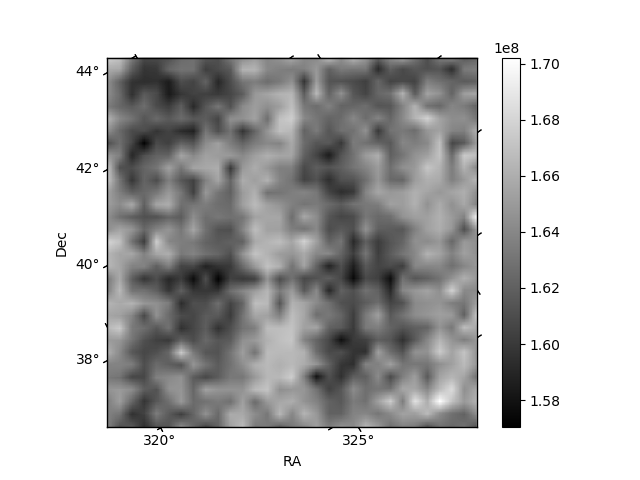
Histogram calculated using DETX and DETY for each event in the final _common_clean file
| Quadrant A | 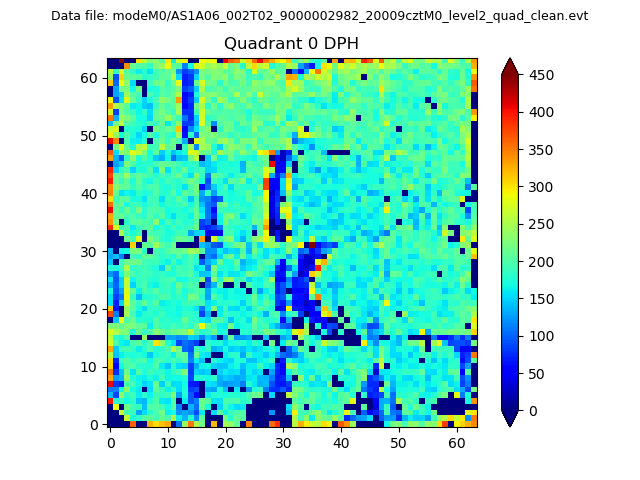 |
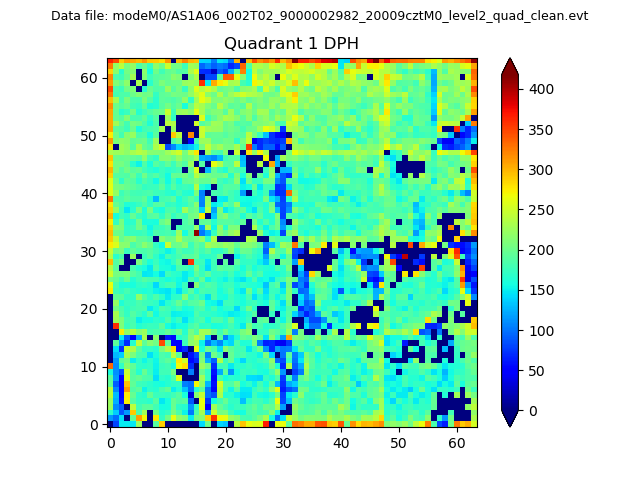 |
Quadrant B |
|---|---|---|---|
| Quadrant D | 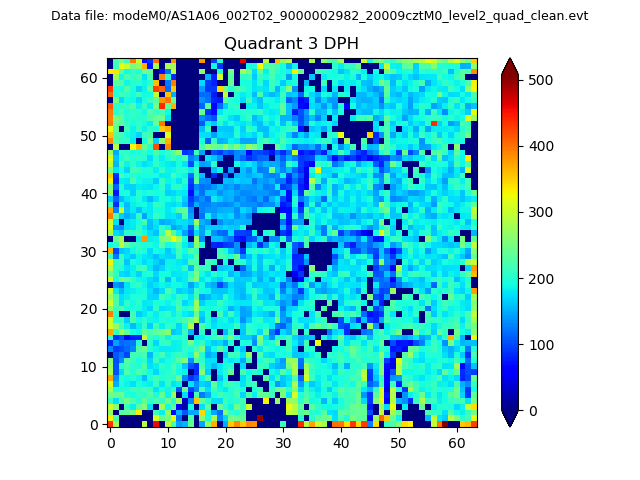 |
 |
Quadrant C |
| Plot type | Count rate plots | Images |
|---|---|---|
| Comparison with Poisson distribution Blue bars denote a histogram of data divided into 1 sec bins. Red curve is a Poisson curve with rate = median count rate of data. |
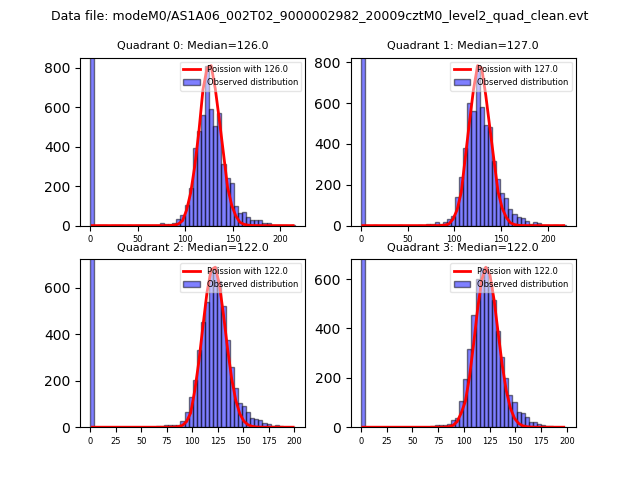 |
 |
| Quadrant-wise count rates Data is divided into 100 sec bins |
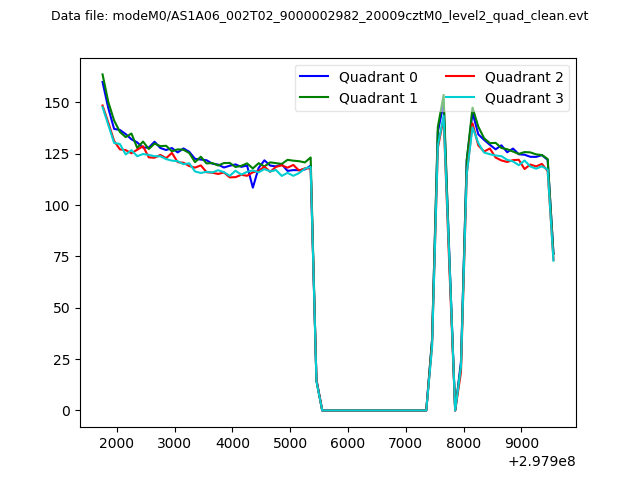 |
|
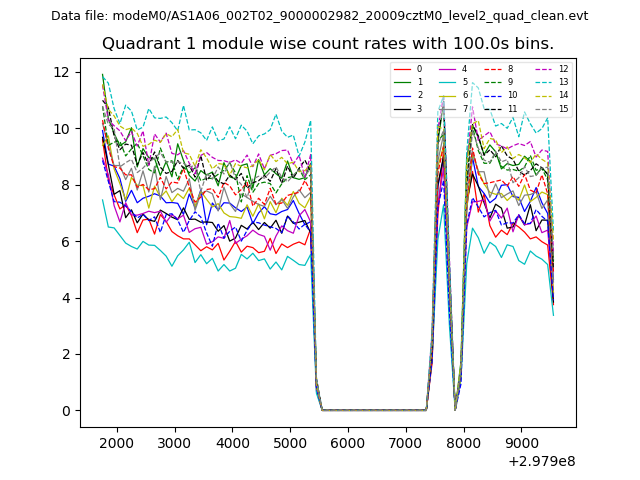
| Module-wise count rates for Quadrant A Data is divided into 100 sec bins |
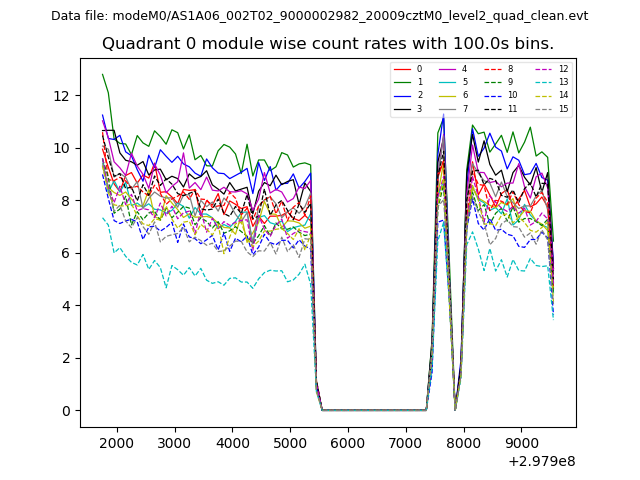 |
 |
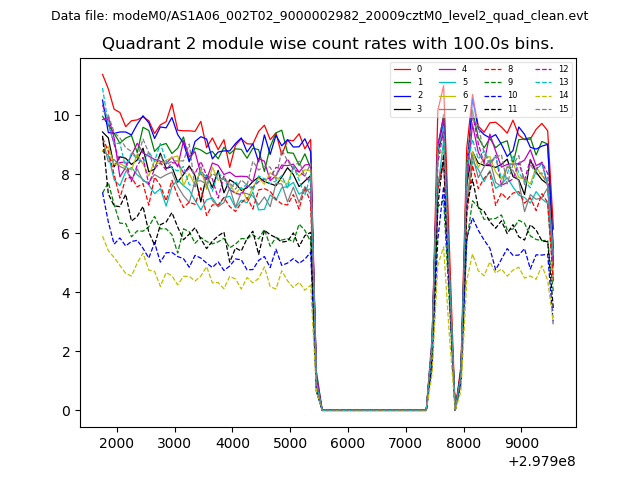
| Module-wise count rates for Quadrant B Data is divided into 100 sec bins |
 |
 |
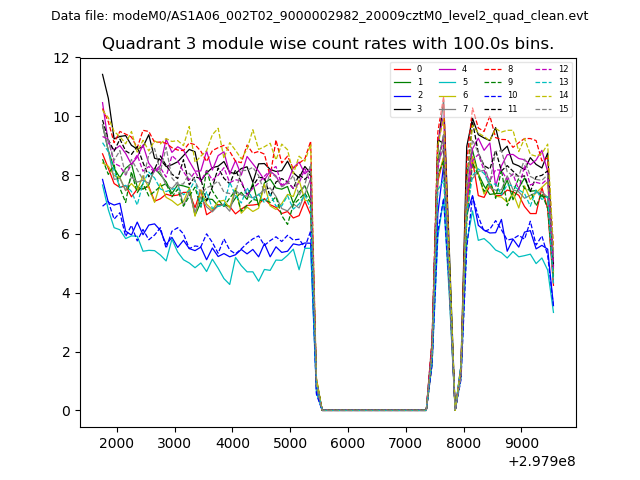
| Module-wise count rates for Quadrant C Data is divided into 100 sec bins |
 |
 |
| Module-wise count rates for Quadrant D Data is divided into 100 sec bins |
 |
 |
| Parameter | Plot |
|---|---|
| CZT HV Monitor | 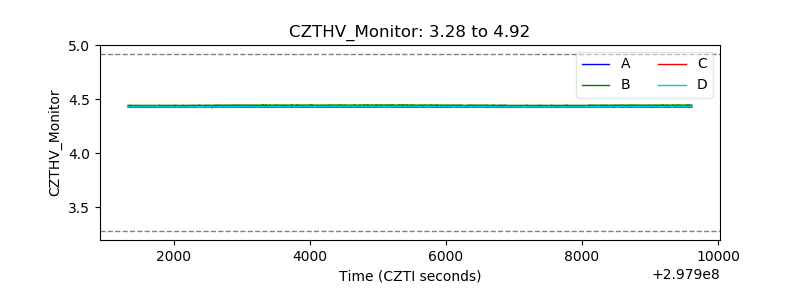 |
| D_VDD | 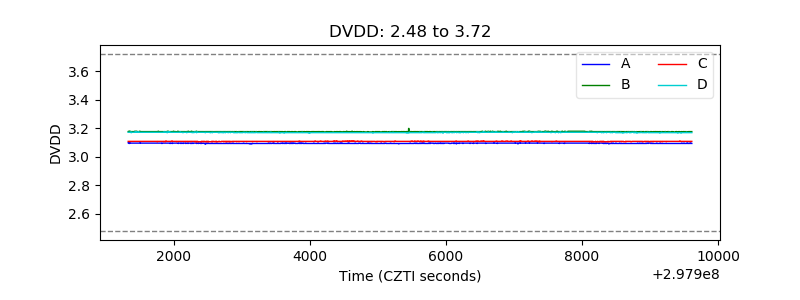 |
| Temperature 1 | 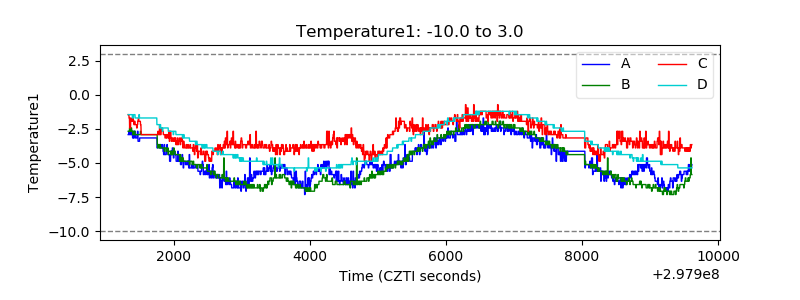 |
| Veto HV Monitor |  |
| Veto LLD | 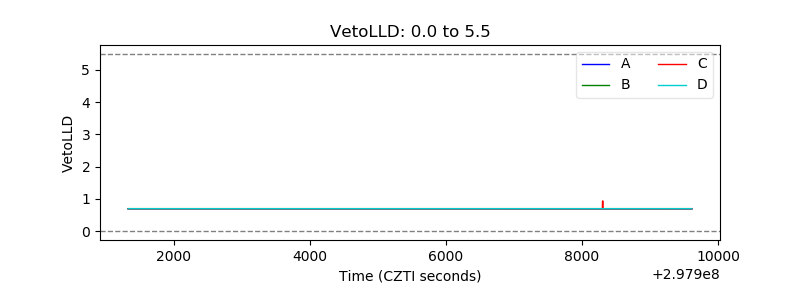 |
| Alpha Counter | 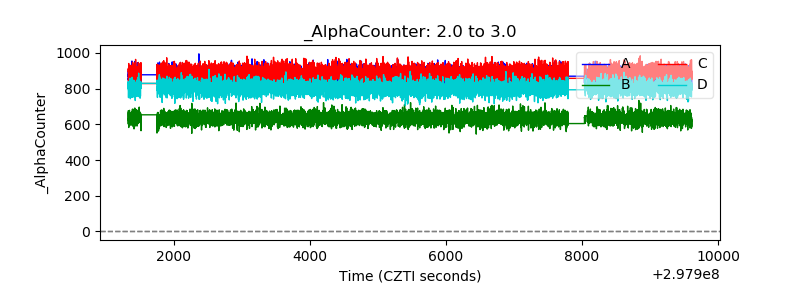 |
| _CPM_Rate | 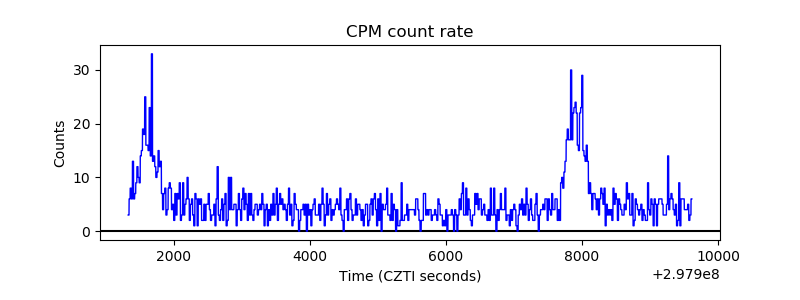 |
| CZT Counter | 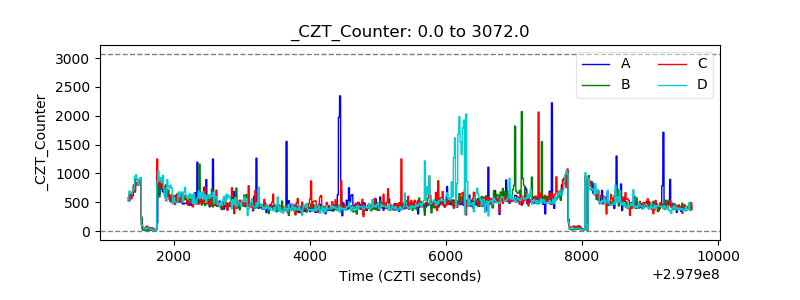 |
| +2.5 Volts monitor |  |
| +5 Volts monitor |  |
| _ROLL_ROT | 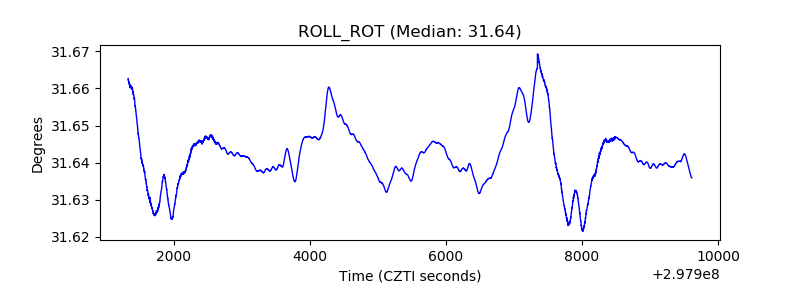 |
| _Roll_DEC | 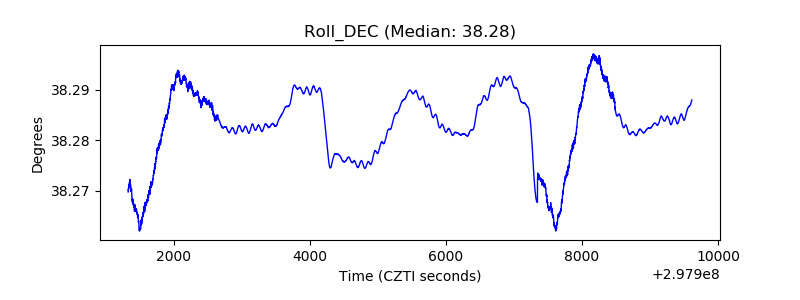 |
| _Roll_RA | 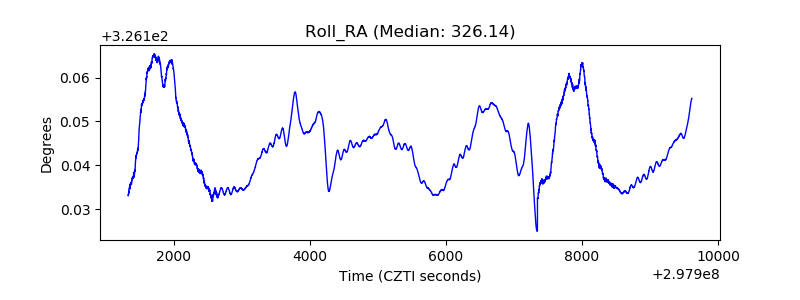 |
| Veto Counter | 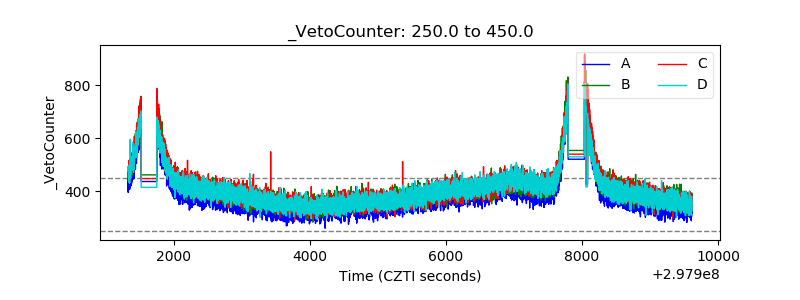 |