| Param | Original file | Final file |
|---|---|---|
| Filename | modeM0/AS1A06_002T02_9000002982_20012cztM0_level2.evt | modeM0/AS1A06_002T02_9000002982_20012cztM0_level2_quad_clean.evt |
| Size (bytes) | 1,467,564,480 | 242,815,680 |
| Size | 1.4 GB | 231.6 MB |
| Events in quadrant A | 12,886,086 | 1,517,321 |
| Events in quadrant B | 9,200,874 | 1,574,197 |
| Events in quadrant C | 10,319,650 | 1,502,310 |
| Events in quadrant D | 10,786,036 | 1,481,414 |
| Mode M9 | |||
|---|---|---|---|
| Quadrant | BADHDUFLAG | Total packets | Discarded packets |
| A | 0 | 21 | 0 |
| B | 0 | 21 | 0 |
| C | 0 | 21 | 0 |
| D | 0 | 21 | 0 |
| Mode SS | |||
|---|---|---|---|
| Quadrant | BADHDUFLAG | Total packets | Discarded packets |
| A | 0 | 380 | 0 |
| B | 0 | 380 | 0 |
| C | 0 | 380 | 0 |
| D | 0 | 380 | 0 |
| Mode M0 | |||
|---|---|---|---|
| Quadrant | BADHDUFLAG | Total packets | Discarded packets |
| A | 0 | 50790 | 4 |
| B | 0 | 39877 | 4 |
| C | 0 | 42823 | 4 |
| D | 0 | 45257 | 4 |
| Quadrant | Total seconds | Saturated seconds | Saturation percentage |
|---|---|---|---|
| A | 18554 | 1295 | 6.979627% |
| B | 18554 | 294 | 1.584564% |
| C | 18554 | 452 | 2.436132% |
| D | 18554 | 474 | 2.554705% |
Noise dominated data is calculated using 1-second bins in cleaned event files. If a bin has >2000 counts, and if more than 50% of those come from <1% of pixels, then it is considered to be noise-dominated and hence unusable.
| Quadrant | # 1 sec bins | Bins with >0 counts | Bins with >2000 counts | High rate bins dominated by noise | Noise dominated (total time) | Noise dominated (detector-on time) | Marked lightcurve |
|---|---|---|---|---|---|---|---|
| A | 20774 | 18559 | 958 | 958 | 4.61% | 5.16% | 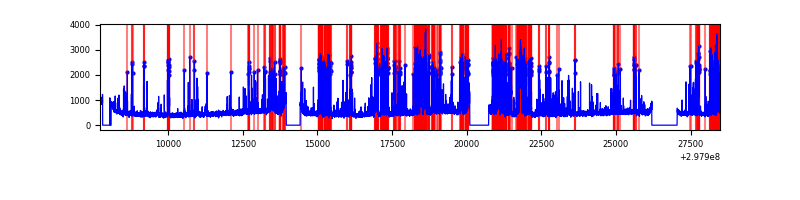 |
| B | 20774 | 18559 | 50 | 50 | 0.24% | 0.27% | 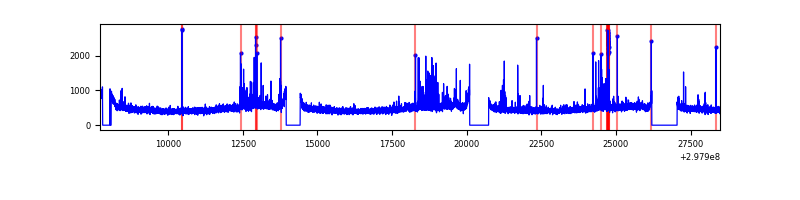 |
| C | 20774 | 18559 | 53 | 53 | 0.26% | 0.29% | 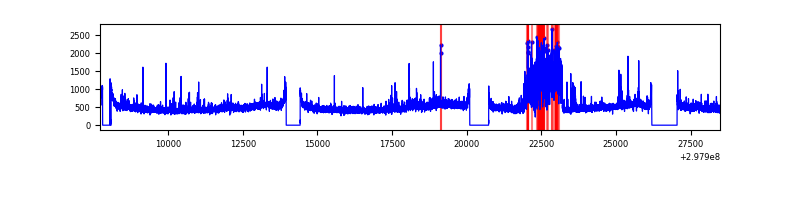 |
| D | 20774 | 18559 | 345 | 345 | 1.66% | 1.86% |  |
Top three noisy pixels from each quadrant. If the there are fewer than three noisy pixels in the level2.evt file, extra rows are filled as -1
| Pixel properties | Quadrant properties | ||||||
|---|---|---|---|---|---|---|---|
| Quadrant | DetID | PixID | Counts | Sigma | Mean | Median | Sigma |
| A | 14 | 238 | 4164473 | 9489.13 | 2175 | 2130 | 438.6 |
| A | 14 | 254 | 344189 | 779.81 | 2175 | 2130 | 438.6 |
| A | 13 | 254 | 23097 | 47.8 | 2175 | 2130 | 438.6 |
| B | 7 | 220 | 250941 | 588.87 | 2208 | 2152 | 422.5 |
| B | 4 | 171 | 111291 | 258.33 | 2208 | 2152 | 422.5 |
| B | 12 | 111 | 52018 | 118.03 | 2208 | 2152 | 422.5 |
| C | 9 | 221 | 1435499 | 2883.41 | 2118 | 2128 | 497.1 |
| C | 14 | 238 | 330927 | 661.42 | 2118 | 2128 | 497.1 |
| C | 0 | 207 | 170863 | 339.43 | 2118 | 2128 | 497.1 |
| D | 12 | 218 | 1152075 | 2210.43 | 2144 | 2081 | 520.3 |
| D | 1 | 52 | 858592 | 1646.32 | 2144 | 2081 | 520.3 |
| D | 1 | 20 | 281405 | 536.9 | 2144 | 2081 | 520.3 |
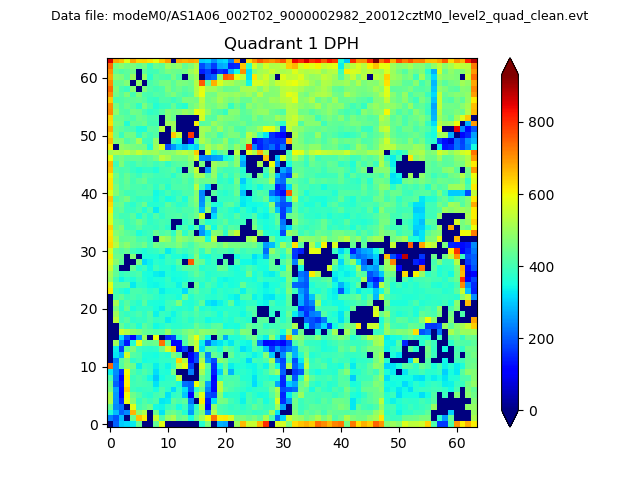
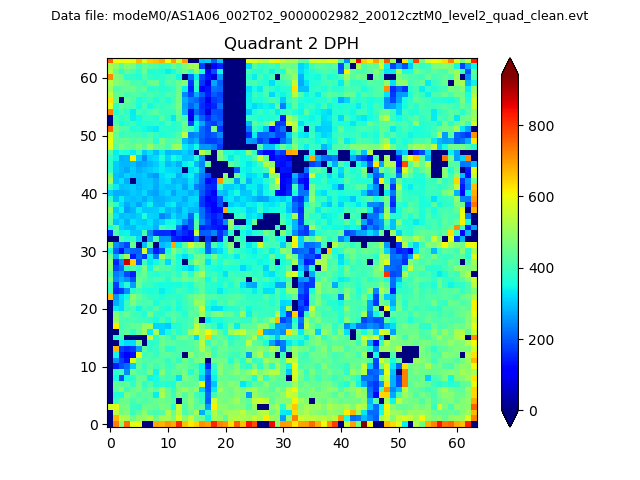
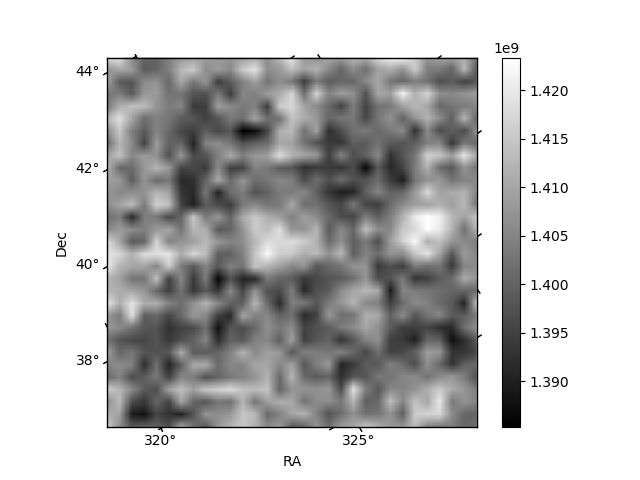
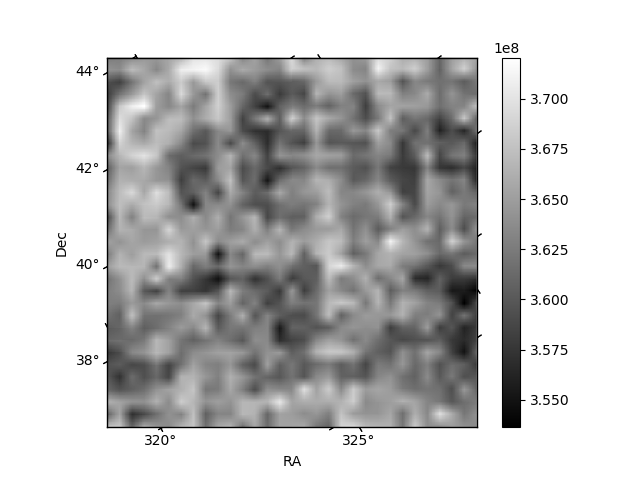
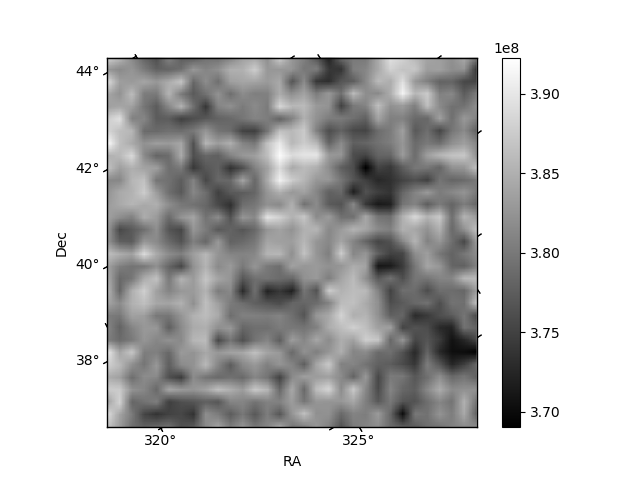
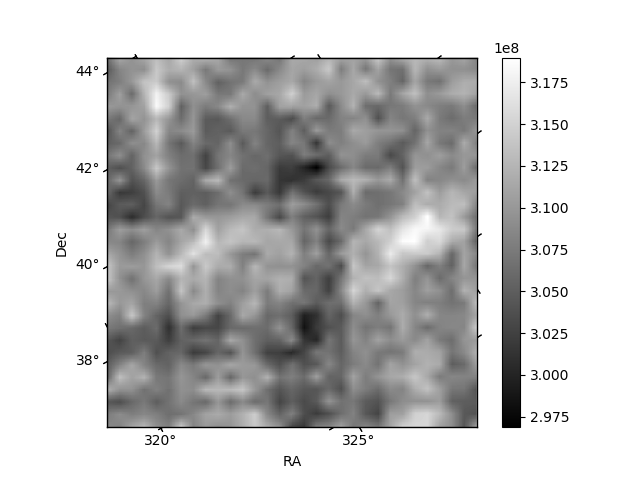
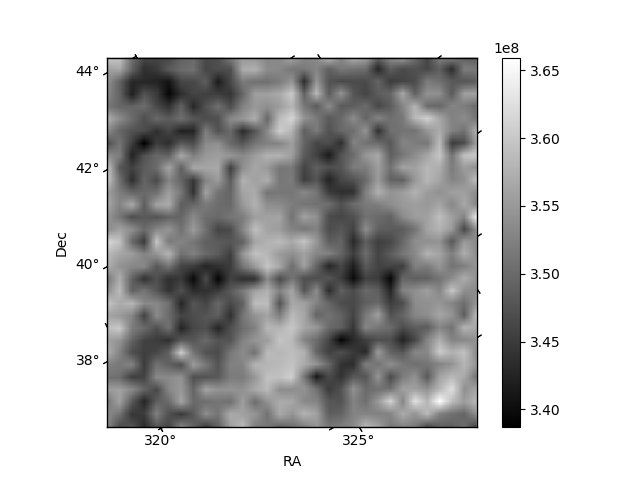
Histogram calculated using DETX and DETY for each event in the final _common_clean file
| Quadrant A | 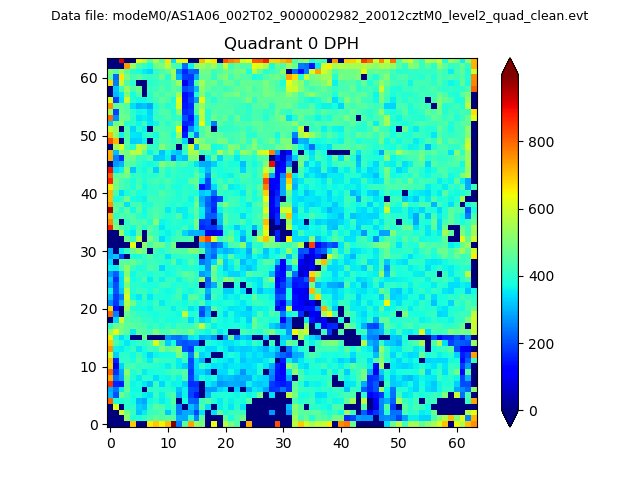 |
 |
Quadrant B |
|---|---|---|---|
| Quadrant D | 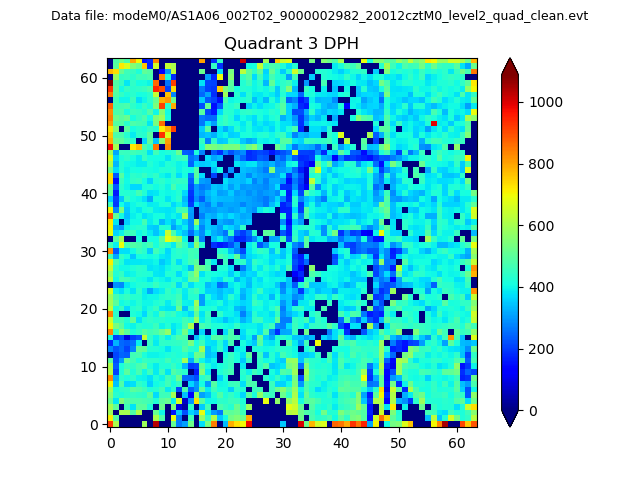 |
 |
Quadrant C |
| Plot type | Count rate plots | Images |
|---|---|---|
| Comparison with Poisson distribution Blue bars denote a histogram of data divided into 1 sec bins. Red curve is a Poisson curve with rate = median count rate of data. |
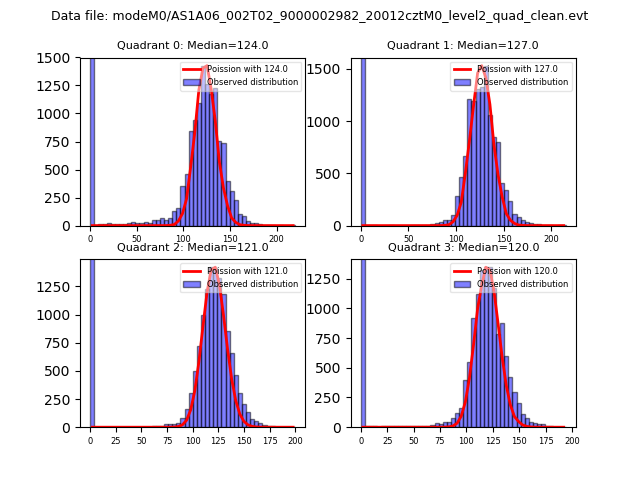 |
 |
| Quadrant-wise count rates Data is divided into 100 sec bins |
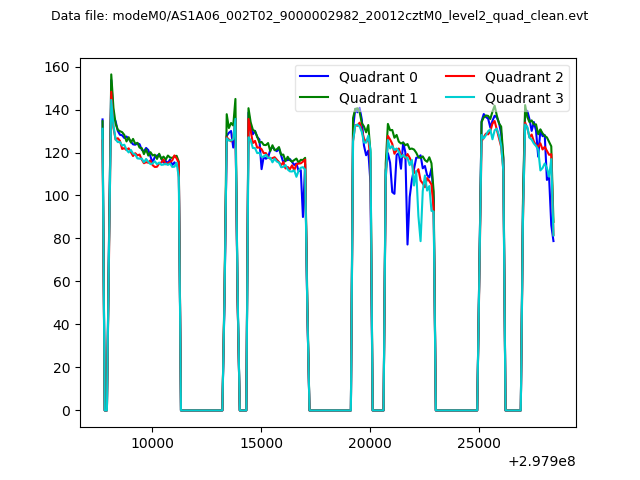 |
|
| Module-wise count rates for Quadrant A Data is divided into 100 sec bins |
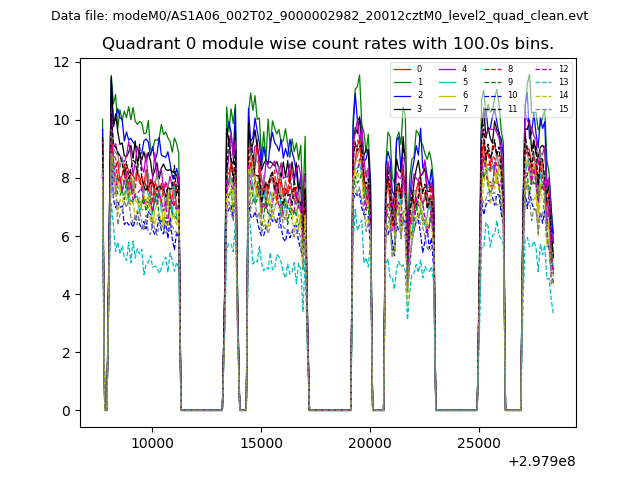 |
 |
| Module-wise count rates for Quadrant B Data is divided into 100 sec bins |
 |
 |
| Module-wise count rates for Quadrant C Data is divided into 100 sec bins |
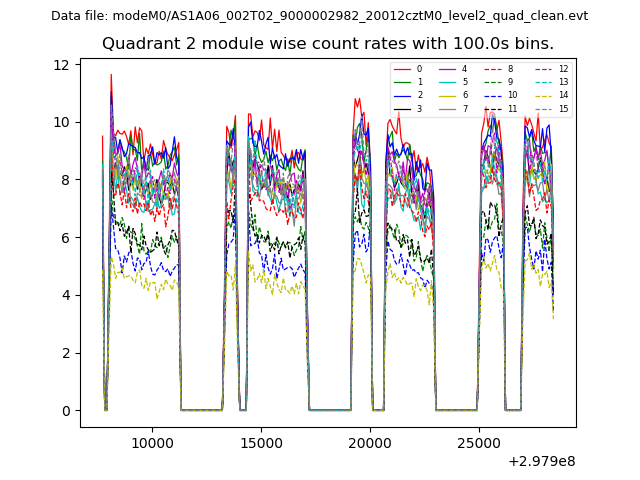 |
 |
| Module-wise count rates for Quadrant D Data is divided into 100 sec bins |
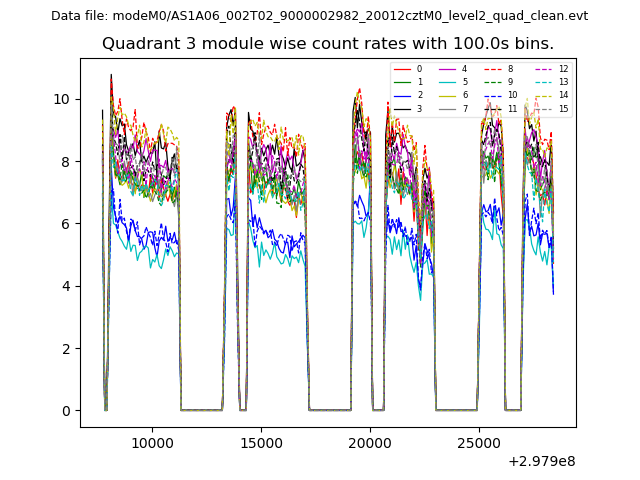 |
 |
| Parameter | Plot |
|---|---|
| CZT HV Monitor | 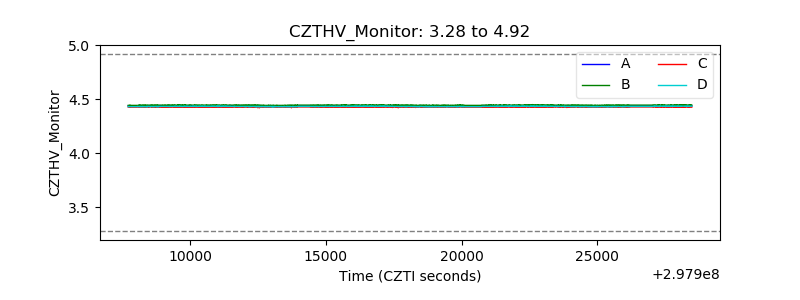 |
| D_VDD |  |
| Temperature 1 | 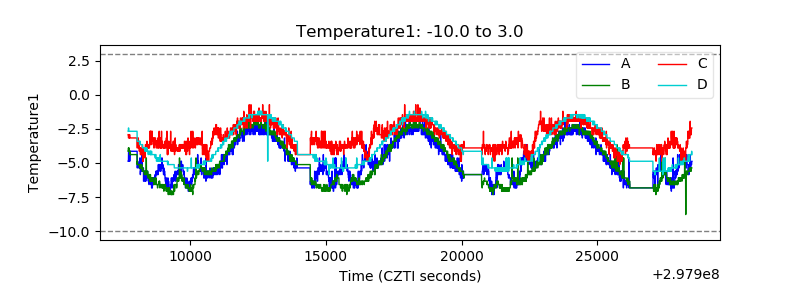 |
| Veto HV Monitor | 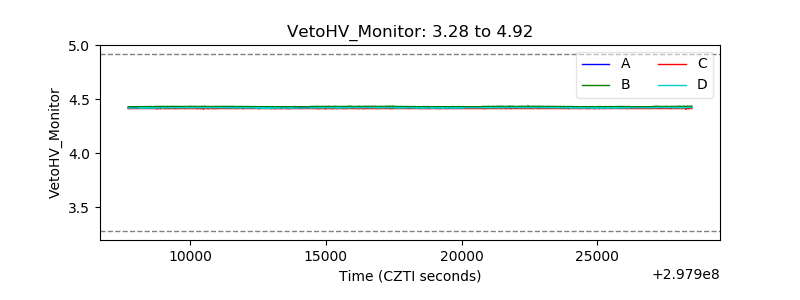 |
| Veto LLD |  |
| Alpha Counter | 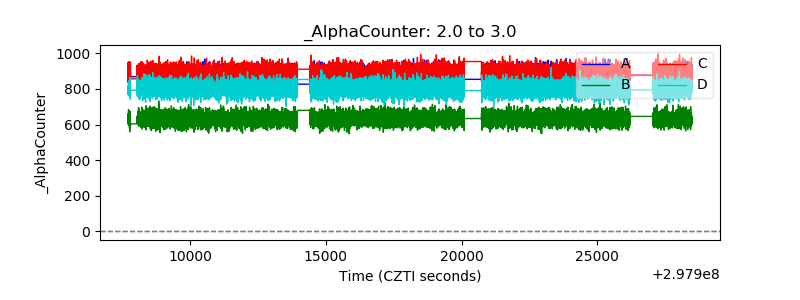 |
| _CPM_Rate | 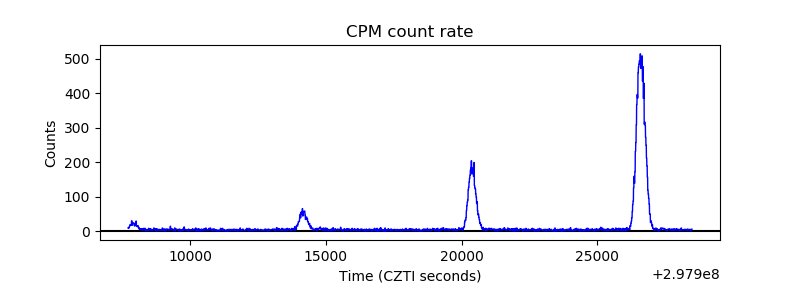 |
| CZT Counter | 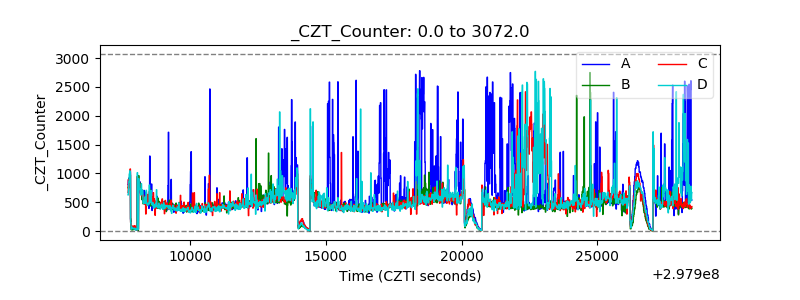 |
| +2.5 Volts monitor |  |
| +5 Volts monitor |  |
| _ROLL_ROT | 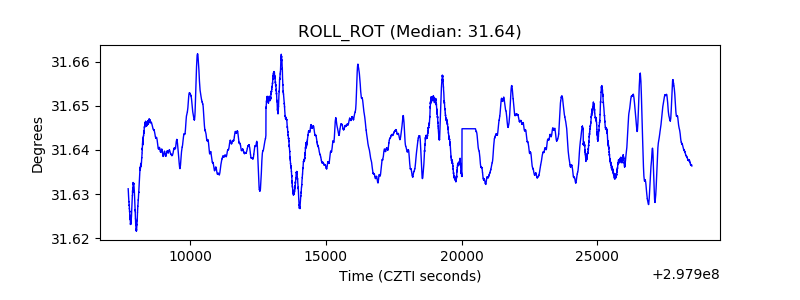 |
| _Roll_DEC | 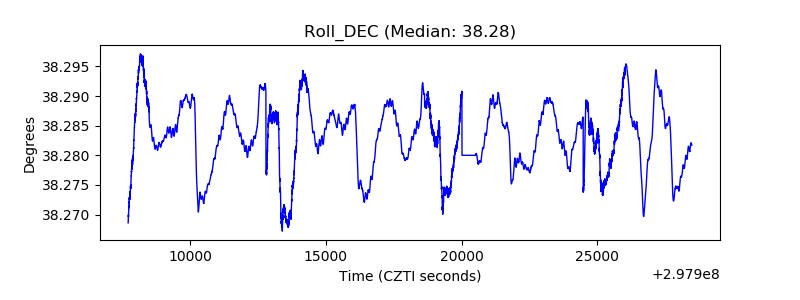 |
| _Roll_RA | 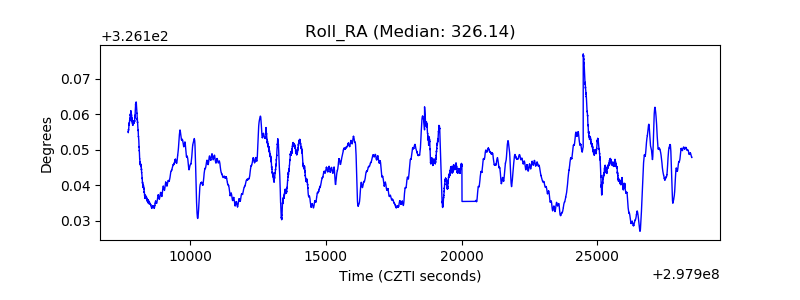 |
| Veto Counter |  |