| Param | Original file | Final file |
|---|---|---|
| Filename | modeM0/AS1A06_002T02_9000002982_20013cztM0_level2.evt | modeM0/AS1A06_002T02_9000002982_20013cztM0_level2_quad_clean.evt |
| Size (bytes) | 319,233,600 | 40,501,440 |
| Size | 304.4 MB | 38.6 MB |
| Events in quadrant A | 2,838,231 | 231,391 |
| Events in quadrant B | 1,929,159 | 248,039 |
| Events in quadrant C | 1,915,541 | 234,950 |
| Events in quadrant D | 2,712,670 | 229,378 |
| Mode SS | |||
|---|---|---|---|
| Quadrant | BADHDUFLAG | Total packets | Discarded packets |
| A | 0 | 80 | 0 |
| B | 0 | 80 | 0 |
| C | 0 | 80 | 0 |
| D | 0 | 80 | 0 |
| Mode M0 | |||
|---|---|---|---|
| Quadrant | BADHDUFLAG | Total packets | Discarded packets |
| A | 0 | 11128 | 0 |
| B | 0 | 8356 | 0 |
| C | 0 | 8286 | 0 |
| D | 0 | 10797 | 0 |
| Quadrant | Total seconds | Saturated seconds | Saturation percentage |
|---|---|---|---|
| A | 3994 | 281 | 7.035553% |
| B | 3995 | 30 | 0.750939% |
| C | 3995 | 16 | 0.400501% |
| D | 3995 | 49 | 1.226533% |
Noise dominated data is calculated using 1-second bins in cleaned event files. If a bin has >2000 counts, and if more than 50% of those come from <1% of pixels, then it is considered to be noise-dominated and hence unusable.
| Quadrant | # 1 sec bins | Bins with >0 counts | Bins with >2000 counts | High rate bins dominated by noise | Noise dominated (total time) | Noise dominated (detector-on time) | Marked lightcurve |
|---|---|---|---|---|---|---|---|
| A | 3994 | 3994 | 220 | 220 | 5.51% | 5.51% | 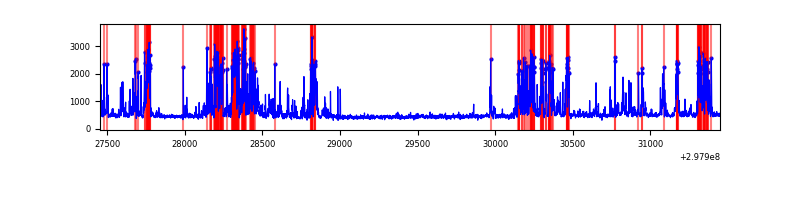 |
| B | 3995 | 3995 | 17 | 17 | 0.43% | 0.43% | 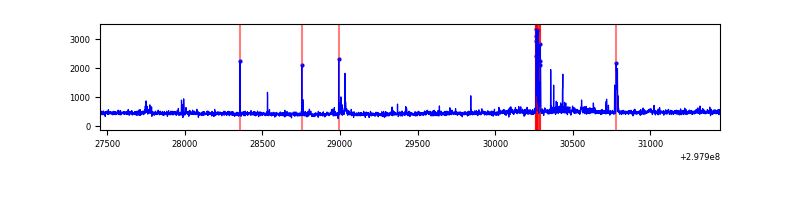 |
| C | 3995 | 3995 | 0 | 0 | 0.00% | 0.00% | 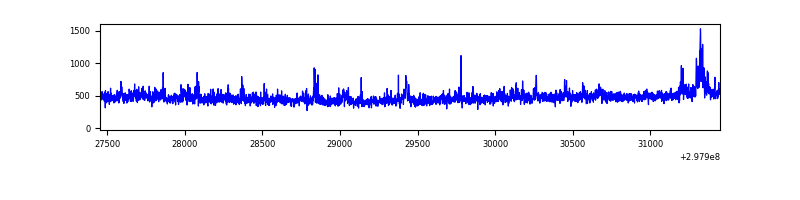 |
| D | 3995 | 3995 | 39 | 39 | 0.98% | 0.98% | 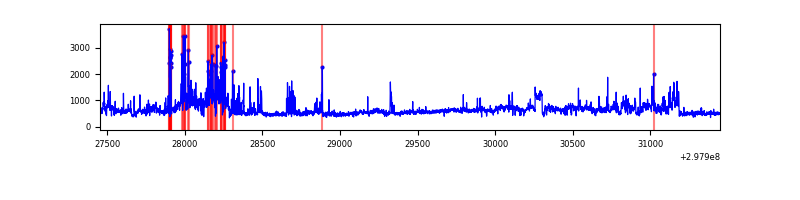 |
Top three noisy pixels from each quadrant. If the there are fewer than three noisy pixels in the level2.evt file, extra rows are filled as -1
| Pixel properties | Quadrant properties | ||||||
|---|---|---|---|---|---|---|---|
| Quadrant | DetID | PixID | Counts | Sigma | Mean | Median | Sigma |
| A | 14 | 238 | 1106842 | 12105.32 | 448 | 440 | 91.4 |
| A | 0 | 226 | 3889 | 37.74 | 448 | 440 | 91.4 |
| A | 13 | 254 | 3882 | 37.66 | 448 | 440 | 91.4 |
| B | 7 | 220 | 62241 | 693.07 | 455 | 443 | 89.2 |
| B | 15 | 32 | 36252 | 401.6 | 455 | 443 | 89.2 |
| B | 4 | 80 | 25062 | 276.11 | 455 | 443 | 89.2 |
| C | 3 | 233 | 71997 | 693.86 | 436 | 439 | 103.1 |
| C | 14 | 238 | 68501 | 659.96 | 436 | 439 | 103.1 |
| C | 9 | 221 | 60169 | 579.17 | 436 | 439 | 103.1 |
| D | 1 | 20 | 632783 | 5805.8 | 443 | 429 | 108.9 |
| D | 12 | 218 | 239537 | 2195.31 | 443 | 429 | 108.9 |
| D | 1 | 52 | 136864 | 1252.64 | 443 | 429 | 108.9 |
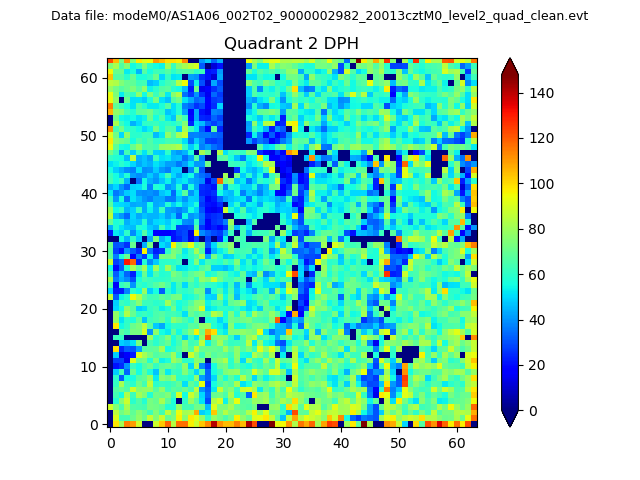
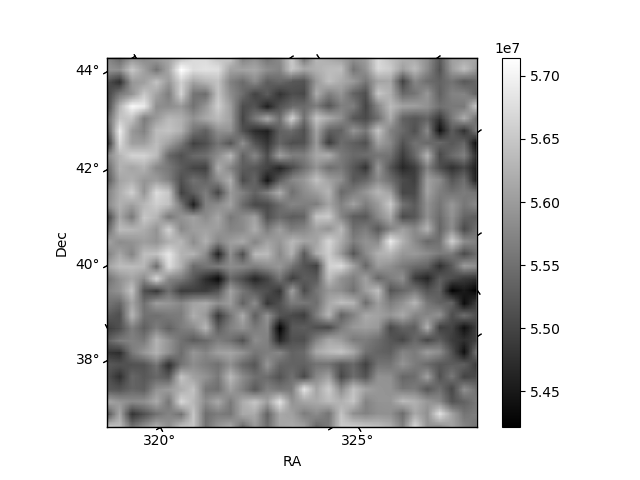
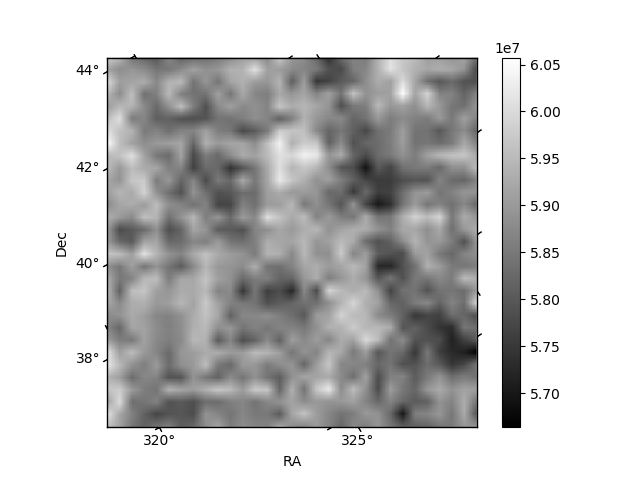
Histogram calculated using DETX and DETY for each event in the final _common_clean file
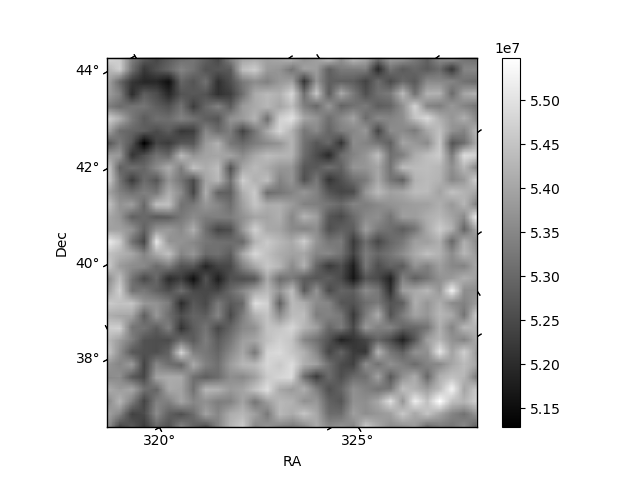
| Quadrant A |  |
 |
Quadrant B |
|---|---|---|---|
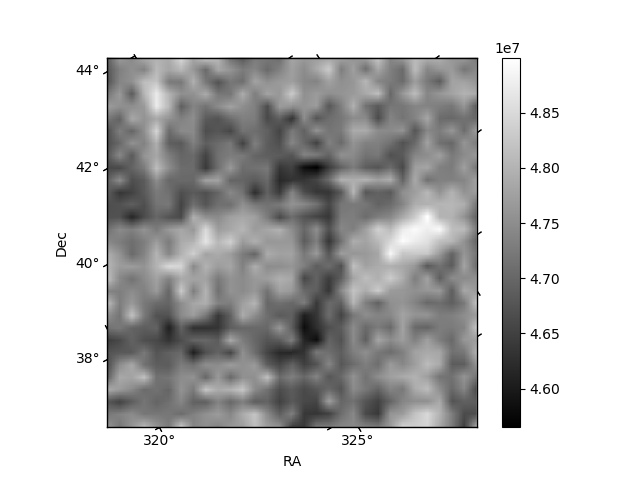
| Quadrant D |  |
 |
Quadrant C |
| Plot type | Count rate plots | Images |
|---|---|---|
| Comparison with Poisson distribution Blue bars denote a histogram of data divided into 1 sec bins. Red curve is a Poisson curve with rate = median count rate of data. |
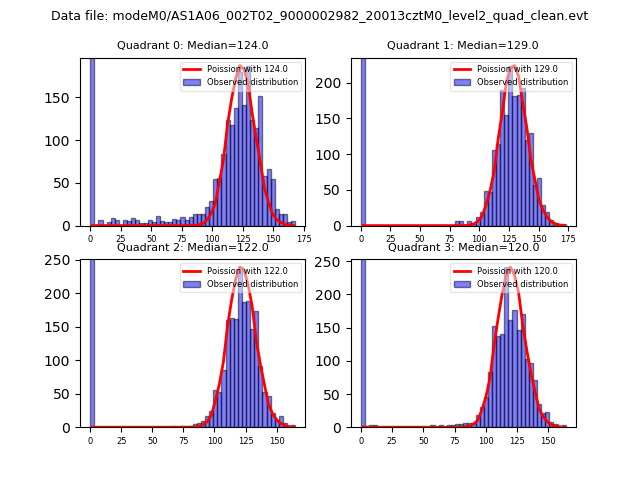 |
 |
| Quadrant-wise count rates Data is divided into 100 sec bins |
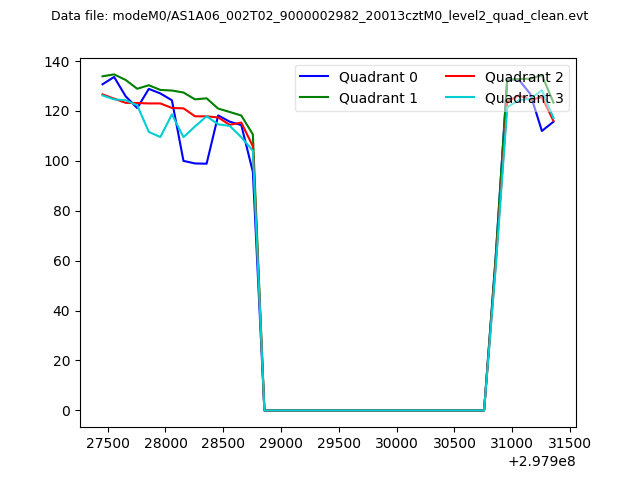 |
|
| Module-wise count rates for Quadrant A Data is divided into 100 sec bins |
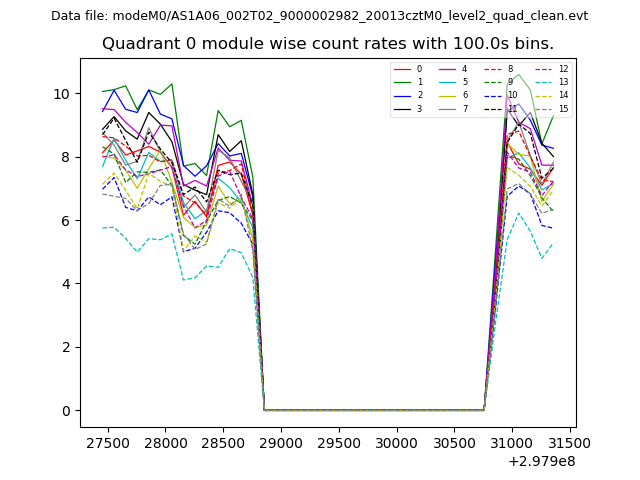 |
 |
| Module-wise count rates for Quadrant B Data is divided into 100 sec bins |
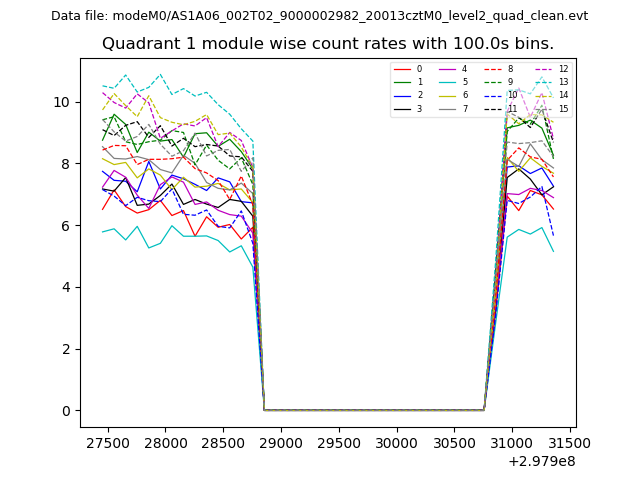 |
 |
| Module-wise count rates for Quadrant C Data is divided into 100 sec bins |
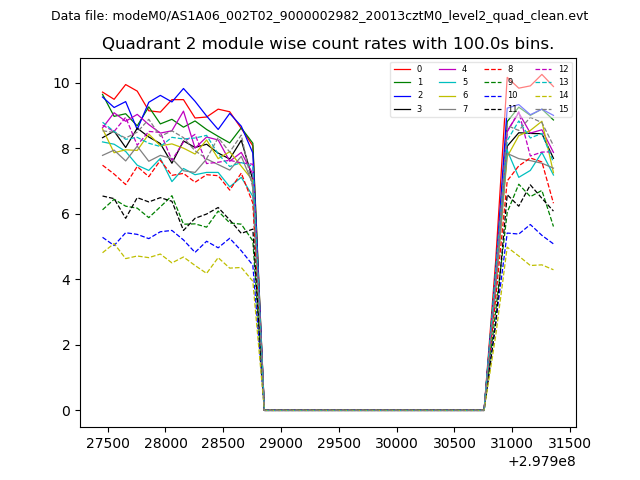 |
 |
| Module-wise count rates for Quadrant D Data is divided into 100 sec bins |
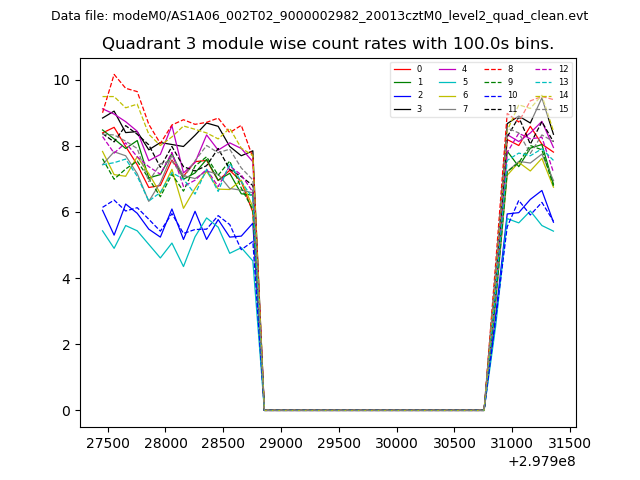 |
 |
| Parameter | Plot |
|---|---|
| CZT HV Monitor | 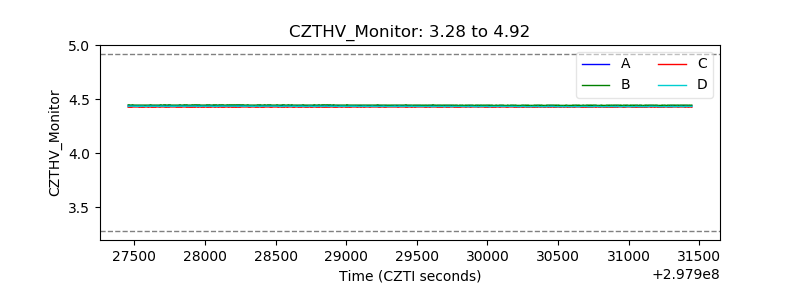 |
| D_VDD |  |
| Temperature 1 | 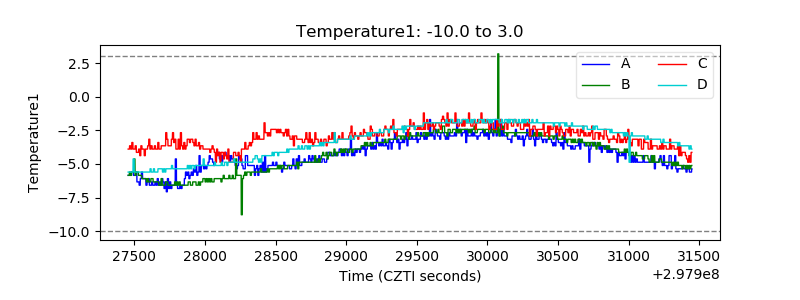 |
| Veto HV Monitor | 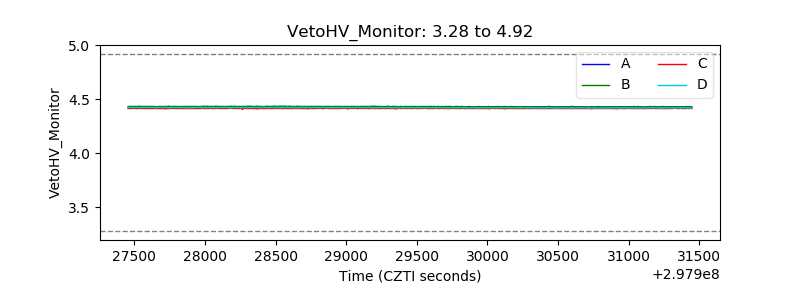 |
| Veto LLD | 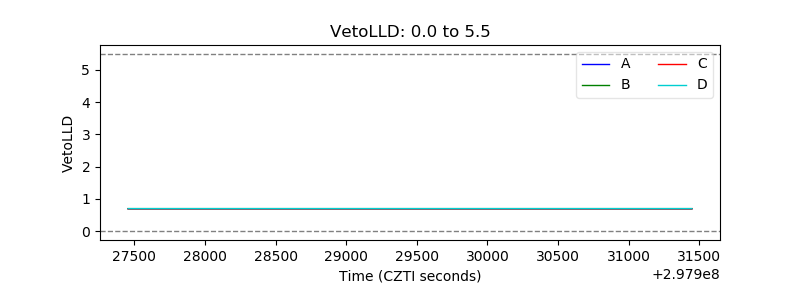 |
| Alpha Counter | 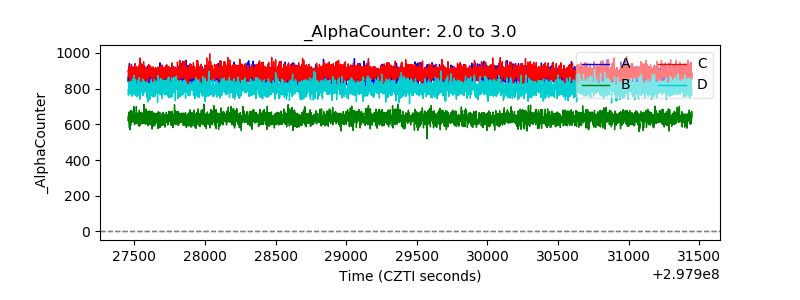 |
| _CPM_Rate | 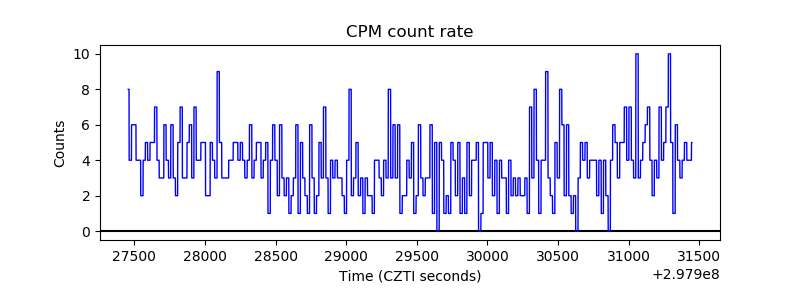 |
| CZT Counter | 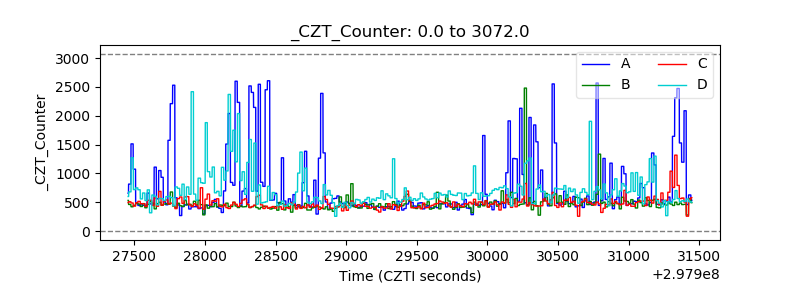 |
| +2.5 Volts monitor |  |
| +5 Volts monitor | 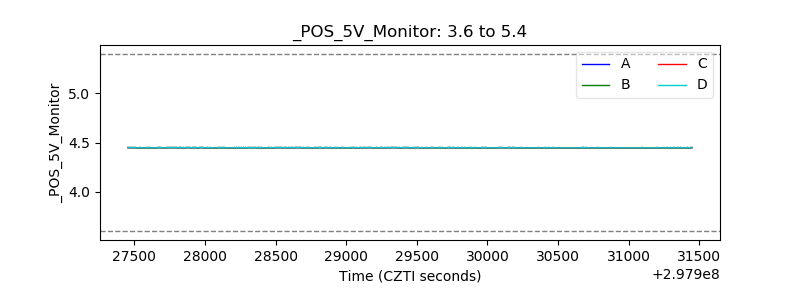 |
| _ROLL_ROT | 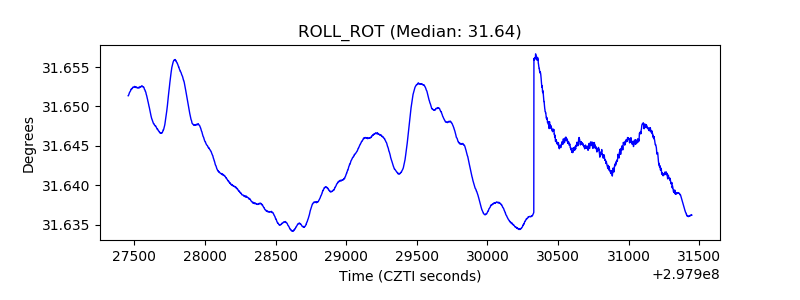 |
| _Roll_DEC | 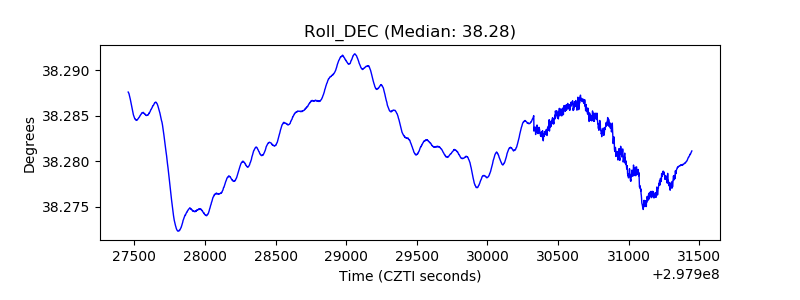 |
| _Roll_RA | 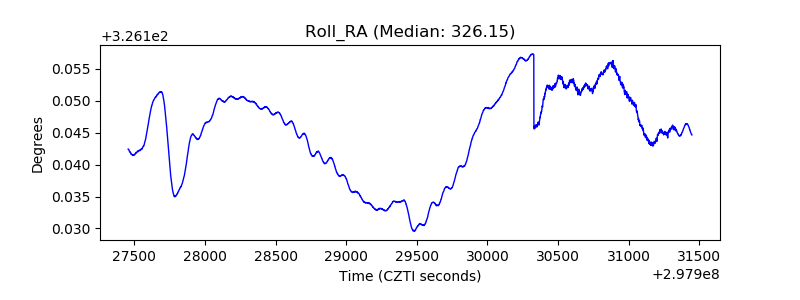 |
| Veto Counter | 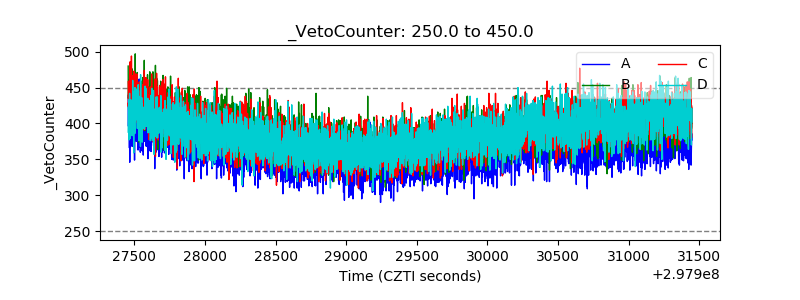 |