| Param | Original file | Final file |
|---|---|---|
| Filename | modeM0/AS1C04_001T01_9000002984cztM0_level2.fits | modeM0/AS1C04_001T01_9000002984cztM0_level2_quad_clean.evt |
| Size (bytes) | 760,818,240 | 809,867,520 |
| Size | 725.6 MB | 772.3 MB |
| Events in quadrant A | 4,703,356 | 5,086,550 |
| Events in quadrant B | 4,504,906 | 5,140,969 |
| Events in quadrant C | 4,657,614 | 5,029,150 |
| Events in quadrant D | 3,798,314 | 3,899,944 |
| Mode SS | |||
|---|---|---|---|
| Quadrant | BADHDUFLAG | Total packets | Discarded packets |
| A | 0 | 1600 | 0 |
| B | 0 | 1600 | 0 |
| C | 0 | 1600 | 0 |
| D | 0 | 1600 | 0 |
| Mode M9 | |||
|---|---|---|---|
| Quadrant | BADHDUFLAG | Total packets | Discarded packets |
| A | 0 | 134 | 0 |
| B | 0 | 134 | 0 |
| C | 0 | 134 | 0 |
| D | 0 | 134 | 0 |
| Mode M0 | |||
|---|---|---|---|
| Quadrant | BADHDUFLAG | Total packets | Discarded packets |
| A | 0 | 190110 | 0 |
| B | 0 | 174324 | 0 |
| C | 0 | 164503 | 0 |
| D | 0 | 265491 | 0 |
| Quadrant | Total seconds | Saturated seconds | Saturation percentage |
|---|---|---|---|
| A | 78328 | 3197 | 4.081554% |
| B | 78327 | 1308 | 1.669922% |
| C | 78328 | 1227 | 1.566490% |
| D | 78327 | 12818 | 16.364727% |
Noise dominated data is calculated using 1-second bins in cleaned event files. If a bin has >2000 counts, and if more than 50% of those come from <1% of pixels, then it is considered to be noise-dominated and hence unusable.
| Quadrant | # 1 sec bins | Bins with >0 counts | Bins with >2000 counts | High rate bins dominated by noise | Noise dominated (total time) | Noise dominated (detector-on time) | Marked lightcurve |
|---|---|---|---|---|---|---|---|
| A | 91754 | 78305 | 0 | 0 | 0.00% | 0.00% |  |
| B | 91754 | 78328 | 0 | 0 | 0.00% | 0.00% |  |
| C | 91754 | 78329 | 0 | 0 | 0.00% | 0.00% |  |
| D | 91754 | 78306 | 0 | 0 | 0.00% | 0.00% |  |
Top three noisy pixels from each quadrant. If the there are fewer than three noisy pixels in the level2.evt file, extra rows are filled as -1
| Pixel properties | Quadrant properties | ||||||
|---|---|---|---|---|---|---|---|
| Quadrant | DetID | PixID | Counts | Sigma | Mean | Median | Sigma |
| A | 0 | 29 | 4679 | 11.81 | 1225 | 1156 | 298.3 |
| A | 7 | 110 | 3731 | 8.63 | 1225 | 1156 | 298.3 |
| A | 9 | 19 | 3690 | 8.5 | 1225 | 1156 | 298.3 |
| B | 5 | 128 | 2965 | 7.94 | 1195 | 1146 | 229.0 |
| B | 3 | 17 | 2948 | 7.87 | 1195 | 1146 | 229.0 |
| B | 14 | 254 | 2936 | 7.82 | 1195 | 1146 | 229.0 |
| C | 3 | 126 | 3226 | 6.63 | 1230 | 1156 | 312.3 |
| C | 12 | 241 | 3174 | 6.46 | 1230 | 1156 | 312.3 |
| C | 3 | 235 | 3125 | 6.3 | 1230 | 1156 | 312.3 |
| D | 10 | 189 | 2812 | 6.34 | 1086 | 993 | 286.8 |
| D | 3 | 14 | 2761 | 6.16 | 1086 | 993 | 286.8 |
| D | 6 | 231 | 2657 | 5.8 | 1086 | 993 | 286.8 |
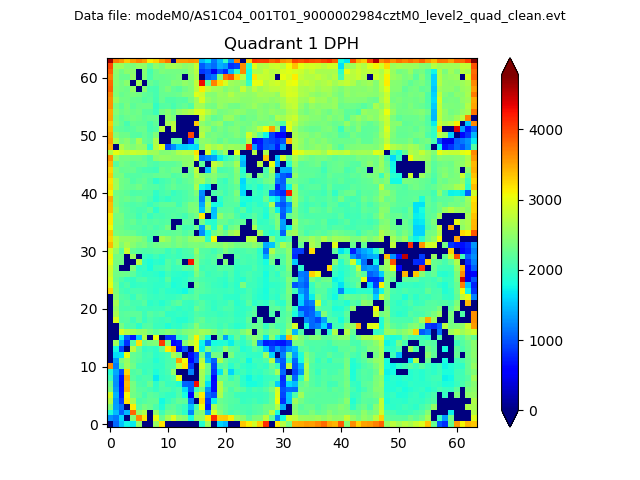
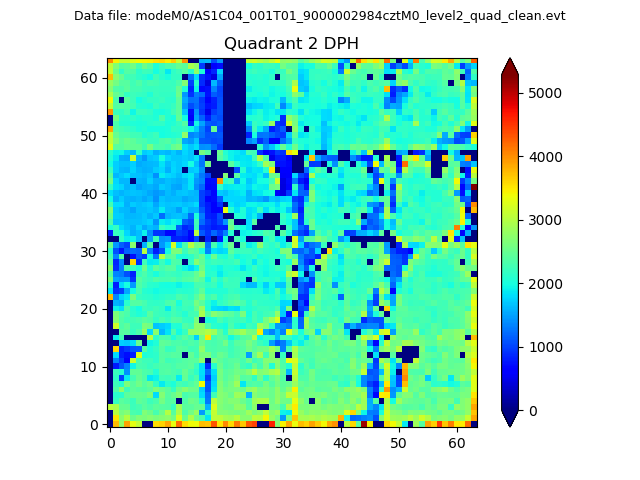
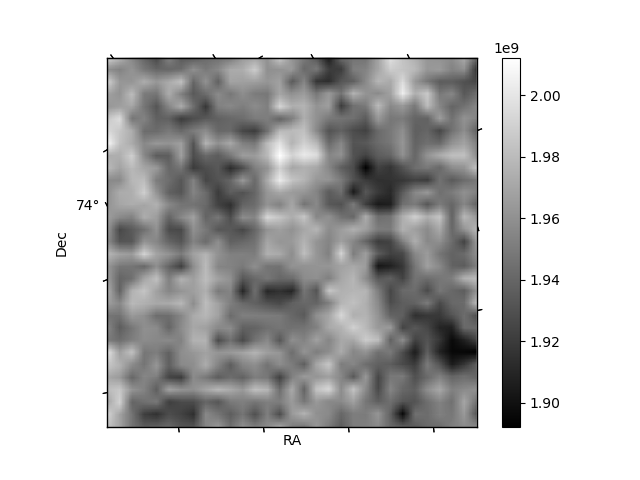
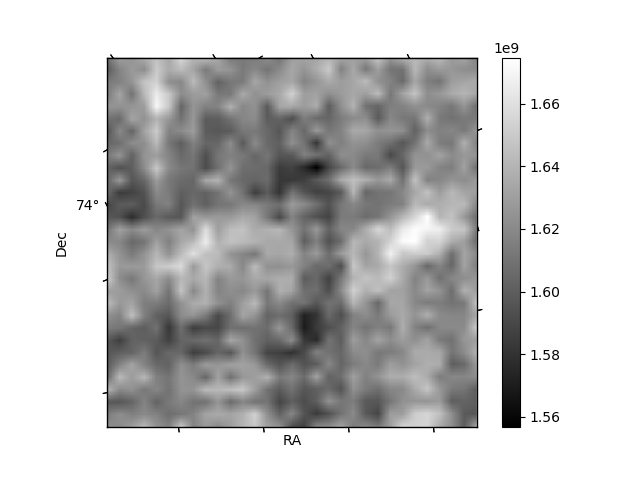
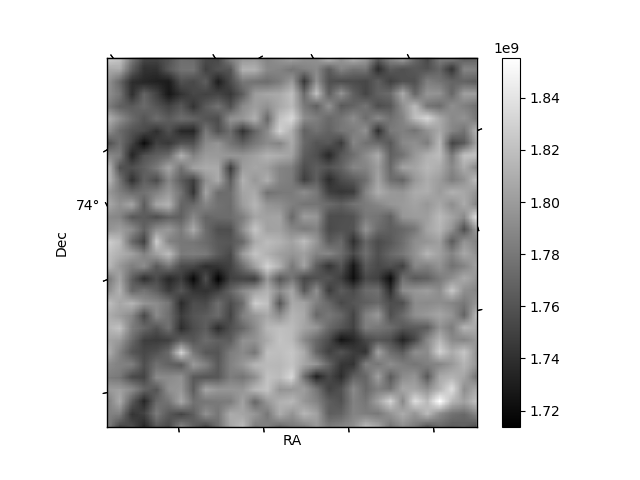
Histogram calculated using DETX and DETY for each event in the final _common_clean file
| Quadrant A |  |
 |
Quadrant B |
|---|---|---|---|
| Quadrant D |  |
 |
Quadrant C |
| Plot type | Count rate plots | Images |
|---|---|---|
| Comparison with Poisson distribution Blue bars denote a histogram of data divided into 1 sec bins. Red curve is a Poisson curve with rate = median count rate of data. |
 |
 |
| Quadrant-wise count rates Data is divided into 100 sec bins |
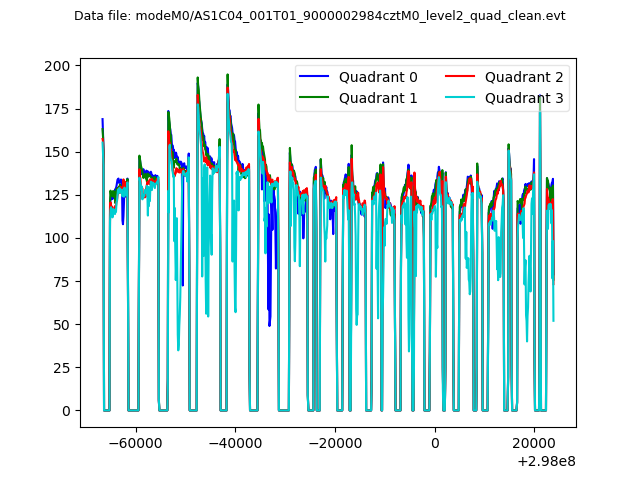 |
|
| Module-wise count rates for Quadrant A Data is divided into 100 sec bins |
 |
 |
| Module-wise count rates for Quadrant B Data is divided into 100 sec bins |
 |
 |
| Module-wise count rates for Quadrant C Data is divided into 100 sec bins |
 |
 |
| Module-wise count rates for Quadrant D Data is divided into 100 sec bins |
 |
 |
| Parameter | Plot |
|---|---|
| CZT HV Monitor | 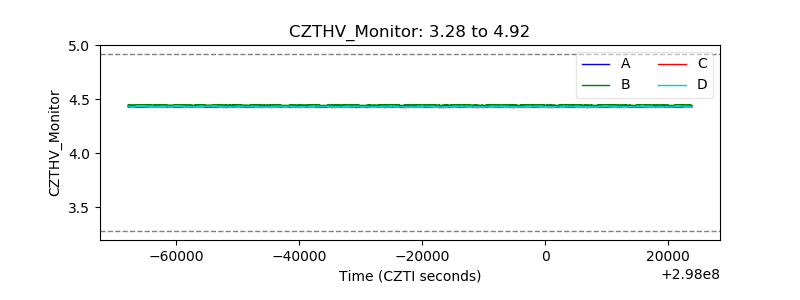 |
| D_VDD | 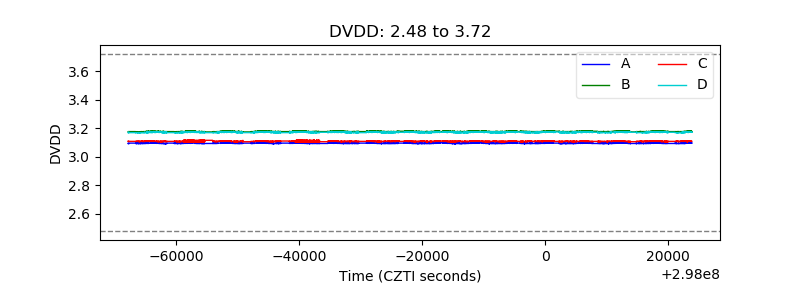 |
| Temperature 1 | 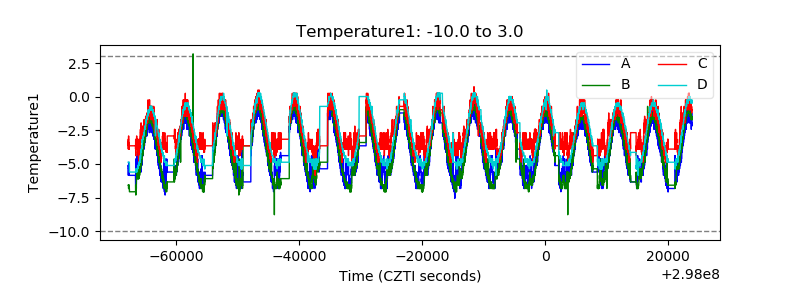 |
| Veto HV Monitor |  |
| Veto LLD | 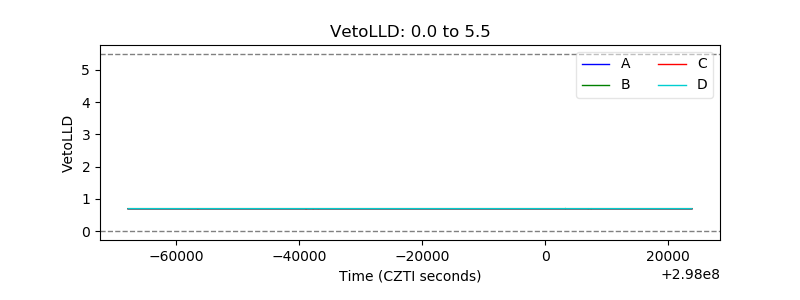 |
| Alpha Counter |  |
| _CPM_Rate | 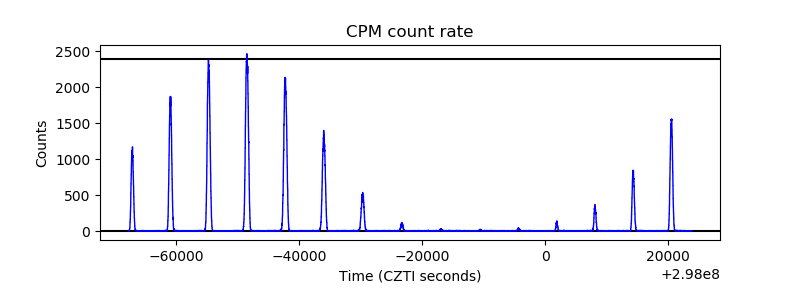 |
| CZT Counter |  |
| +2.5 Volts monitor |  |
| +5 Volts monitor |  |
| _ROLL_ROT |  |
| _Roll_DEC |  |
| _Roll_RA |  |
| Veto Counter | 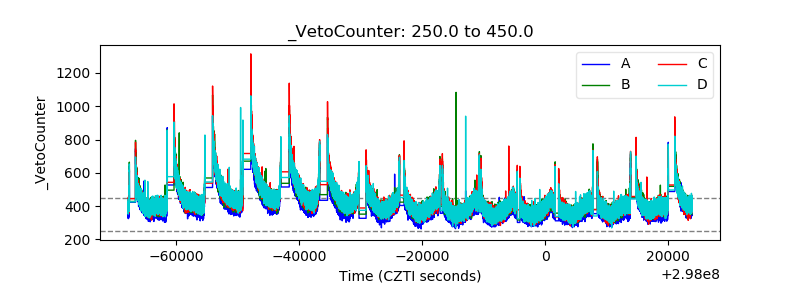 |