| Param | Original file | Final file |
|---|---|---|
| Filename | modeM0/AS1C04_001T01_9000002984_20013cztM0_level2.evt | modeM0/AS1C04_001T01_9000002984_20013cztM0_level2_quad_clean.evt |
| Size (bytes) | 126,253,440 | 11,874,240 |
| Size | 120.4 MB | 11.3 MB |
| Events in quadrant A | 936,268 | 60,167 |
| Events in quadrant B | 841,759 | 61,575 |
| Events in quadrant C | 824,199 | 59,682 |
| Events in quadrant D | 1,109,367 | 58,780 |
| Mode SS | |||
|---|---|---|---|
| Quadrant | BADHDUFLAG | Total packets | Discarded packets |
| A | 0 | 34 | 0 |
| B | 0 | 34 | 0 |
| C | 0 | 34 | 0 |
| D | 0 | 34 | 0 |
| Mode M9 | |||
|---|---|---|---|
| Quadrant | BADHDUFLAG | Total packets | Discarded packets |
| A | 0 | 10 | 0 |
| B | 0 | 10 | 0 |
| C | 0 | 10 | 0 |
| D | 0 | 10 | 0 |
| Mode M0 | |||
|---|---|---|---|
| Quadrant | BADHDUFLAG | Total packets | Discarded packets |
| A | 0 | 3731 | 1 |
| B | 0 | 3411 | 1 |
| C | 0 | 3380 | 1 |
| D | 0 | 4324 | 1 |
| Quadrant | Total seconds | Saturated seconds | Saturation percentage |
|---|---|---|---|
| A | 1610 | 60 | 3.726708% |
| B | 1610 | 38 | 2.360248% |
| C | 1610 | 32 | 1.987578% |
| D | 1610 | 95 | 5.900621% |
Noise dominated data is calculated using 1-second bins in cleaned event files. If a bin has >2000 counts, and if more than 50% of those come from <1% of pixels, then it is considered to be noise-dominated and hence unusable.
| Quadrant | # 1 sec bins | Bins with >0 counts | Bins with >2000 counts | High rate bins dominated by noise | Noise dominated (total time) | Noise dominated (detector-on time) | Marked lightcurve |
|---|---|---|---|---|---|---|---|
| A | 2610 | 1611 | 14 | 14 | 0.54% | 0.87% |  |
| B | 2610 | 1611 | 0 | 0 | 0.00% | 0.00% | 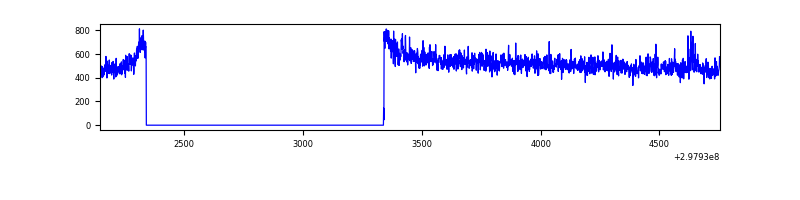 |
| C | 2610 | 1611 | 0 | 0 | 0.00% | 0.00% | 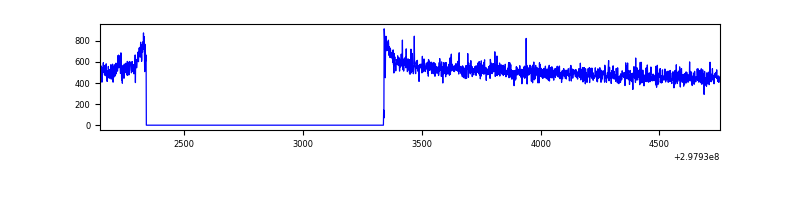 |
| D | 2610 | 1611 | 64 | 64 | 2.45% | 3.97% | 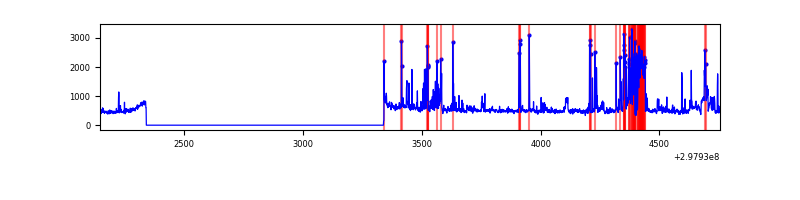 |
Top three noisy pixels from each quadrant. If the there are fewer than three noisy pixels in the level2.evt file, extra rows are filled as -1
| Pixel properties | Quadrant properties | ||||||
|---|---|---|---|---|---|---|---|
| Quadrant | DetID | PixID | Counts | Sigma | Mean | Median | Sigma |
| A | 14 | 238 | 115651 | 2594.68 | 213 | 209 | 44.5 |
| A | 13 | 254 | 1841 | 36.68 | 213 | 209 | 44.5 |
| A | 0 | 226 | 1805 | 35.87 | 213 | 209 | 44.5 |
| B | 12 | 111 | 4954 | 111.92 | 212 | 206 | 42.4 |
| B | 11 | 111 | 4428 | 99.52 | 212 | 206 | 42.4 |
| B | 14 | 111 | 4041 | 90.4 | 212 | 206 | 42.4 |
| C | 14 | 238 | 31853 | 652.73 | 200 | 201 | 48.5 |
| C | 3 | 233 | 4083 | 80.05 | 200 | 201 | 48.5 |
| C | 0 | 207 | 3306 | 64.03 | 200 | 201 | 48.5 |
| D | 12 | 218 | 234884 | 4735.46 | 200 | 193 | 49.6 |
| D | 1 | 52 | 78592 | 1581.89 | 200 | 193 | 49.6 |
| D | 7 | 96 | 15125 | 301.29 | 200 | 193 | 49.6 |
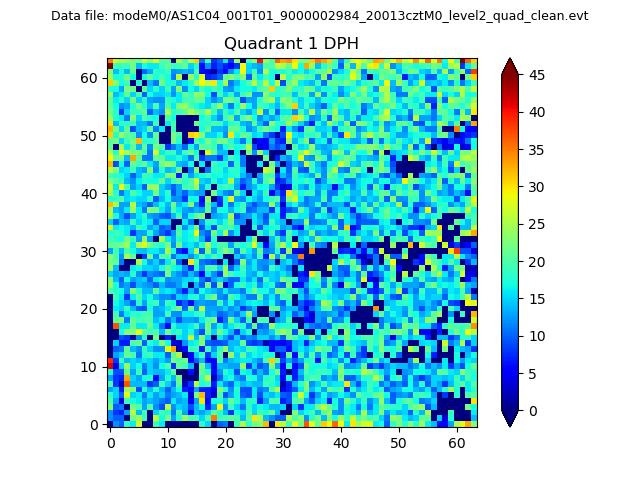
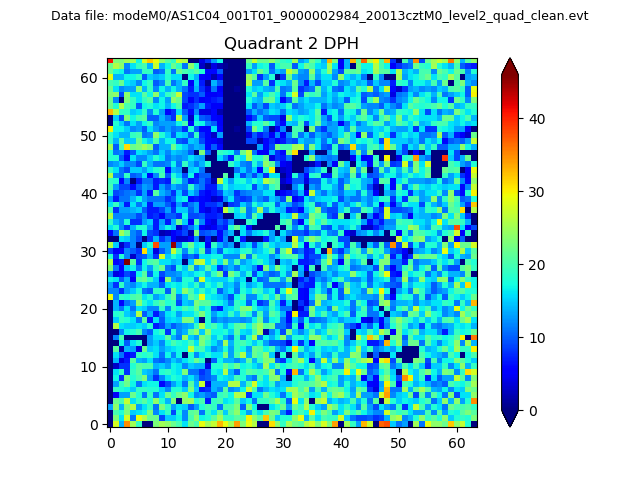
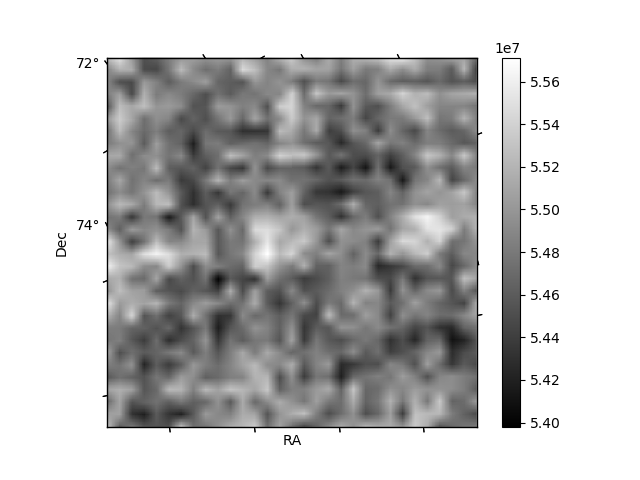
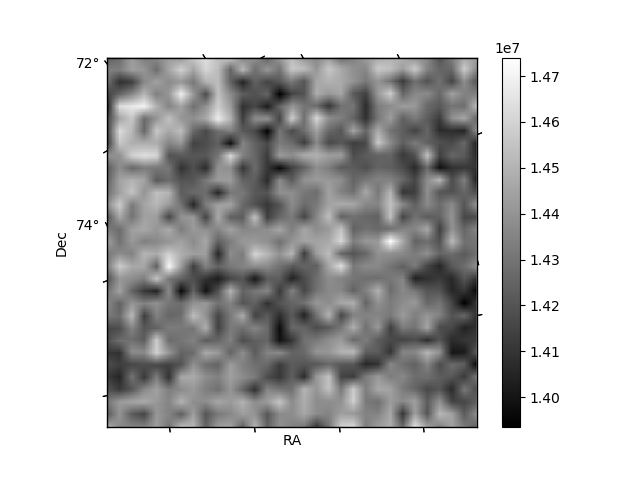
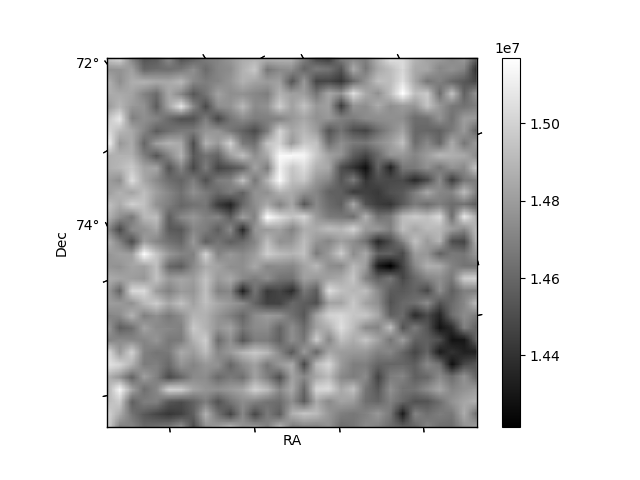
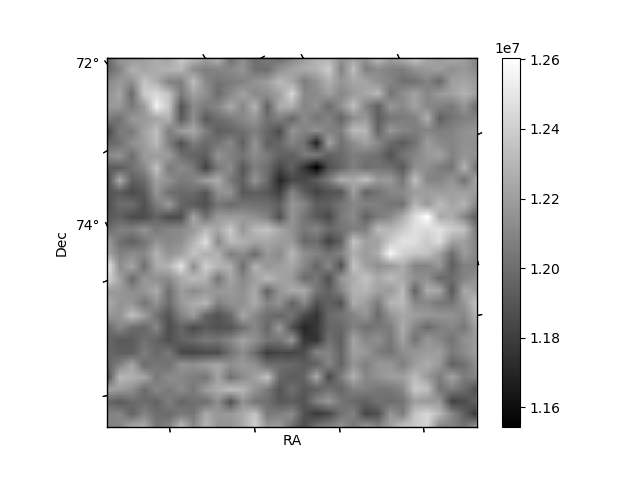
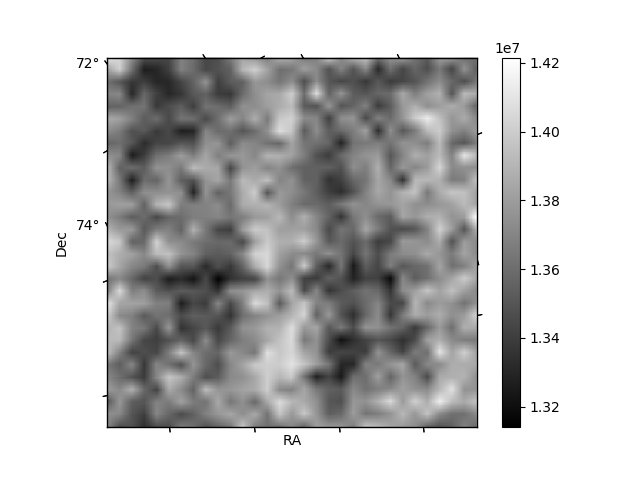
Histogram calculated using DETX and DETY for each event in the final _common_clean file
| Quadrant A | 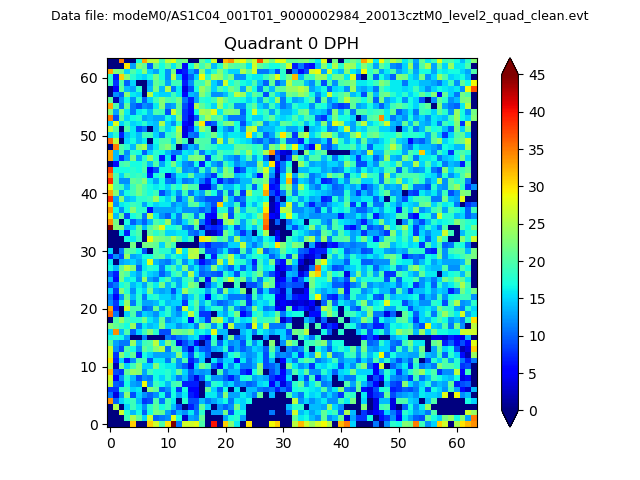 |
 |
Quadrant B |
|---|---|---|---|
| Quadrant D | 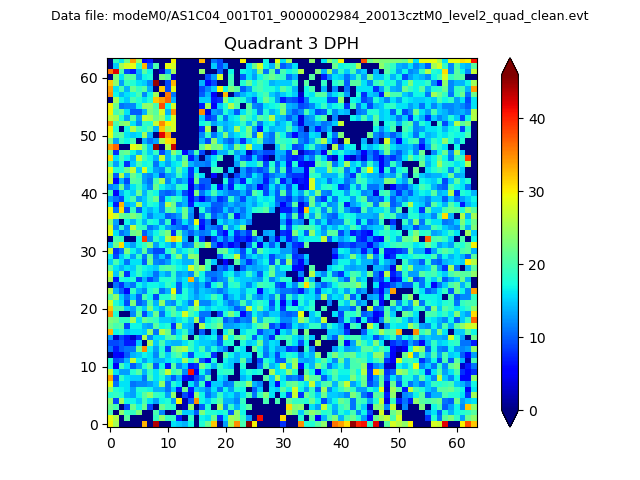 |
 |
Quadrant C |
| Plot type | Count rate plots | Images |
|---|---|---|
| Comparison with Poisson distribution Blue bars denote a histogram of data divided into 1 sec bins. Red curve is a Poisson curve with rate = median count rate of data. |
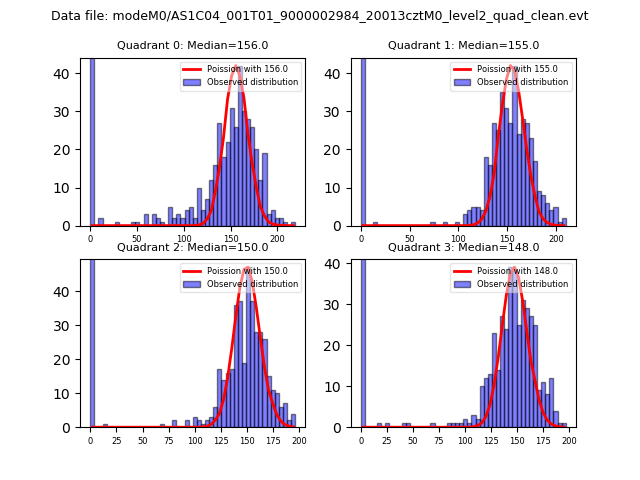 |
 |
| Quadrant-wise count rates Data is divided into 100 sec bins |
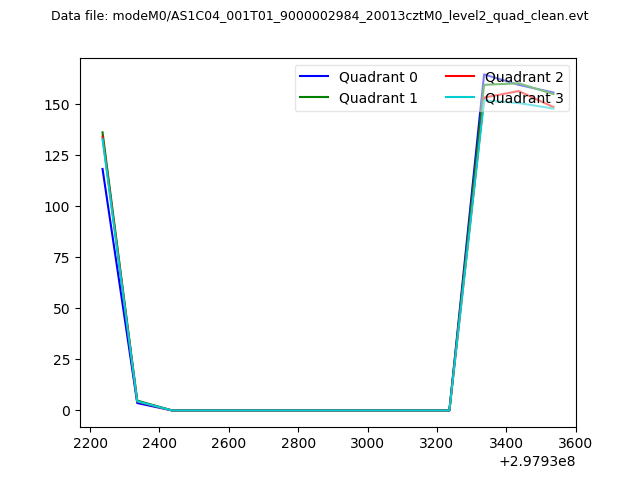 |
|
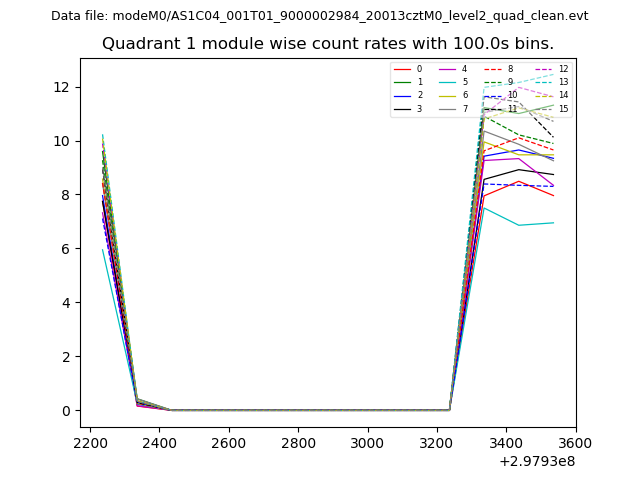
| Module-wise count rates for Quadrant A Data is divided into 100 sec bins |
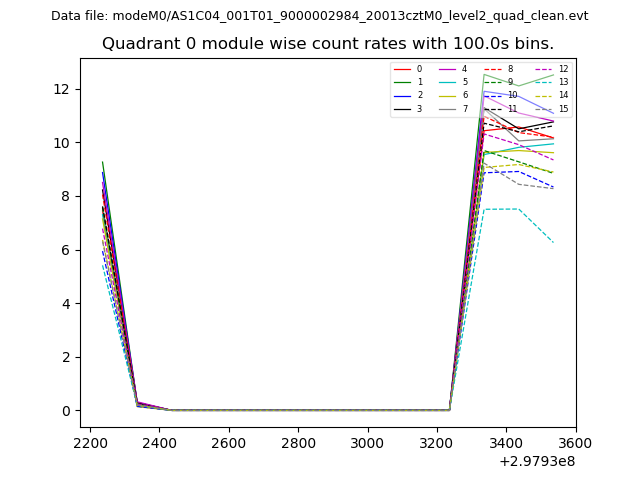 |
 |
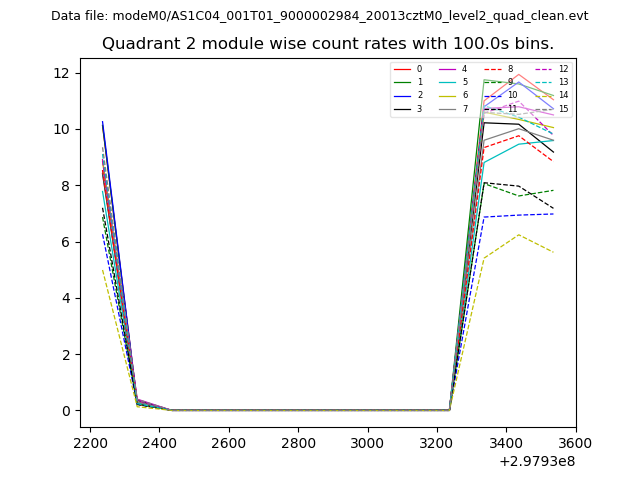
| Module-wise count rates for Quadrant B Data is divided into 100 sec bins |
 |
 |
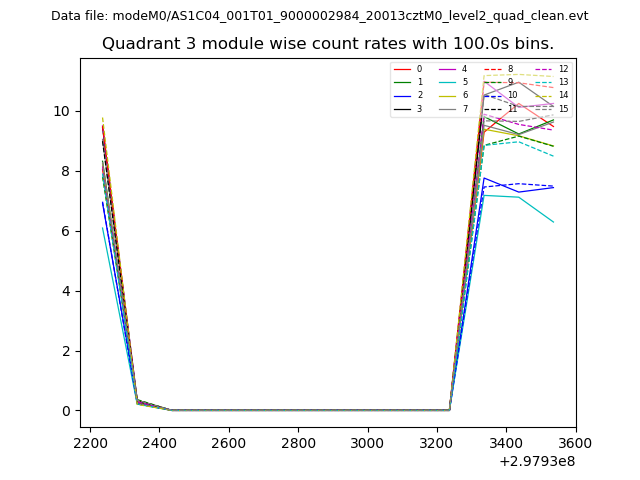
| Module-wise count rates for Quadrant C Data is divided into 100 sec bins |
 |
 |
| Module-wise count rates for Quadrant D Data is divided into 100 sec bins |
 |
 |
| Parameter | Plot |
|---|---|
| CZT HV Monitor | 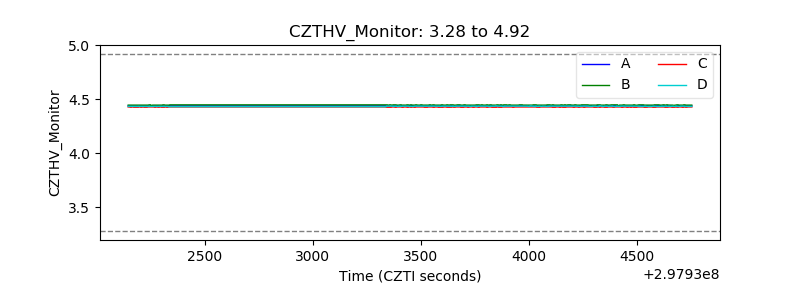 |
| D_VDD | 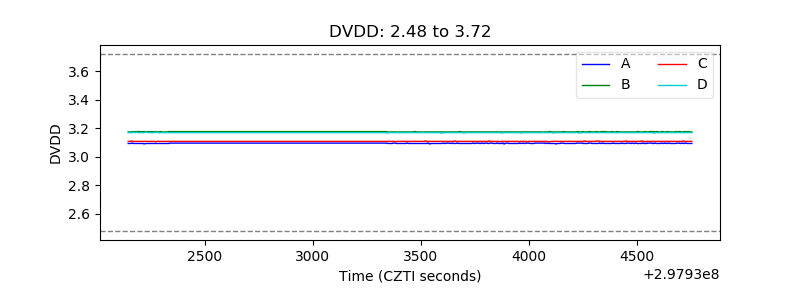 |
| Temperature 1 | 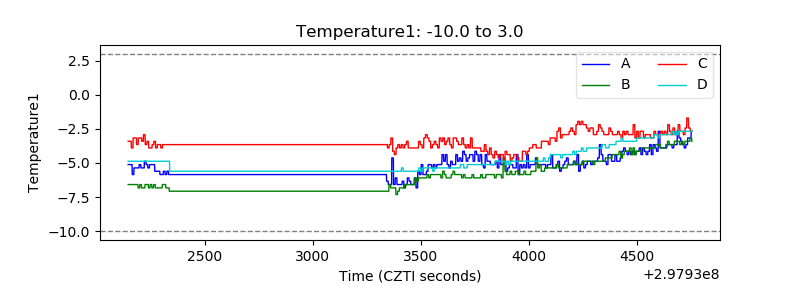 |
| Veto HV Monitor | 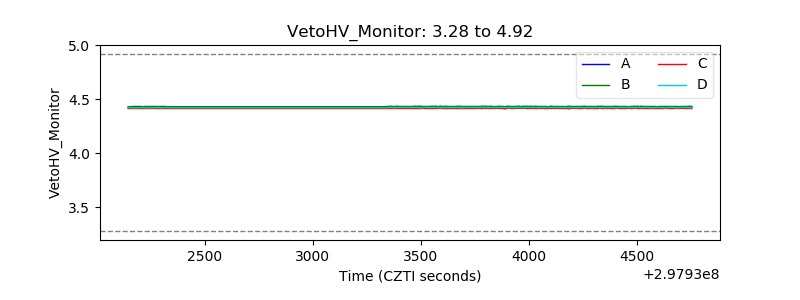 |
| Veto LLD |  |
| Alpha Counter | 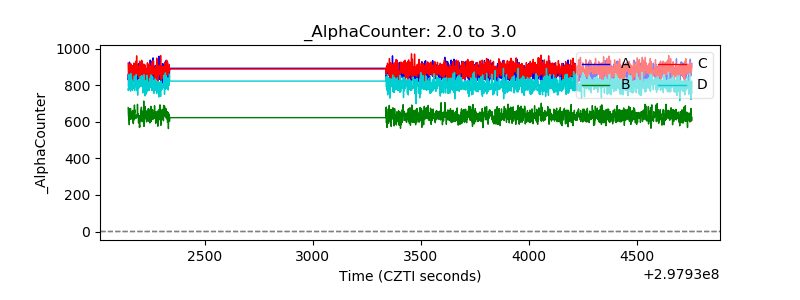 |
| _CPM_Rate | 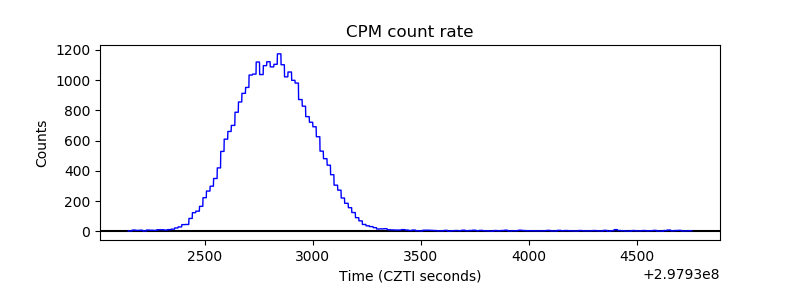 |
| CZT Counter | 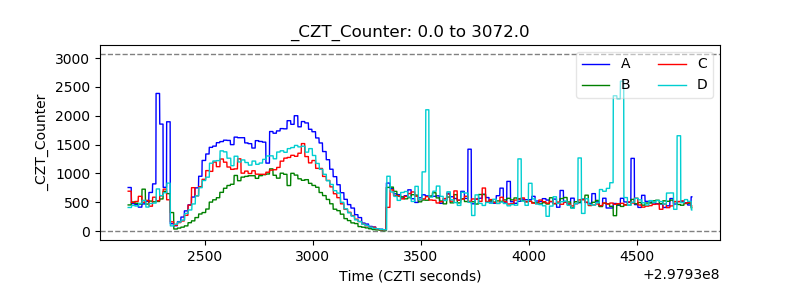 |
| +2.5 Volts monitor |  |
| +5 Volts monitor |  |
| _ROLL_ROT | 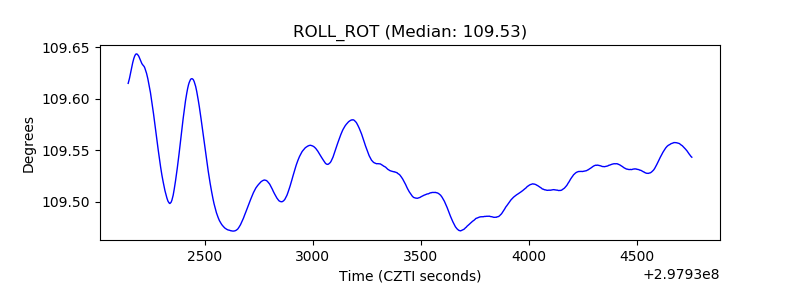 |
| _Roll_DEC | 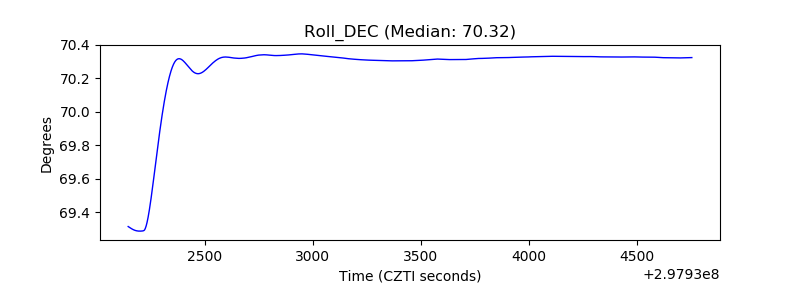 |
| _Roll_RA | 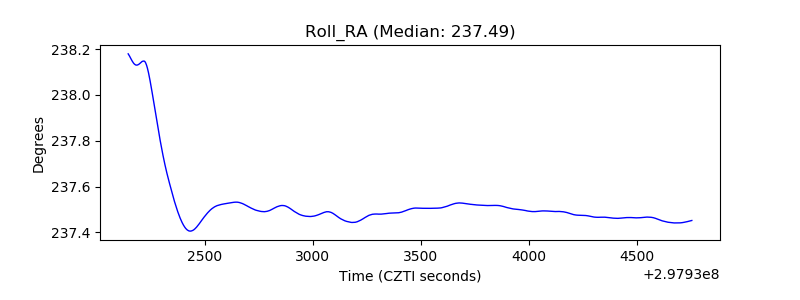 |
| Veto Counter | 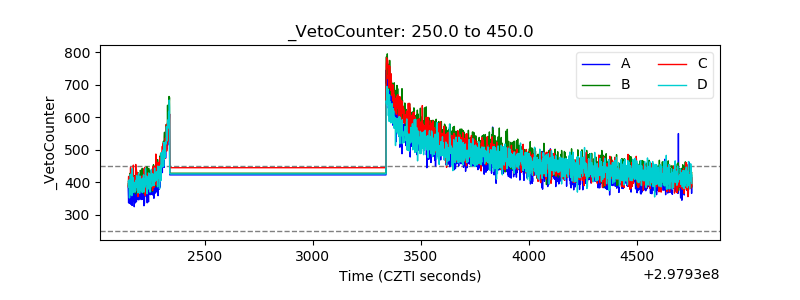 |