| Param | Original file | Final file |
|---|---|---|
| Filename | modeM0/AS1C04_001T01_9000002984_20015cztM0_level2.evt | modeM0/AS1C04_001T01_9000002984_20015cztM0_level2_quad_clean.evt |
| Size (bytes) | 491,005,440 | 86,143,680 |
| Size | 468.3 MB | 82.2 MB |
| Events in quadrant A | 3,778,430 | 547,811 |
| Events in quadrant B | 3,393,600 | 551,101 |
| Events in quadrant C | 3,175,290 | 533,844 |
| Events in quadrant D | 4,083,188 | 524,079 |
| Mode SS | |||
|---|---|---|---|
| Quadrant | BADHDUFLAG | Total packets | Discarded packets |
| A | 0 | 132 | 0 |
| B | 0 | 132 | 0 |
| C | 0 | 132 | 0 |
| D | 0 | 132 | 0 |
| Mode M9 | |||
|---|---|---|---|
| Quadrant | BADHDUFLAG | Total packets | Discarded packets |
| A | 0 | 15 | 0 |
| B | 0 | 16 | 0 |
| C | 0 | 16 | 0 |
| D | 0 | 16 | 0 |
| Mode M0 | |||
|---|---|---|---|
| Quadrant | BADHDUFLAG | Total packets | Discarded packets |
| A | 0 | 15332 | 3 |
| B | 0 | 14103 | 2 |
| C | 0 | 13464 | 2 |
| D | 0 | 16289 | 2 |
| Quadrant | Total seconds | Saturated seconds | Saturation percentage |
|---|---|---|---|
| A | 6474 | 210 | 3.243744% |
| B | 6474 | 106 | 1.637319% |
| C | 6474 | 102 | 1.575533% |
| D | 6474 | 258 | 3.985171% |
Noise dominated data is calculated using 1-second bins in cleaned event files. If a bin has >2000 counts, and if more than 50% of those come from <1% of pixels, then it is considered to be noise-dominated and hence unusable.
| Quadrant | # 1 sec bins | Bins with >0 counts | Bins with >2000 counts | High rate bins dominated by noise | Noise dominated (total time) | Noise dominated (detector-on time) | Marked lightcurve |
|---|---|---|---|---|---|---|---|
| A | 7579 | 6475 | 122 | 122 | 1.61% | 1.88% | 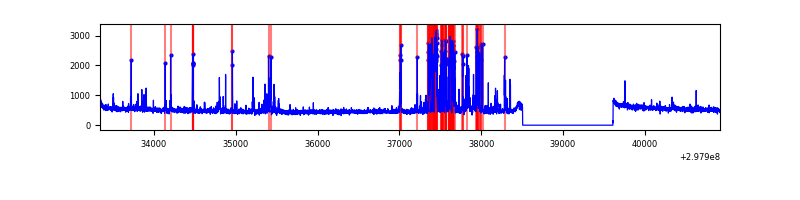 |
| B | 7579 | 6475 | 15 | 15 | 0.20% | 0.23% | 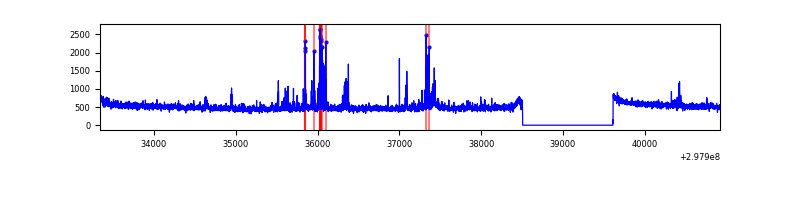 |
| C | 7579 | 6475 | 0 | 0 | 0.00% | 0.00% |  |
| D | 7579 | 6475 | 150 | 150 | 1.98% | 2.32% | 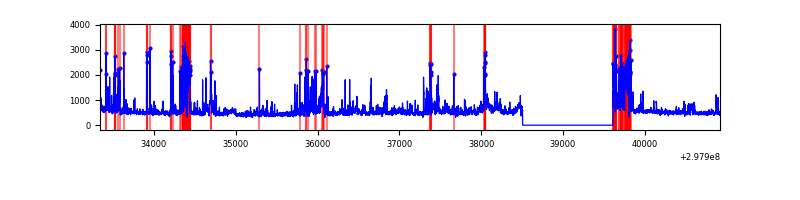 |
Top three noisy pixels from each quadrant. If the there are fewer than three noisy pixels in the level2.evt file, extra rows are filled as -1
| Pixel properties | Quadrant properties | ||||||
|---|---|---|---|---|---|---|---|
| Quadrant | DetID | PixID | Counts | Sigma | Mean | Median | Sigma |
| A | 14 | 238 | 615146 | 3778.79 | 814 | 798 | 162.6 |
| A | 4 | 2 | 20591 | 121.74 | 814 | 798 | 162.6 |
| A | 5 | 16 | 8682 | 48.49 | 814 | 798 | 162.6 |
| B | 4 | 216 | 99780 | 651.25 | 808 | 787 | 152.0 |
| B | 0 | 197 | 49020 | 317.31 | 808 | 787 | 152.0 |
| B | 7 | 220 | 21931 | 139.1 | 808 | 787 | 152.0 |
| C | 14 | 238 | 123176 | 679.29 | 774 | 779 | 180.2 |
| C | 3 | 233 | 21244 | 113.58 | 774 | 779 | 180.2 |
| C | 0 | 207 | 9539 | 48.61 | 774 | 779 | 180.2 |
| D | 12 | 218 | 450998 | 2415.44 | 776 | 753 | 186.4 |
| D | 1 | 52 | 405016 | 2168.76 | 776 | 753 | 186.4 |
| D | 12 | 227 | 90934 | 483.8 | 776 | 753 | 186.4 |
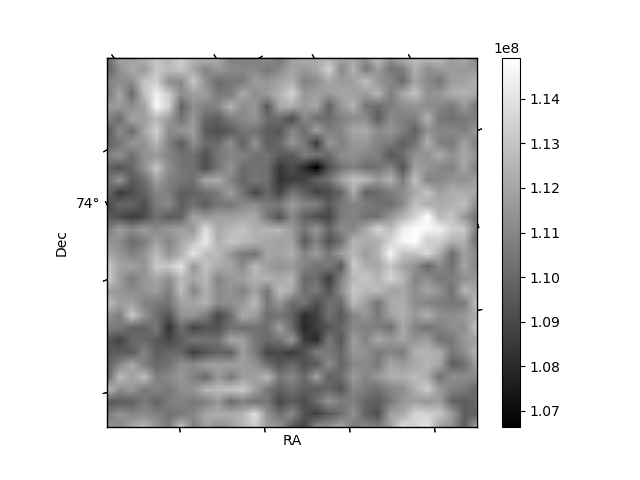
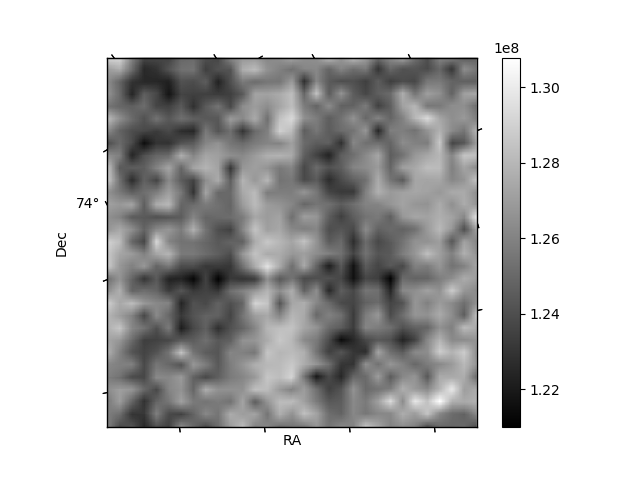
Histogram calculated using DETX and DETY for each event in the final _common_clean file
| Quadrant A | 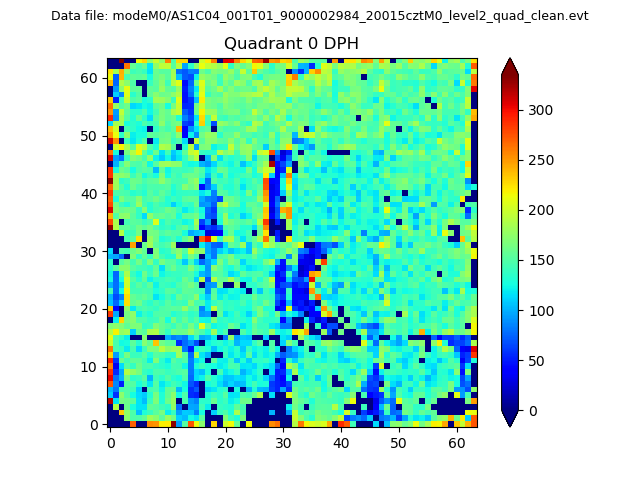 |
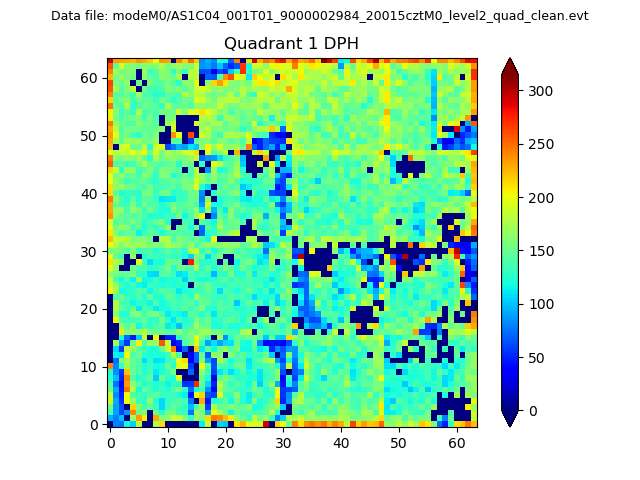 |
Quadrant B |
|---|---|---|---|
| Quadrant D |  |
 |
Quadrant C |
| Plot type | Count rate plots | Images |
|---|---|---|
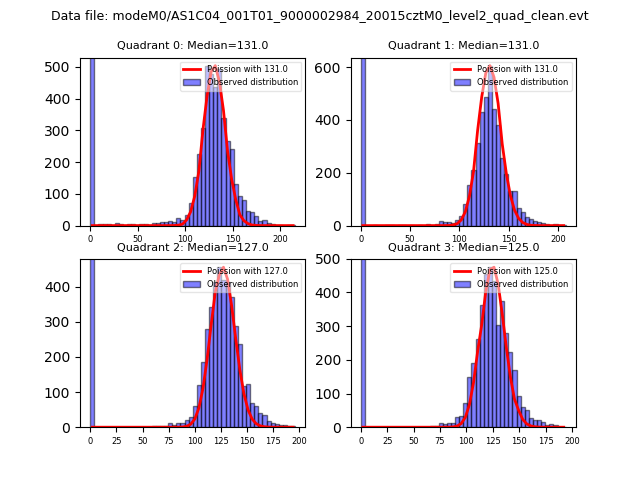
| Comparison with Poisson distribution Blue bars denote a histogram of data divided into 1 sec bins. Red curve is a Poisson curve with rate = median count rate of data. |
 |
 |
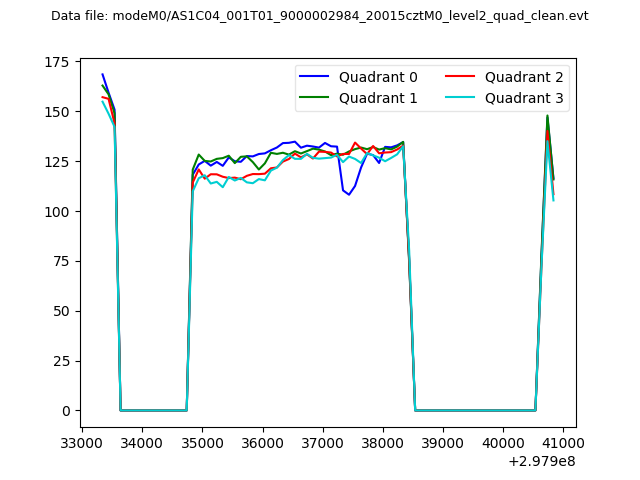
| Quadrant-wise count rates Data is divided into 100 sec bins |
 |
|
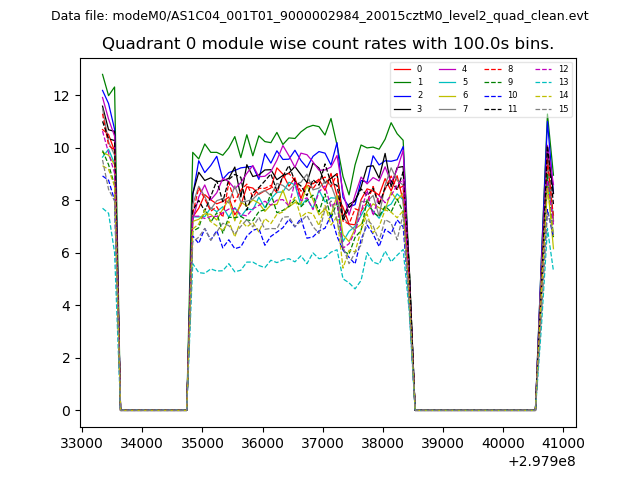
| Module-wise count rates for Quadrant A Data is divided into 100 sec bins |
 |
 |
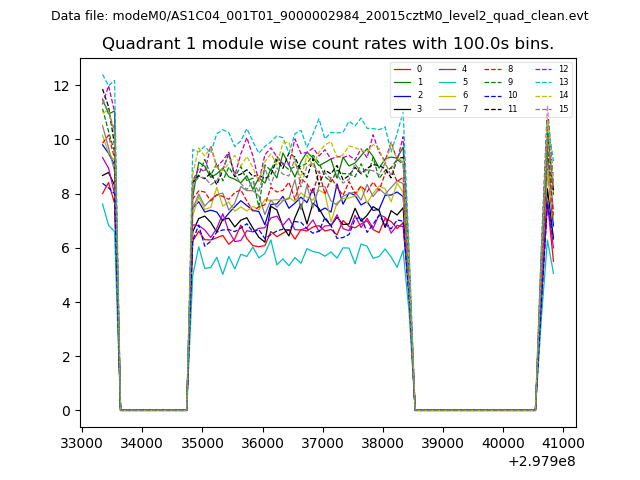
| Module-wise count rates for Quadrant B Data is divided into 100 sec bins |
 |
 |
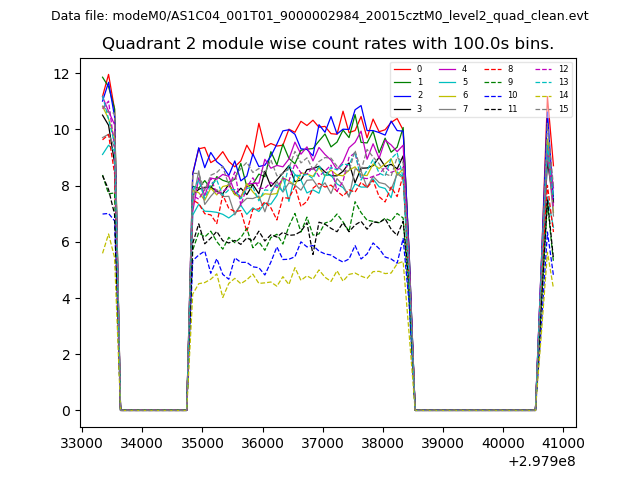
| Module-wise count rates for Quadrant C Data is divided into 100 sec bins |
 |
 |
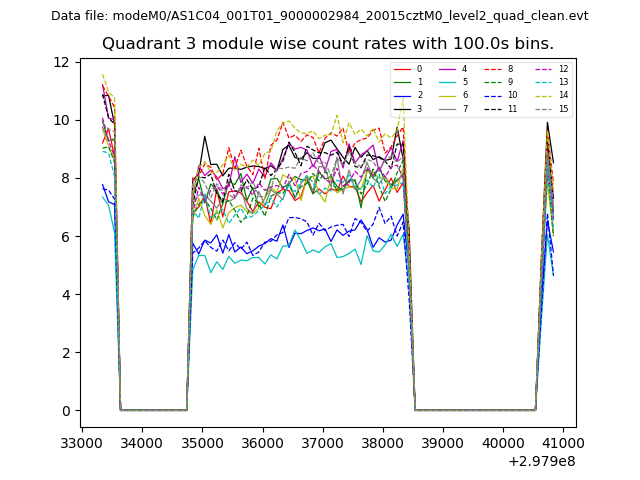
| Module-wise count rates for Quadrant D Data is divided into 100 sec bins |
 |
 |
| Parameter | Plot |
|---|---|
| CZT HV Monitor | 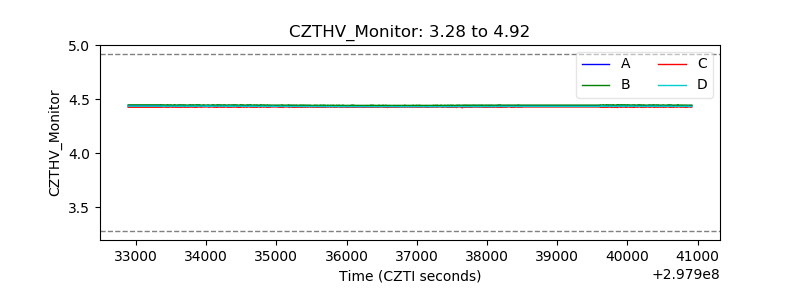 |
| D_VDD | 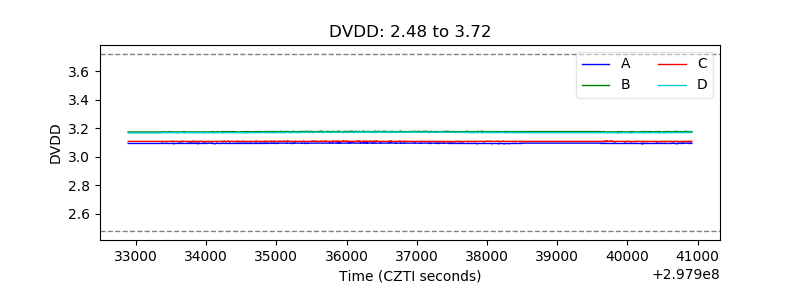 |
| Temperature 1 | 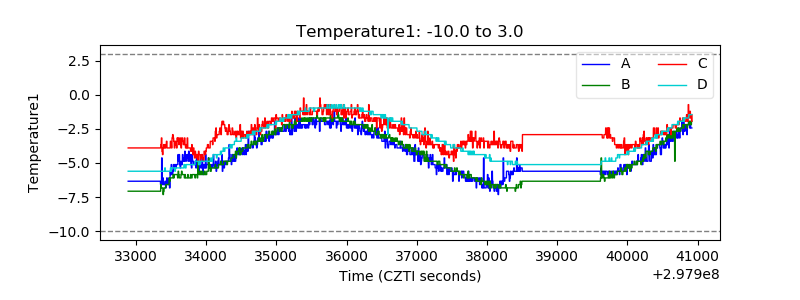 |
| Veto HV Monitor | 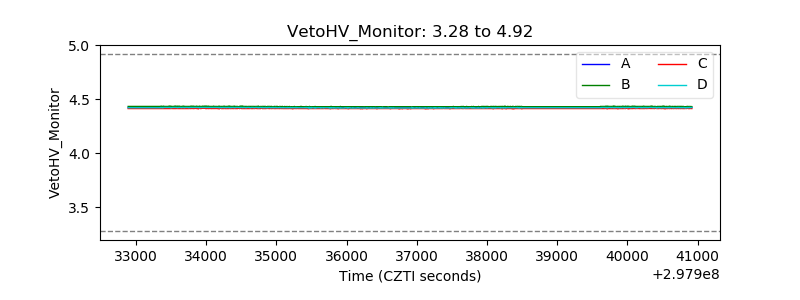 |
| Veto LLD | 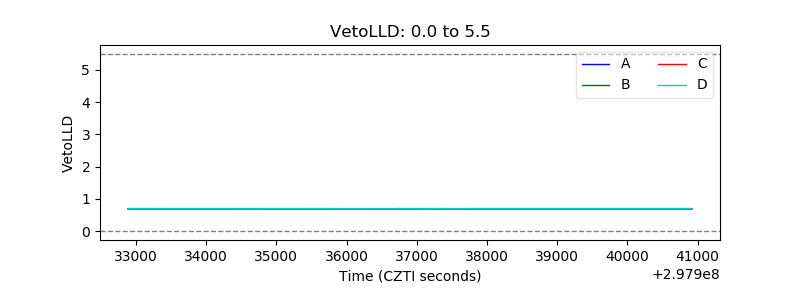 |
| Alpha Counter | 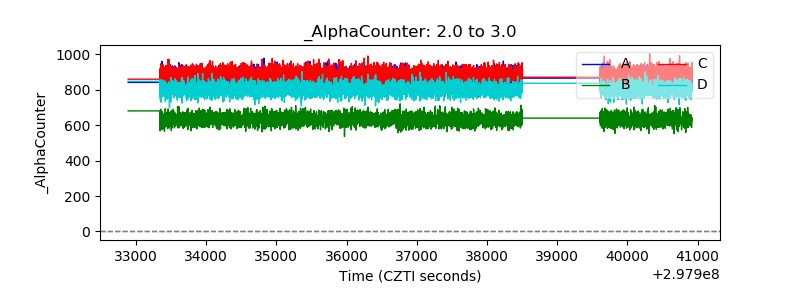 |
| _CPM_Rate | 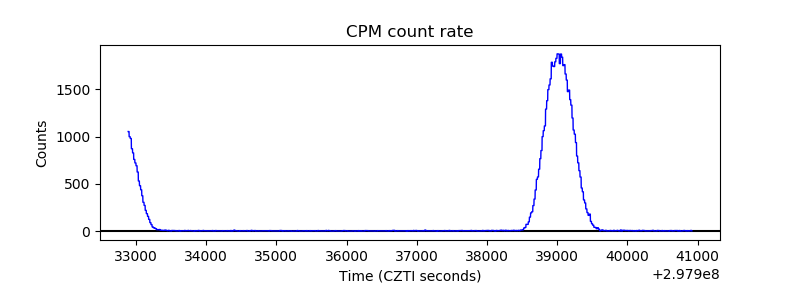 |
| CZT Counter |  |
| +2.5 Volts monitor |  |
| +5 Volts monitor |  |
| _ROLL_ROT | 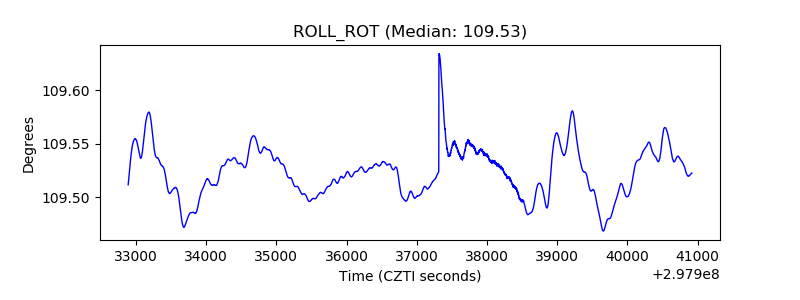 |
| _Roll_DEC | 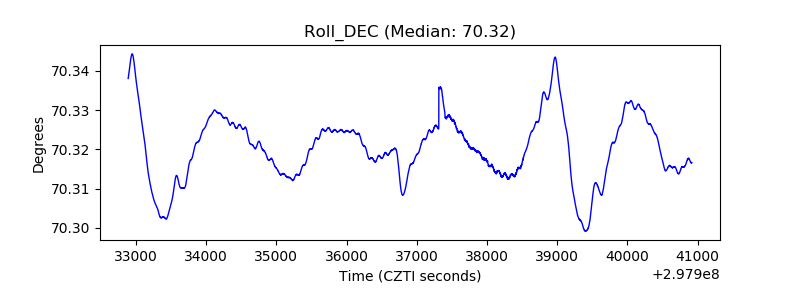 |
| _Roll_RA | 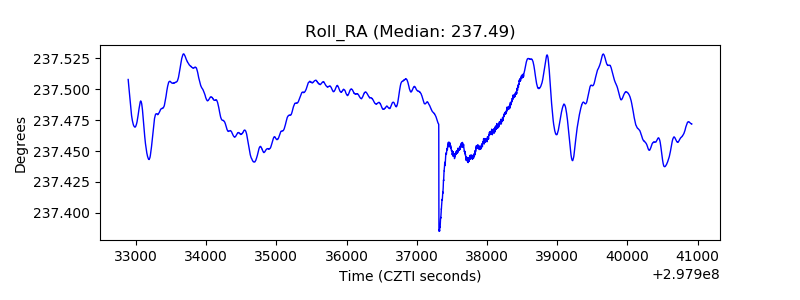 |
| Veto Counter | 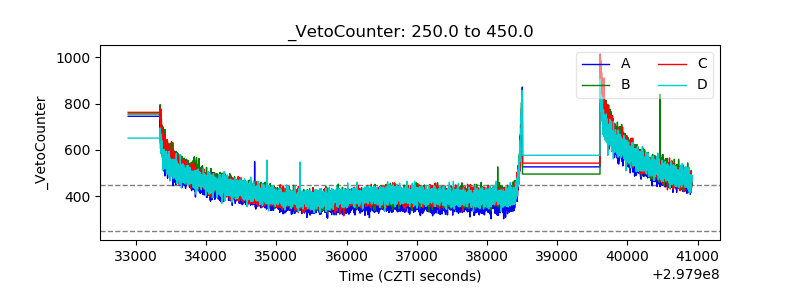 |