| Param | Original file | Final file |
|---|---|---|
| Filename | modeM0/AS1C04_001T01_9000002984_20017cztM0_level2.evt | modeM0/AS1C04_001T01_9000002984_20017cztM0_level2_quad_clean.evt |
| Size (bytes) | 614,286,720 | 119,704,320 |
| Size | 585.8 MB | 114.2 MB |
| Events in quadrant A | 3,579,745 | 844,123 |
| Events in quadrant B | 3,707,530 | 844,084 |
| Events in quadrant C | 3,412,027 | 812,005 |
| Events in quadrant D | 7,478,124 | 685,657 |
| Mode SS | |||
|---|---|---|---|
| Quadrant | BADHDUFLAG | Total packets | Discarded packets |
| A | 0 | 128 | 0 |
| B | 0 | 128 | 0 |
| C | 0 | 128 | 0 |
| D | 0 | 128 | 0 |
| Mode M9 | |||
|---|---|---|---|
| Quadrant | BADHDUFLAG | Total packets | Discarded packets |
| A | 0 | 14 | 0 |
| B | 0 | 14 | 0 |
| C | 0 | 14 | 0 |
| D | 0 | 14 | 0 |
| Mode M0 | |||
|---|---|---|---|
| Quadrant | BADHDUFLAG | Total packets | Discarded packets |
| A | 0 | 14678 | 1 |
| B | 0 | 15120 | 1 |
| C | 0 | 14043 | 1 |
| D | 0 | 26487 | 1 |
| Quadrant | Total seconds | Saturated seconds | Saturation percentage |
|---|---|---|---|
| A | 6295 | 197 | 3.129468% |
| B | 6295 | 135 | 2.144559% |
| C | 6295 | 131 | 2.081017% |
| D | 6295 | 1861 | 29.563145% |
Noise dominated data is calculated using 1-second bins in cleaned event files. If a bin has >2000 counts, and if more than 50% of those come from <1% of pixels, then it is considered to be noise-dominated and hence unusable.
| Quadrant | # 1 sec bins | Bins with >0 counts | Bins with >2000 counts | High rate bins dominated by noise | Noise dominated (total time) | Noise dominated (detector-on time) | Marked lightcurve |
|---|---|---|---|---|---|---|---|
| A | 7590 | 6297 | 105 | 105 | 1.38% | 1.67% | 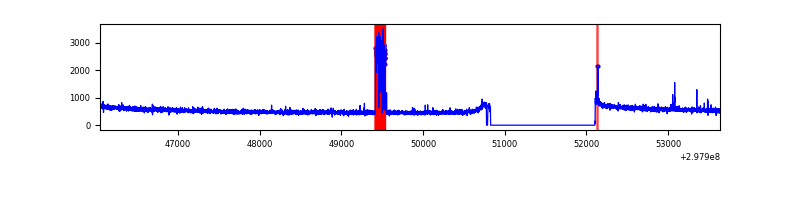 |
| B | 7590 | 6297 | 28 | 28 | 0.37% | 0.44% | 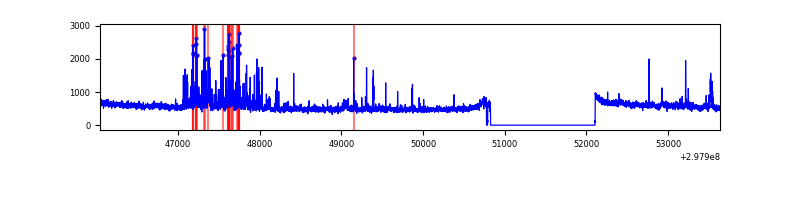 |
| C | 7590 | 6297 | 10 | 10 | 0.13% | 0.16% |  |
| D | 7590 | 6297 | 1703 | 1703 | 22.44% | 27.04% | 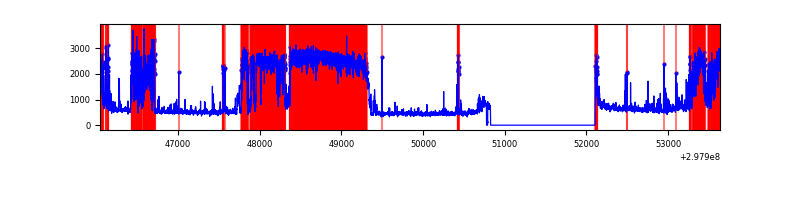 |
Top three noisy pixels from each quadrant. If the there are fewer than three noisy pixels in the level2.evt file, extra rows are filled as -1
| Pixel properties | Quadrant properties | ||||||
|---|---|---|---|---|---|---|---|
| Quadrant | DetID | PixID | Counts | Sigma | Mean | Median | Sigma |
| A | 5 | 16 | 290487 | 1705.87 | 853 | 837 | 169.8 |
| A | 0 | 226 | 7795 | 40.98 | 853 | 837 | 169.8 |
| A | 13 | 254 | 6735 | 34.74 | 853 | 837 | 169.8 |
| B | 7 | 220 | 244157 | 1571.89 | 841 | 824 | 154.8 |
| B | 0 | 190 | 42147 | 266.94 | 841 | 824 | 154.8 |
| B | 0 | 197 | 31758 | 199.83 | 841 | 824 | 154.8 |
| C | 14 | 238 | 131667 | 705.34 | 814 | 821 | 185.5 |
| C | 3 | 233 | 65295 | 347.56 | 814 | 821 | 185.5 |
| C | 0 | 207 | 41586 | 219.75 | 814 | 821 | 185.5 |
| D | 7 | 38 | 3153739 | 17608.67 | 741 | 718 | 179.1 |
| D | 9 | 1 | 483609 | 2696.8 | 741 | 718 | 179.1 |
| D | 12 | 218 | 470692 | 2624.66 | 741 | 718 | 179.1 |
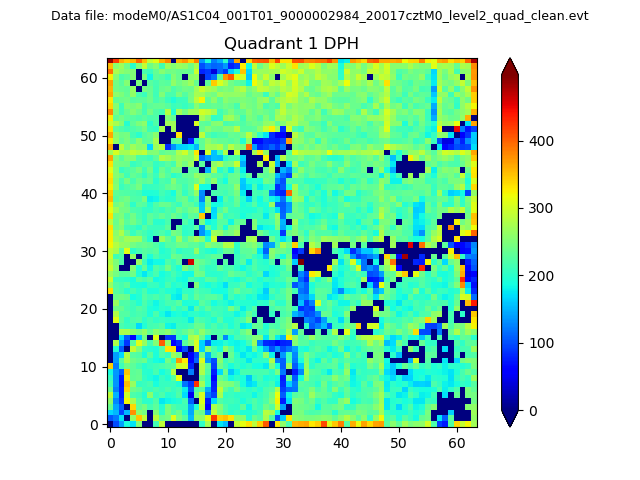
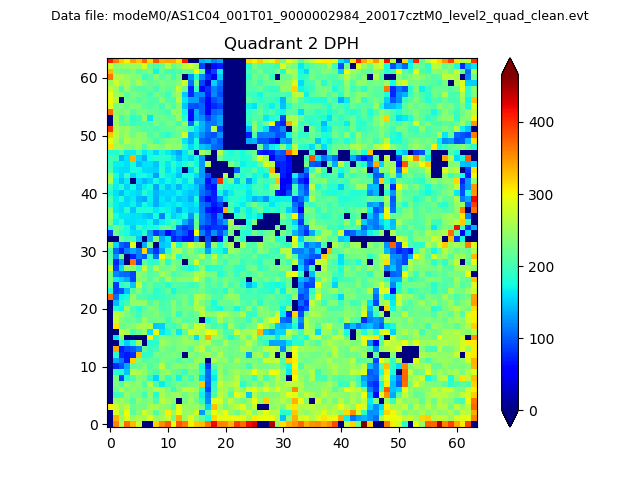
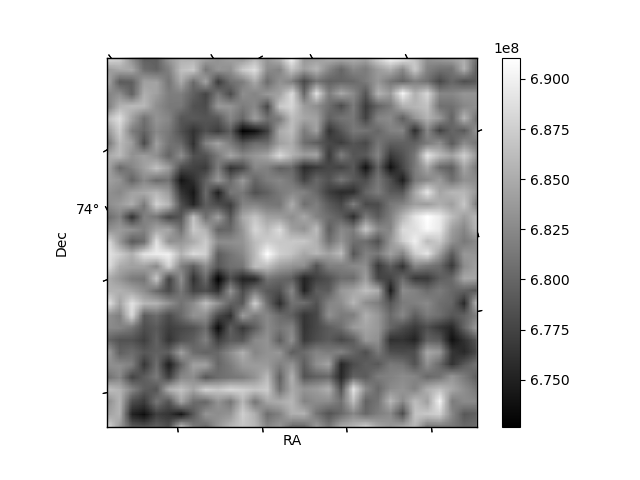
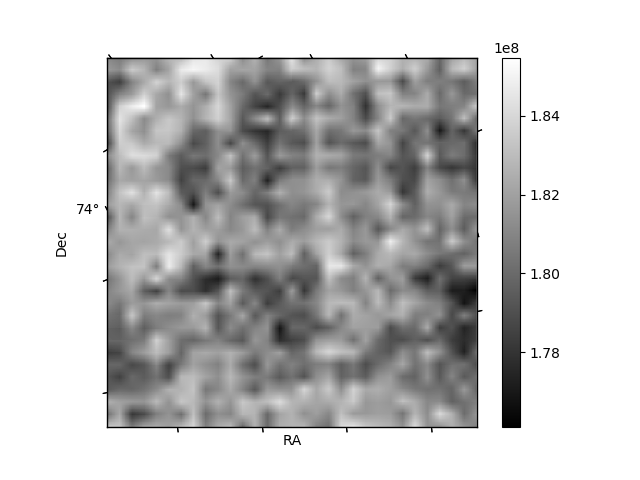
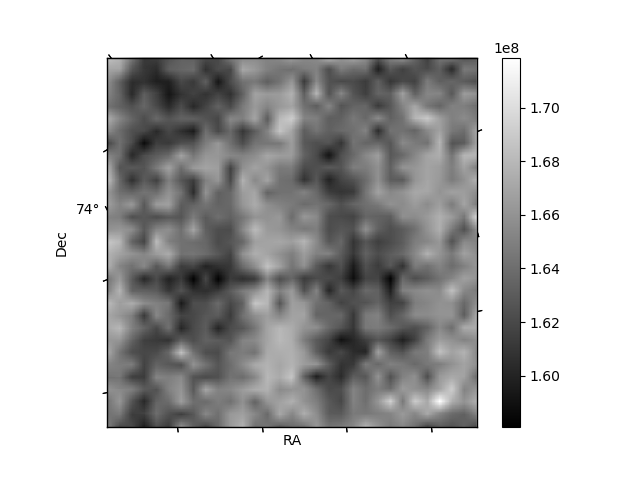
Histogram calculated using DETX and DETY for each event in the final _common_clean file
| Quadrant A | 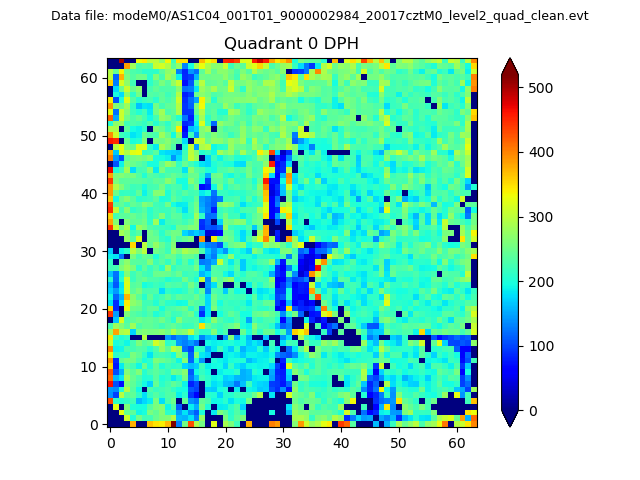 |
 |
Quadrant B |
|---|---|---|---|
| Quadrant D | 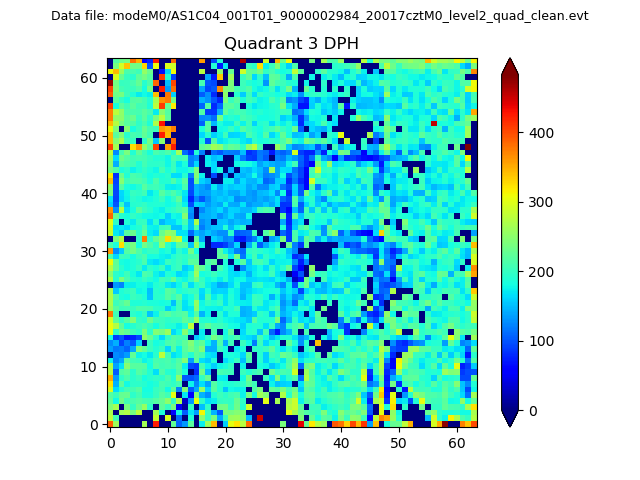 |
 |
Quadrant C |
| Plot type | Count rate plots | Images |
|---|---|---|
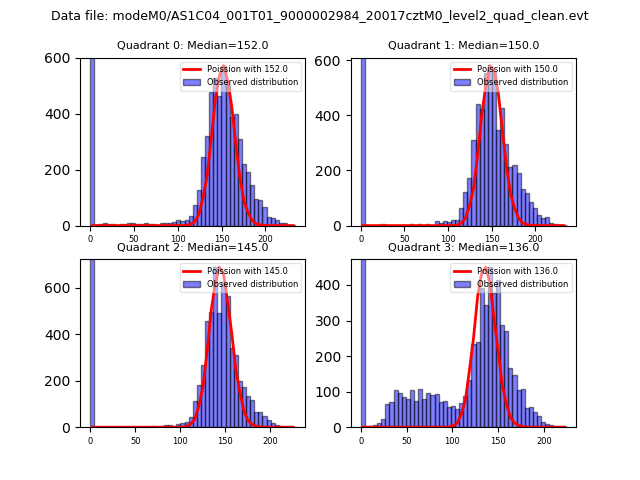
| Comparison with Poisson distribution Blue bars denote a histogram of data divided into 1 sec bins. Red curve is a Poisson curve with rate = median count rate of data. |
 |
 |
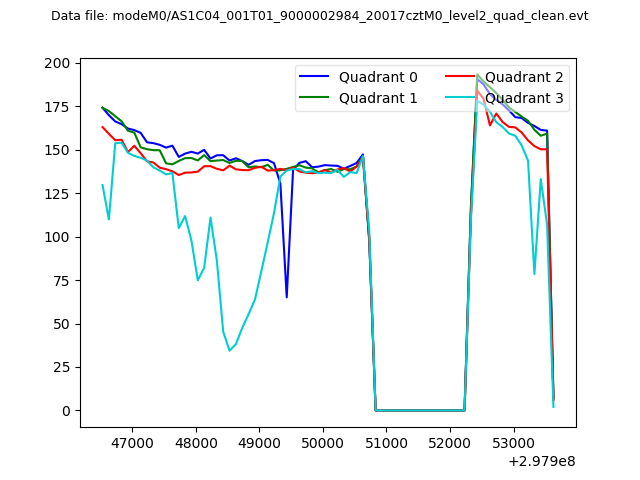
| Quadrant-wise count rates Data is divided into 100 sec bins |
 |
|
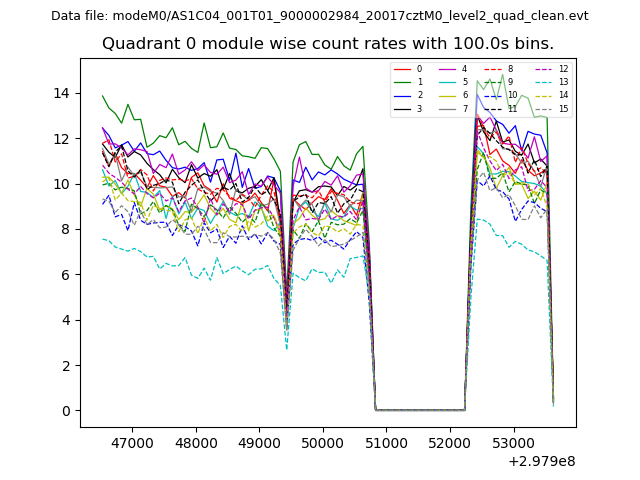
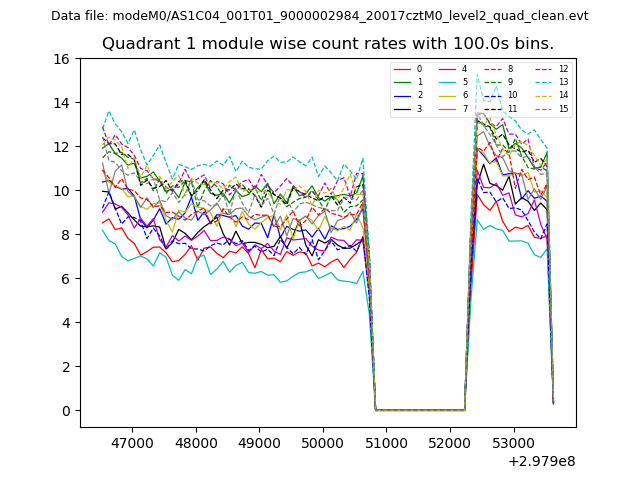
| Module-wise count rates for Quadrant A Data is divided into 100 sec bins |
 |
 |
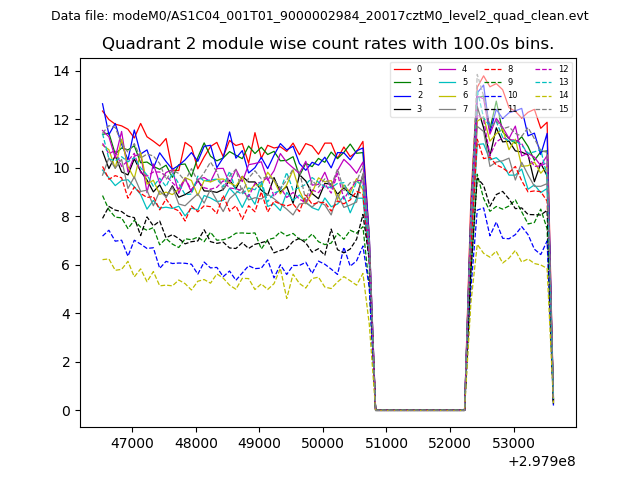
| Module-wise count rates for Quadrant B Data is divided into 100 sec bins |
 |
 |
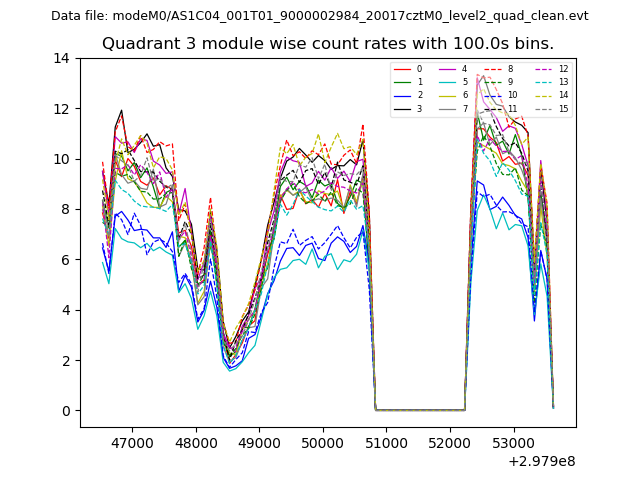
| Module-wise count rates for Quadrant C Data is divided into 100 sec bins |
 |
 |
| Module-wise count rates for Quadrant D Data is divided into 100 sec bins |
 |
 |
| Parameter | Plot |
|---|---|
| CZT HV Monitor | 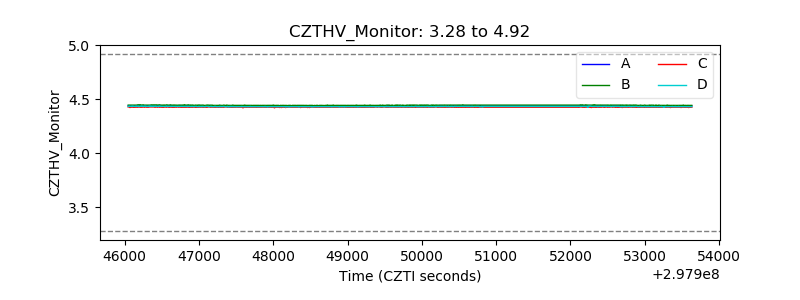 |
| D_VDD | 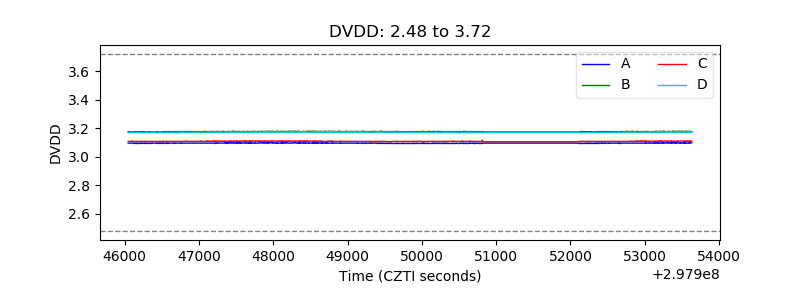 |
| Temperature 1 | 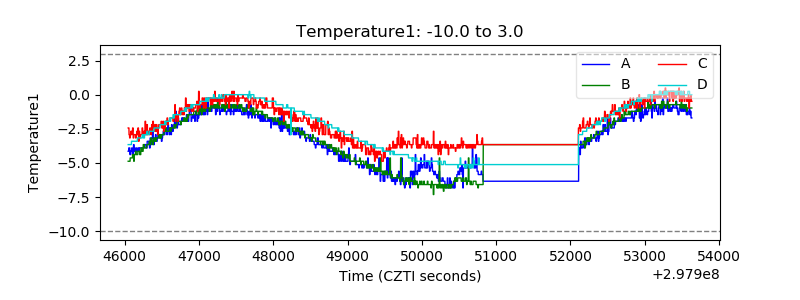 |
| Veto HV Monitor | 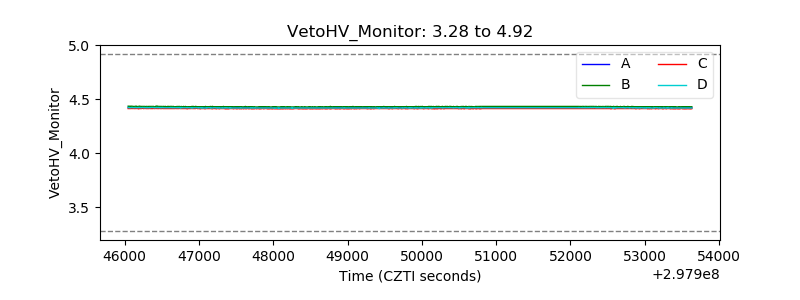 |
| Veto LLD | 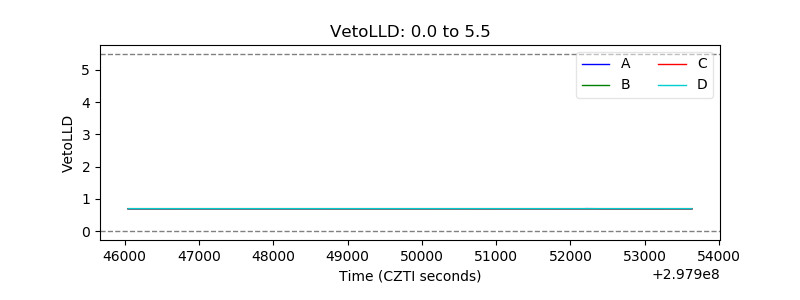 |
| Alpha Counter | 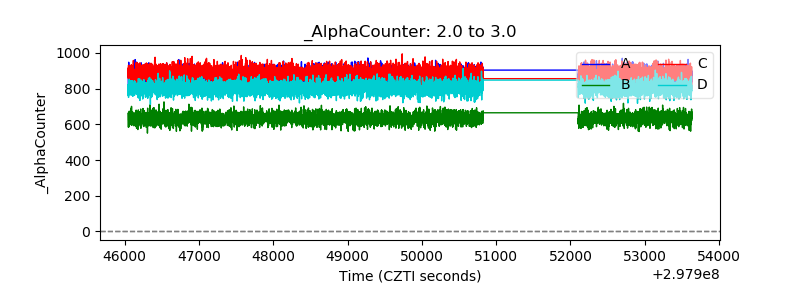 |
| _CPM_Rate | 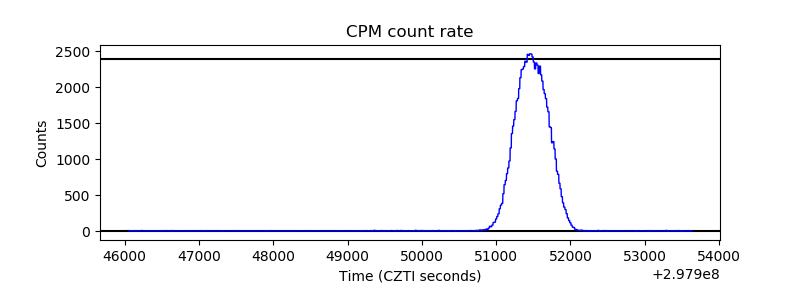 |
| CZT Counter | 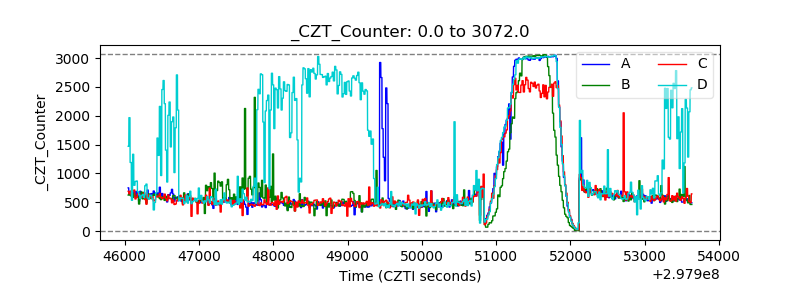 |
| +2.5 Volts monitor | 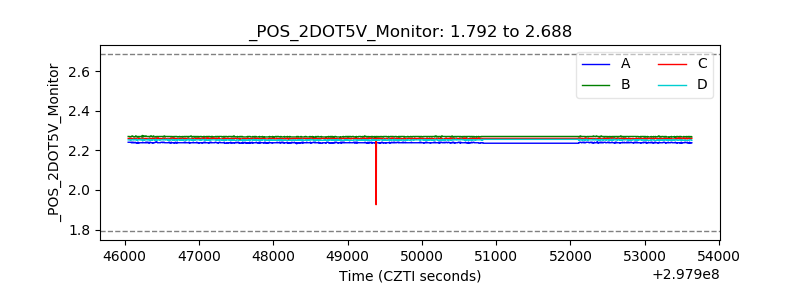 |
| +5 Volts monitor | 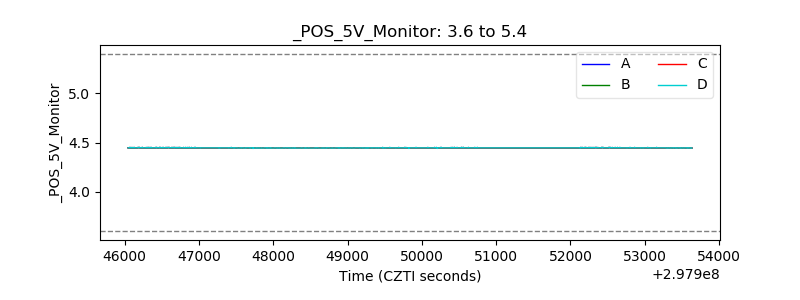 |
| _ROLL_ROT | 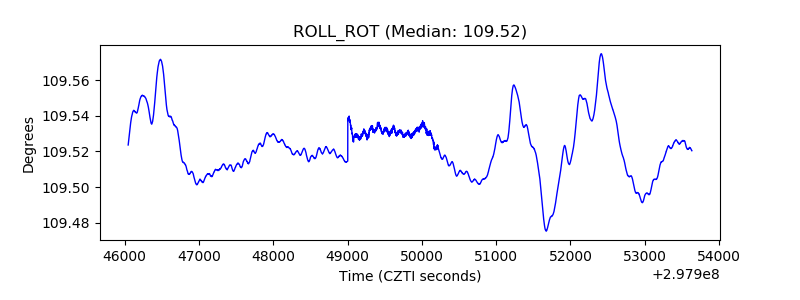 |
| _Roll_DEC | 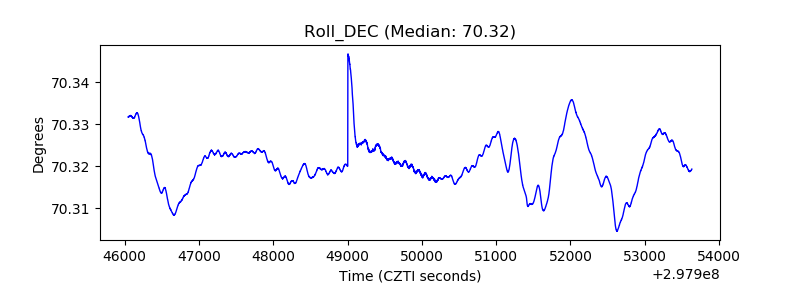 |
| _Roll_RA | 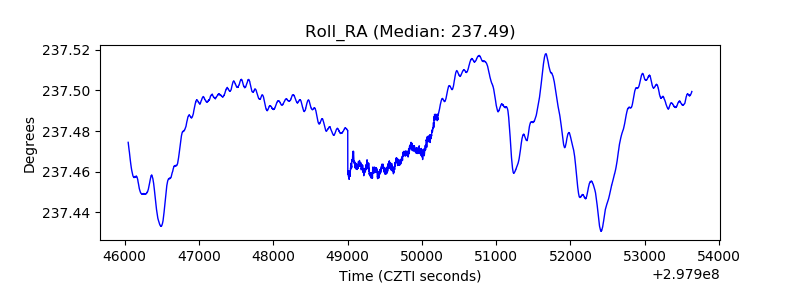 |
| Veto Counter | 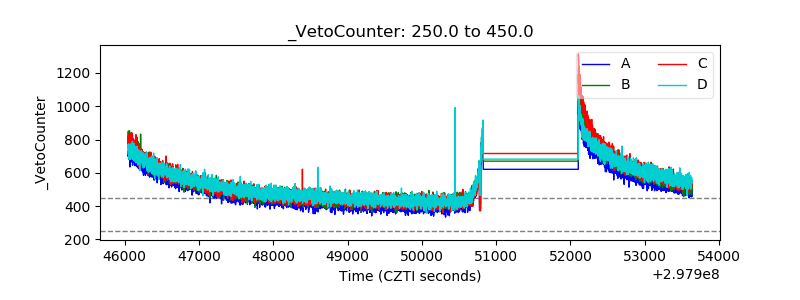 |